The following charts are updated to Dec 25, 2020
The European Union is the third largest economy in the world. Its shared currency, Euro, is the second largest currency in terms of trading volume and the second largest reserve currency. ICE’s US dollar index is nearly 60% Euro, therefore the Euro has direct impact on the US dollar. See all 11 indicators here.
The Euro in the past 20 years had four phases:
- Before the Financial Crisis, Euro had a long rising streak for many years, as the EU was growing faster than the US.
- During 2010 to 2012, Europe was caught up in the debt crisis. ECB’s easing programs switched on and off with unstable inflation data, leading to oscillations in the Euro.
- From 2014 to 2016, Euro reached rockbottom as a result of ECB’s QE.
- From 2018 to 2019, the European economy slowed down, as US-China trade war escalated. Inflation dipped; ECB relaunched QE programs, bringinig Euro down low.
SUPPLY
ECB administers Euro through adjusting interest rates, buying government bonds, operating refinancing, etc, to manage the price and provision of Euro. The larger the supply, the lower its exchange rate.
The one indicator that enables the Central bank to increase/decrease its monetary supply is inflation. For now, ECB will do everything it can to raise inflation to just below 2%.
Its number one tool: Interest rate.

Every major rate decision from the Central bank can give its currency either a heavy blow or lift. ECB last cut deposit facility rate to -0.5% in September 2019, as tensions between the US and China overspilled. Eurozone’s manufacturing production and exports went down, causing inflation in the Eurozone to decrease. The Euro has been subdued since ECB first implemented negative interest rates in June 2014 when Eurozone slipped into deflation.
2. Excess reserves

Excess reserves can be considered as the “extra savings” deposited by financial institutions in the Central bank. When Central bank implements easing, funds in excess will be re-deposited back to the Central bank, known as “excess reserves”, and it’s a sign of oversupply. ECB, after going through the European debt criss and deflation crisis, has gradually deepened its easing program to a point where its excess reserves have exceeded Fed’s excess reserves. The Euro, as a result, has been on decline against the US dollar.
3. HICP

While inflation remains the most critical factor in all Central banks’ policymaking, it’s difficult for ECB to set a common goal on economic growth for all 19 member states, so unlike other Central banks who also take other eocnomic indicators into account, ECB’s primary goal is to stabilize consumer price.
Eurozone Harmonised Index of Consumer Price is composed of all member states’ consumer price. Starting from 2013, inflation slipped under target. Alarmed by declining inflation, ECB later implemented negative interest rates. Euro inevitably embarked on its downward trend. By 2018 and 2019, global demand was overshadowed by the tariff war between the US and China. ECB was forced to re-introduce large-scaled easing programs.
4. PPI

The difference between PPI and HICP is the leading indicator for inflation, because the increased costs of production will lead to an increase in the price of goods. The spread shows a correlation coefficient of 0.75 with HICP, so it serves as a leading indicator for ECB’s future policy as well.
In 2020, global production and demand softened due to the pandemic. As governments shut down all economic activities to contain the virus, ECB, since March, has announced a series of easing programs, including unlimited bond purchases, TILTRO III, and large capital injections into short-term monetary market, in order to prevent the chain reaction of corporate defaults. Looking ahead, we will keep monitoring HICP and the economic fundamentals within the EU to predict whether these policies will last.
DEMAND
Demand for Euro declines when demand for the US dollar rises. As the US dollar cycle enters the third phase, fund flows redirect to the US to hedge; risk-aversion rises. Following are 5 more indicators to monitor global demand for Euro:
- The US and Germany 10-year bond yield spread, which reflects the economic growth difference between the US and Europe
- Italy and Germany 10-year bond yield spread, which reflects the economic growth difference between the EU member states
- Credit risk spread, which reflects corporate default risks
- Consumer confidence
- The automobile industry
5. US-DE spread

When US and Germany 10-year bond yield spread widens, Euro is likely to fall. When the rest of the world is relatively sluggish compared to the US, investors prefer to invest in the US amid such uncertainties, causing demand for Euro to decline.
6. IT-DE spread

The disparity within the EU in terms of economic growth can’t be overlooked. Some European countries have fragile financial conditions, for example, the PIIGS. Germany’s 10-year government bond is seen as risk-free, while Italy’s public bonds incur high risks of insolvency. Risks increase when spread between the two widens.
Spread surged the most in 2012 during European debt crisis, causing Euro to slide.
7. Credit risk spread

Corporate bond yields soar when corporates go through a hard time making profits. The spread between high-yield corporate bonds and a risk-free asset (such as Germany’s 10-year government bond) represents credit risk. As corporate default risks soar, demand for Euro gets affected.
8. MM fundamental index for automobile

Germany is the biggest economy among all EU member states, whose GDP alone accounts for 20 to 30% of Eurozone’s GDP. Germany’s car exports are one of the main drivers of Germany’s economic growth, so the global car market has an indirect impact on Eurozone’s trade volume. Euro is likely to strengthen with MMFI for automobile going higher than 0.
From 2014 to 2015, the US automobile industry was expanding, but Euro was soft due to the possibility of deflation and ECB's QE programs.
9. Eurozone Economic Sentiment Indicator
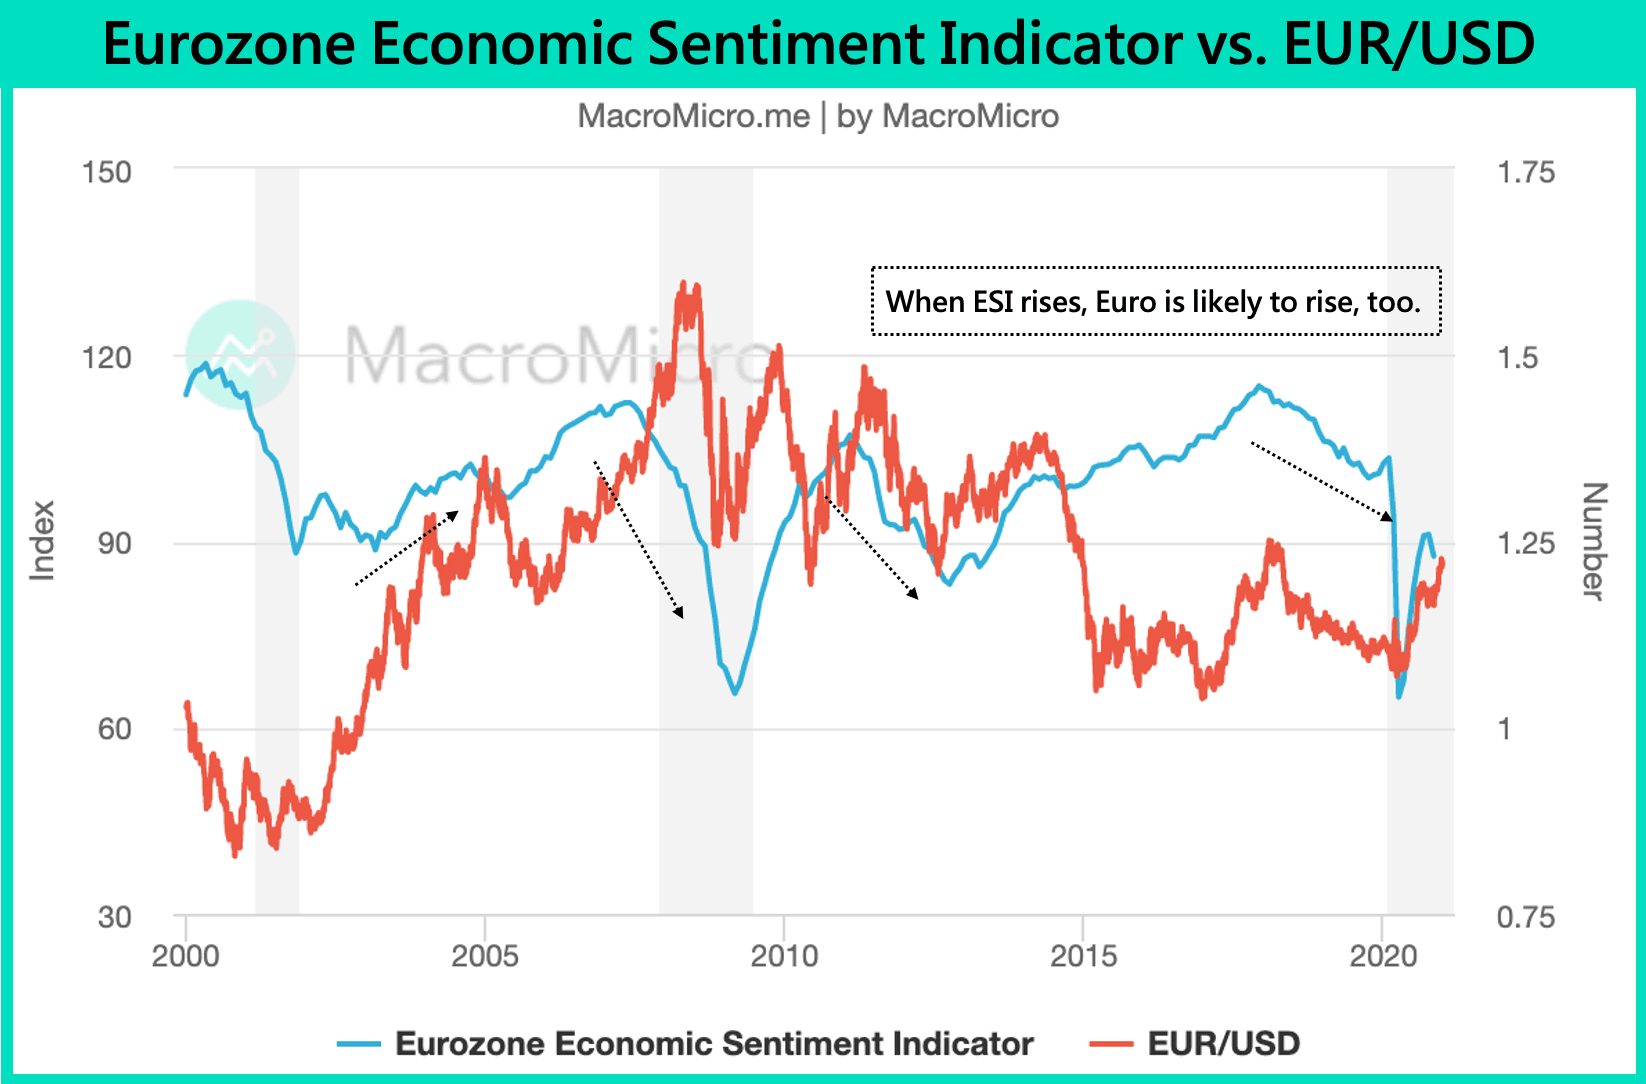
Economic sentiment reflects consumer and corporate’ expectations for the future, so when sentiment indicator rises, demand for Euro might rise, too.
10. Euro COT Index

When COT index rises above 0, large traders are in long positions for Euro.
11. MMFI for Euro
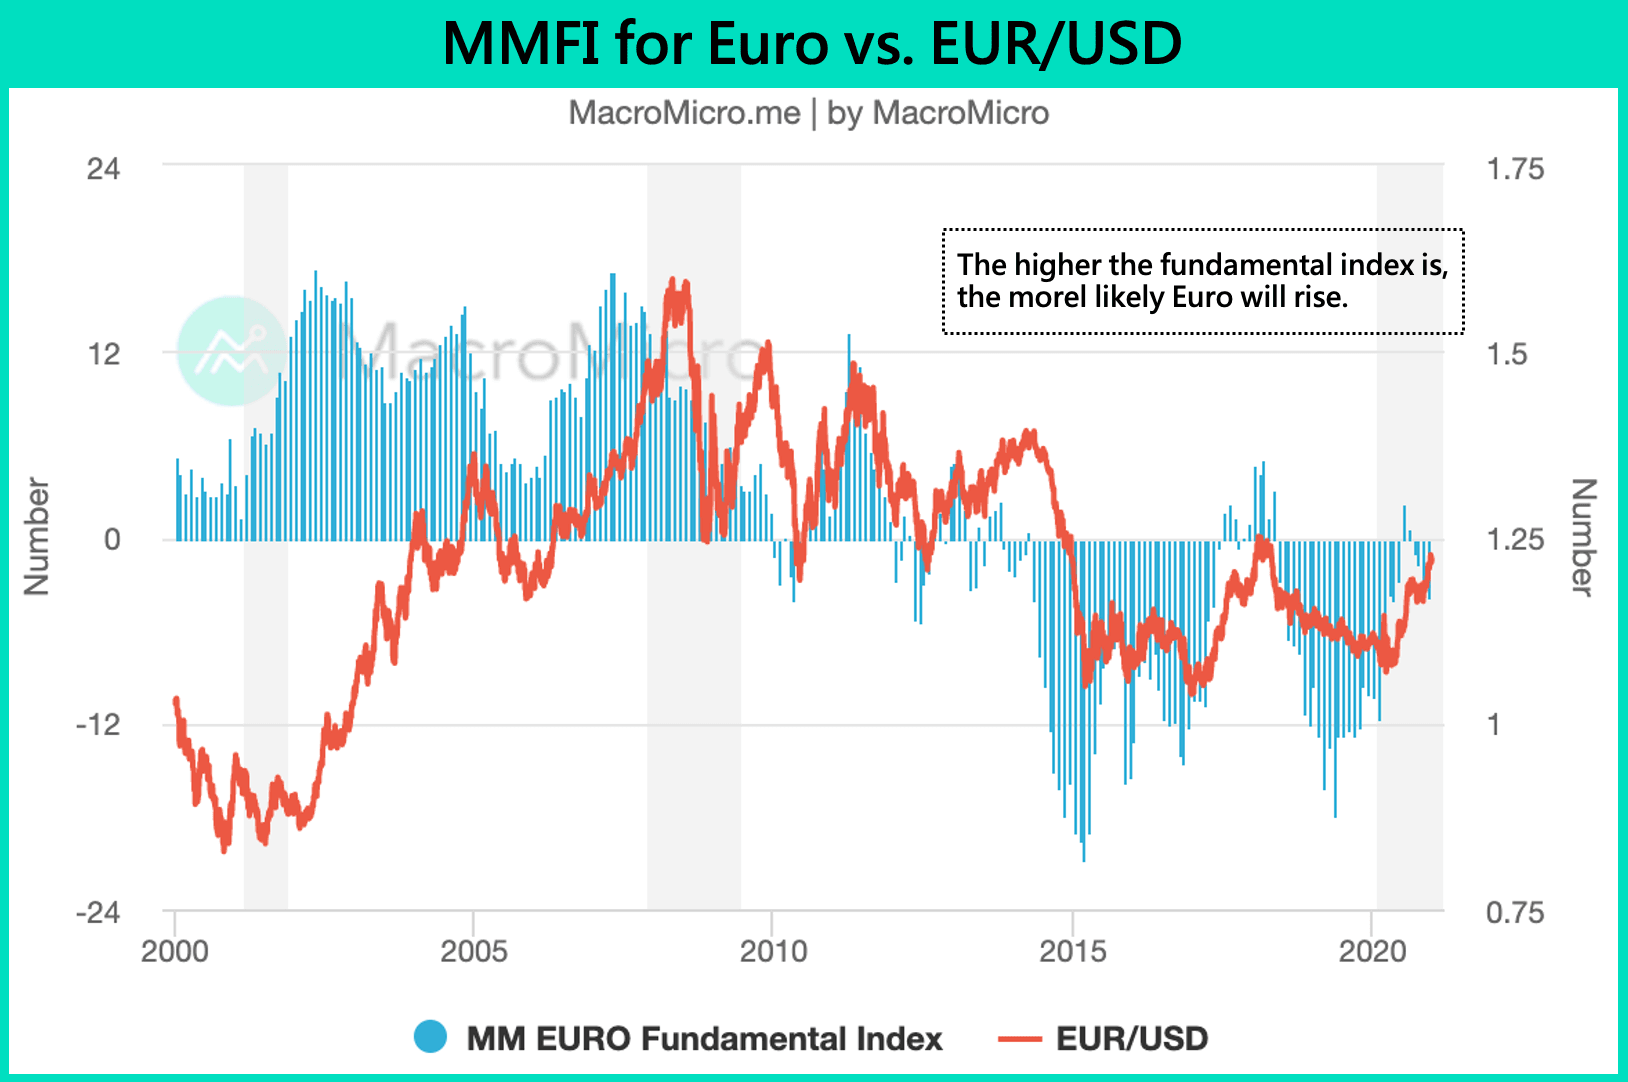
Based on the first previous 10 indicators, we compiled a fundamental index for Euro. Among all factors that cause Euro to fluctuate, government policy, disparity from the US, and inflation have the heaviest weight in the index.
Our suggestion is to monitor the US dollar at the same time while trading Euro, because Euro is largely traded against the US dollar. Unlike the US dollar index, Euro index hasn’t gained as much popularity in the market.
