Guides to macro investment and global research
MM House View
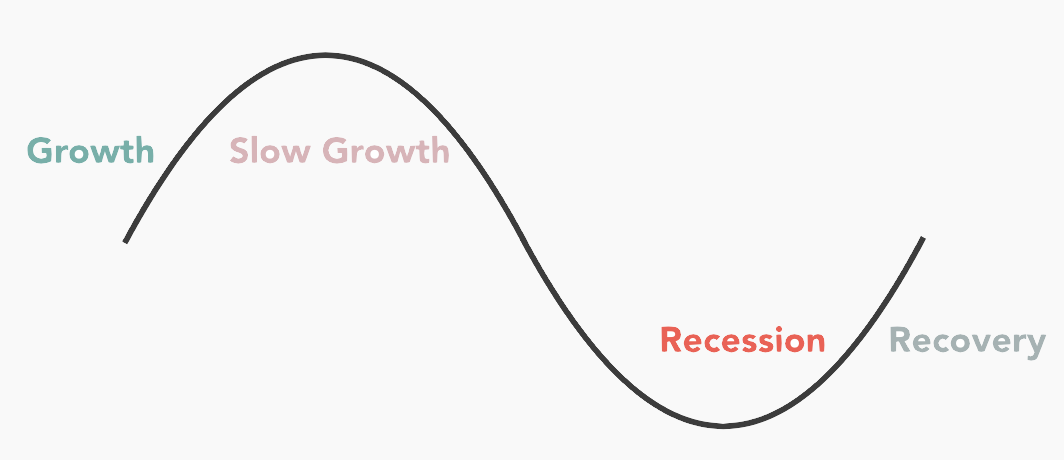
Economic Cycles:
Economic cycles, sometimes referred to as business cycles, are driven by human behaviors. Economic cycles are divided into four distinct segments: expansion, slowdown, recession, and recovery.
What causes economic cycles?
Herd mentality and the urge to maximize profits are typical human behaviors that cause the economy to rally and crash. Financial markets in the past 300 years have shown such pattern.
How does it relate to you?
Each economic phase calls for a different asset allocation strategy. Measuring cycles in the data, MacroMicro presents key market trends and directions, which can help you find fitting investment targets and raise the odds of investment success.
Charts and Insights
Blog
Spotlight
Charts that reveal insights and opportunities
Tools and Functions
Macro
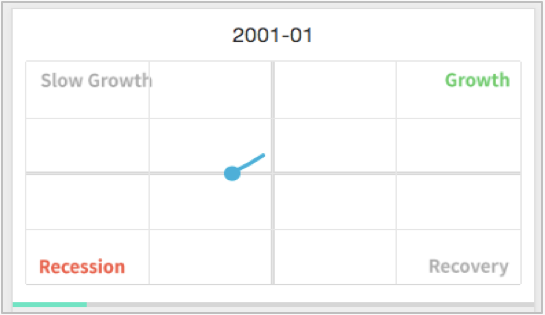
You can find the Global Economic Cycle Clock and other macro data of different economies here.
ETF Screener
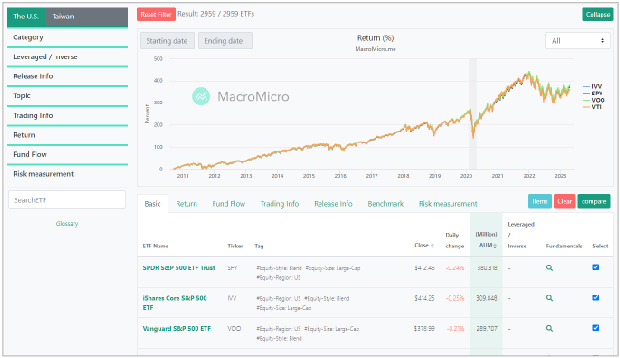
Use our ETF screener to find ETFs and underlying assets of your interest. Stay up to date on the latest ETF fundamentals with our automatically-updated charts and visuals.
Featured Chart
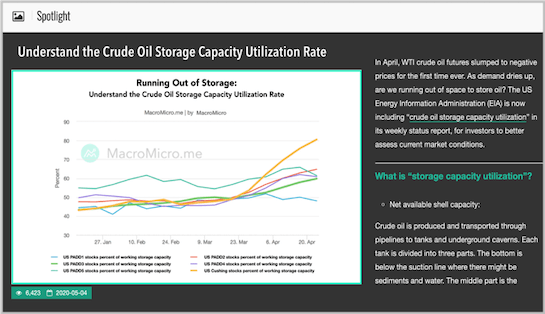
MacroMicro’s analyst team finds crucial insights in macro data and shares them in featured chart articles in the Spotlight section.
Quant
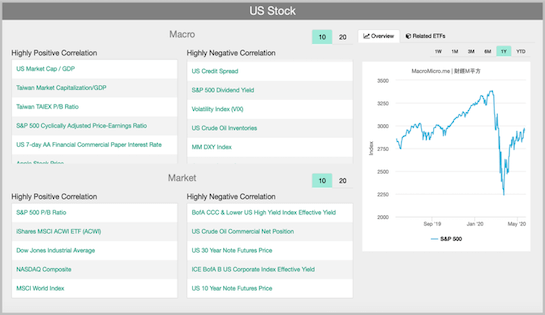
Our data computing reveals relevance between data and asset prices. Quant is the perfect section that powers your trading strategies.
Market
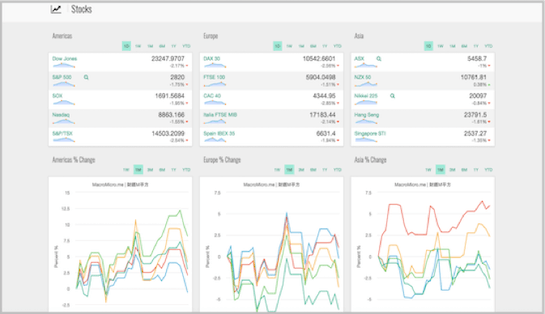
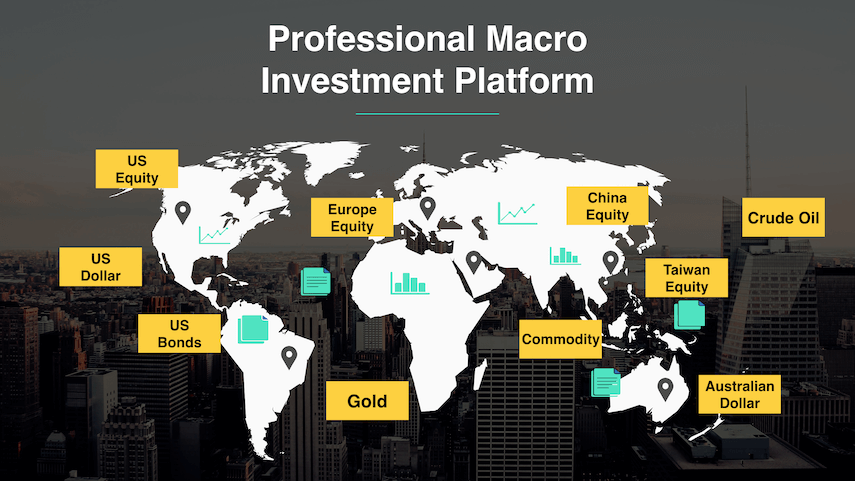
MacroMicro offers a real-time trading dashboard covering global markets and asset classes, and even COT data of institutional traders.
FAQ
Click on the square profile photo in the upper right corner to go to Member Profile, where you can update your user name, contact email, login password, newsletter subscription preference, single sign-on preference and more.
Each MacroMicro member can log into their accounts on up to 2 devices at once (Please refer to Clause 2-2 of our Terms of Service).
We recommend new members start with the Macro section, where we have compiled various collections of macroeconomic data and insights of seven key economies, such as GDP, consumption, prices, trade, etc.
The Macro section also includes top charts, interactive data about economic cycles of different countries at different time periods, as well as selected indicators that may signal turning points in the market.
SA refers to ''seasonal adjustment,'' which is a statistical method used to remove effects of seasonal patterns in a dataset.
SAAR stands for ''seasonally adjusted annual rate,'' which means the data is seasonally adjusted and converted into an annualized rate.
We mark a dataset with ''(SA, YoY)'' to indicate that the data has been seasonally adjusted and is compared with the same period last year (also known ''year-on-year''). Indicators not accompanied with any of these abbreviations are generally not seasonally adjusted (NSA). MoM and QoQ mean the data is compared with the previous month or quarter.
Lastly, there is also CA, which stands for ''calendar adjustment,'' a statistical method for removing the calendar effects from the data, taking into account variation in the number of holidays in different months.
Take GDP as an example. Different countries have different ways of calculating and displaying GDP data. The United States generally displays GDP data in the SAAR format; the European Union uses both QoQ and YoY formats; Japan, South Korea, and Taiwan use all three formats.
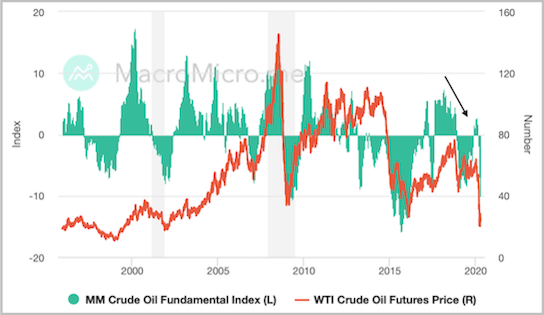
''L'' and ''R'' refer to left and right axes. That is, L indicates the value is plotted on the Y-axis on the left, and R means the value is plotted on the Y-axis on the right.
The gray shading marks periods of recessions as identified by the National Bureau of Economic Research (NBER), which is a key source of information for professional institutions around the world. For more information, please see here.
Users are welcome to cite charts from MacroMicro but should follow the rules below. (For more information about citation, please refer to Article 8 Protection of Intellectual Property Rights of our Terms of Service)
-
Articles: for each article, only a small portion of the text may be cited, and ''MacroMicro'' should be clearly specified as the source. When quoting our articles in digital content, a link to the original article should be included. For authorization to use any article in full, please contact us at [email protected] for permission.
-
Charts: please retain the original logo watermark when citing our charts, and please clearly specify ''MacroMicro'' as the source. When citing our charts in digital content, a link to the original chart should be included. For commercial use such as using our charts in books, please contact us at [email protected].
Currently we do not have an app, but mobile phone users can add the MacroMicro website to their home screens using shortcut settings. For detailed instructions, please refer to our Facebook post here.
Offering the download function has always been under our consideration, but this functionality would significantly increase the server resources needed and would require raising costs on users. As such, we do not offer data download functionality at the moment.
Like four seasons in a year, the economy also operates in cycles known as ''business cycles'' or ''economic cycles.'' Economic cycles vary in length. From expansion, slowdown, recession to recovery, an economic cycle can last as short as 3-4 years or as long as 10-20 years or more. When we hear people say the economy is improving, it means that it is in the phase of recovery or expansion, while a weakening economy would refer to the slowdown or recession phase of an economic cycle.
Leveraging the power of quantitative analysis, we have compiled 25 key indices, known as the MM Fundamental Indices(MMFIs), covering global stocks, foreign exchange, bonds, and raw materials, to provide users a quick way to understand the fundamentals of different asset classes. Users can look at the value and overall trend of each MM Fundamental Index. A high index value indicates strong fundamentals, and an upward trend indicates improvement in fundamentals.
