The graphics and images in this article are produced in early September.
Since the aftermath of World War II, only three out of eleven presidents seeking the second term of Presidency failed to get re-elected. They were Gerard Ford in 1977, Jimmy Carter in 1981, and George W Bush in 1993.
By the end of 2019, the general sentiment in the market was that Donald Trump will get re-elected. University of Yale, Moody’s Analytics, and Oxford Economics predicted that Trump would win over Biden.
And then COVID-19 happened. The consequent lockdowns and 5 million infected cases across America have caused the economy to slump and unemployment rate to reach record high. According to poll institution Real Clear Politics, Trump’s job approval has dropped from 45.6% in February to 41.7% mid-April, 2020.
Later in May, thousands of Americans took it to the streets demonstrating against racial discrimination after George Floyd died in the hospital after being arrested by the police in Minnesota. President Trump referred to some of the rioters as “fascists” and “anarchists” and threatened to quell the protests by military force. The President’s job approval then fell to 40% amid his aggressive remarks against the protesters, and has once fallen behind Biden by over 10%.
How should we predict the election result?
- Polls aren’t always accurate. Swing states polls are the key.
A presidential candidate needs at least 270 electoral votes to become President. This year, the Democrats need to foucs on Florida, Ohio, and the Rust Belt. Read on for details!
- Job approval reveals the likelihood of re-election. Betting odds are indicative, too.
Historically, if the sitting President’s job approval stays above 50%, his second-term is most likely secured. On the other hand, if his job approval falls under 40%, he’s likely to leave office after 4 years. President Trump’s job approval has been hovering between 37% to 47% and has never exceeded the 50%. The betting odds favoring Biden have been much higher than Trump since early June, although the gap is closing.
- How do we see it?
Judgin from the polls, Biden has an overall lead right now, but we’d like to remain skeptical and keep every factor under watch.
Biden’s lead in the national polls isn’t a guarantee because, in 2016, despite winning the popular vote by nearly 3 million votes, Hilary Clinton still lost the election with 227 electoral votes to Trump’s 304 electoral votes. Trump took office being the fifth President in history who has lost the popular vote.
This year, we focus on Swing States, besides which there are also the “Blue Democratic States” and the “Red Republican States”.
▌ Blue States and their number of electoral votes
The Blue States are on the West coast and in the New England region, including California (55), New York (29), Illinois (20), New Jersey (14), Washington (12), Massachusetts (11), and Hawaii (4).
▌ Red States and their number of electoral votes
The Southern and mid-West America are mostly Red States, including Texas (38), Georgia (16), Arizona (11), Tennessee (11), Missouri (10), and Alaska (3).
▌ Swing States and their number of electoral votes
Swing States, or the “battleground states”, are states that can neither be Democratic nor Republican. The all-time swing states include Florida (29), Ohio (18), North Carolina (15), Virginia (13), Colorado (9), and Iowa (6).
The graphic below showcases the blue, red and swing states based on election result for the past 20 years. Swing states hold 99 critical votes that can determine who’s going to be the next President of the United States.

Solid states voted for the same party in the past 5 elections
Lean states voted for the same party for 3 or 4 times in the past 5 elections
Swing states shifted from one party to another in the past 2 elections
Scenario I: Trump needs Florida to get re-elected.

Florida and Ohio are highly indicative of the election result. Almost every President since the second World War has won Florida and Ohio.
If Biden wins Florida, he gains 260 electoral votes. All he needs is another swing state and he’ll cross the winning threshold.
If Trump wins Florida, he still needs another 35 electoral votes to win the election.
Scenario II: Trump loses Florida but wins the Rust Belt.

The Rust Belt surrouding the Great Lakes are where the automotive industry used to prosper until the industrial conditions began to decline in the 1980s. Pennsylvania, Michigan, and Wisconsin—Democratic strongholds for nearly three decades—turned red in 2016. But two years later, they elected three Democratic governors. If the Democrats can turn the tables again in the General Election, Biden is likely to win with more than 270 electoral votes.
But then, there must have been a reason for the loyal voters to vote for the other side four years ago; the people of the three states are mostly middle- to advanced-aged, white, blue-collar workers who are against globalization and free trade. If Trump could win the Rust Belt with policies that can strike a chord with them, he still stands a chance.
Scenario III: Will Sun Belt go blue?
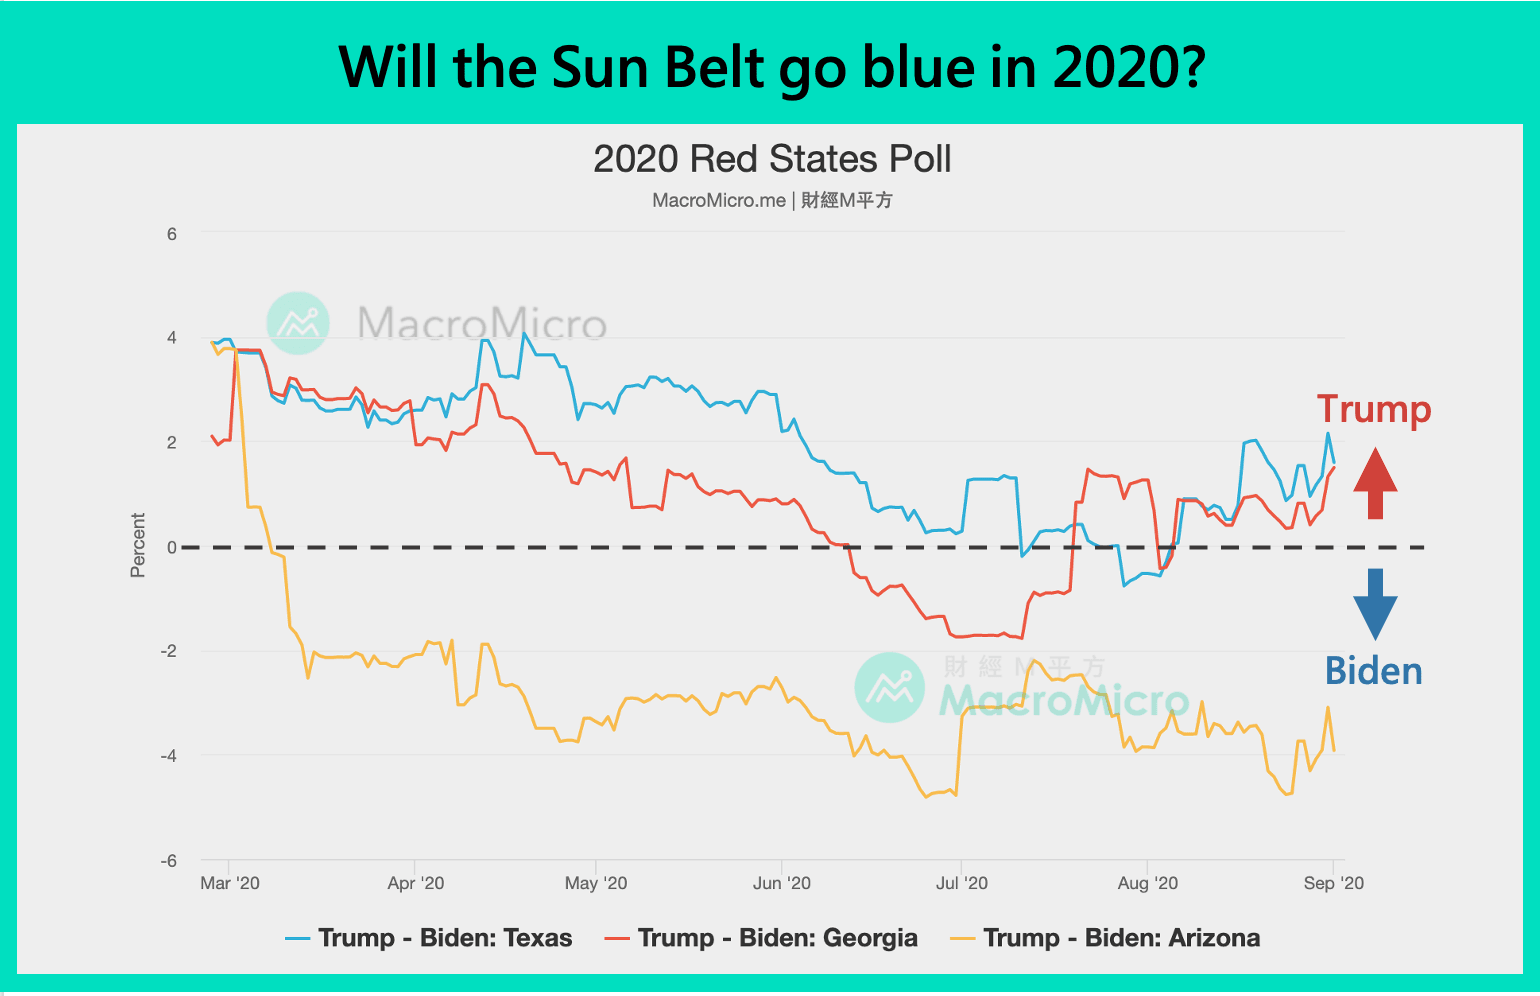
Republicans’ long-time bastions— Texas, Georgia, and Arizona are known as the Sun Belt. Nearly 40 percent of Texas’ population and over 30 percent of Arizona’s population are Latino-Americans; about 32 percent of Georgia’s population are African-Americans. The high percentage of immigrants in the Sun Belt makes it progressively likely that they go for the Democrats. If Texas goes blue this year, the odds for Biden will shorten.
In 2018 midterms, Republican Senate Ted Cruz had a narrow win by only 3%. This year, Texas, Florida and California became the epicenters of the coronavirus; Biden aimed to change the political climate there by dropping his very first TV campaign advertisement in Texas.
Most of the long-time red states are hit hard by the coronavirus this year, including Arizona.
Betting odds are also a timely indicator of the election.
▌ Job approval
According to poll institute Gallup, a high “job approval rate” is almost a guarantee for re-election. Obama, Clinton, Reagan, Nixon, Johnson, and Eisenhower had to succeeded in running for their second-term Presidency with job approval rate for their first of over 50%.
Trump’s job approval has never exceeded 50% and begun declining amid the coronavirus outbreak and the racial clashes across America. His handling of the pandemic, in particular, has become his biggest shortcoming in the face of the General election.


▌ Betting odds
Polls aren’t always accurate for a few reasons:
- The interviewees have no incentives to tell you what they really think,
- The poll questions might not be designed well enough and have contain suggestive, leading or ambiguous questions,
- Polling incurs high costs and have limited samples,
- There’s sampling error.
Prediction market and betting odds can better address some of the issues above because:
- The winners are rewarded with money,
- Unlike polls, bets don’t close,
- The result is constant renewed.
Iowa Electronic Markets is the best-known prediction market, which was established in 1988.
How do we see it?
We believe the candidates need to propose better policies on economy, healthcare, China relation, and immigration to contend for Presidency. (See previous blog on policy details)
National polls, swing states polls, job approval, and betting odds have shown that Biden has the advantage over Trump. But no one can be sure until election day. We will continue updating our General election data in Trader’s Insight, so don’t forget to follow up!
Already a subscriber? Click here to log in.
to Enjoy Full Access to Our Services

Comprehensive data at your service
with key indicators for investment insights

Exclusive flash reports
on key macro events and data

Create your own charts and analysis
including performance backtesting

Hub of macro professionals to engage
in meaningful discussions and insights
