Executive Summary
The financial markets have been recalibrating their expectations for monetary policy since the FOMC’s December meeting and their expectations for economic changes under the incoming Trump 2.0 administration since Election Day. In this context, Friday’s strong employment report only served to cement investors’ sense that the Fed should pause its easing. Both bond and stock markets reacted like the sky was falling. We’re not surprised by this January correction, and we view it as healthy: The markets are gaining a more realistic sense of the current situation, recognizing that interest rates will stay higher (i.e., normal) for longer, while the economy remains resilient. A strong Q4 earnings season should help to restore shaken investors’ confidence.
Strategy: Recalibrating the Fed
From March 2022 through August 2024, there was widespread concern that the tightening of monetary policy by the Fed over that period would cause a recession. It was the most widely anticipated recession that didn’t happen on record. Once the Fed started easing monetary policy on September 18, 2024, it was widely expected that the Fed would have to lower interest rates significantly to avert a recession. Now that scenario has lost its credibility, especially following Friday’s strong employment report for December.
The bond and stock markets have been recalibrating the outlook for the Federal Reserve’s monetary policy. The Fed cut the federal funds rate (FFR) by 100bps from September 18 through December 18 and signaled that more cuts are ahead in 2025. Bond market action suggests that investors have come around to our view that the Fed was stimulating an economy that didn’t need to be stimulated and that inflation was getting sticky north of the Fed’s 2.0% target. We argued that the economic and inflation data were signaling that the so-called neutral FFR was closer to 4.0%-5.0% than to 3.0%. We disagreed with the Fed’s view that the FFR was too restrictive when it was around 5.0%. ▌View Related Live Charts: US - Federal Funds Rate, US - Federal Fund Interest Rates
Our view has rapidly become the consensus view in recent weeks, especially after Friday’s strong employment report. That view can be described as a “higher-for-longer” interest-rate outlook, but “normal-for-longer” is the way we prefer to look at it. One of the reasons that we dissented over the past three years from the consensus forecast that a recession was coming is that we believed that the Fed’s monetary tightening simply brought interest rates back up to their normal levels in the years prior to the Great Financial Crisis and wouldn’t unduly stress the financial system, culminating in a recession.
 ▌View Related Live Charts: US - Treasury Yields vs. Fed Funds Rate
In his September 18, 2024 press conference, Fed Chair Jerome Powell said that the 50bps cut in the FFR announced that day by the Federal Open Market Committee (FOMC) was simply a recalibration of monetary policy: “So we know that it is time to recalibrate our policy to something that is more appropriate given the progress on inflation and on employment moving to a more sustainable level. So the balance of risks are now even. And this is the beginning of that process I mentioned, the direction of which is toward a sense of neutral, and we’ll move as fast or as slow as we think is appropriate in real time.”
We and our friends the Bond Vigilantes disagreed with the Fed’s recalibration. Our August 19 Morning Briefing was titled “Get Ready To Short Bonds?” We argued that the economy was in a soft patch that wouldn’t last too long. We predicted: “Bond investors may be expecting too many interest-rate cuts too soon if in fact August’s economic indicators rebound from July levels and the Fed pushes back against the markets’ current expectations for monetary policy. So we are expecting to see the 10-year Treasury bond yield back in a range between 4.00% and 4.50% next month.”
Much to our consternation, instead of pushing back against the markets’ expectations, the Fed cut the FFR by 50bps on September 18 and Powell signaled that more rate cuts were coming. We pushed back against the Fed. Our October 15 Morning Briefing was titled “Will Fed Get Stuck With Sticky Inflation?” We wrote: “By cutting interest rates despite strong economic growth, the Fed now risks overstimulating demand and reviving inflation. Services and wage inflation remain sticky, raising the risk that headline inflation gets stuck above 2.0%. The bond market agrees with our assessment that the Fed turned abruptly too dovish recently, boosting market expectations for long-term inflation higher.”
So now that the Fed has cut the FFR by 100bps since September 18, 2024, the 10-year bond yield is up 114bps since September 16, 2024. Even the 2-year Treasury note yield is up 91bps since September 24, 2024. Since the last FFR cut, on December 18, the number of additional 25bps rate cuts expected by the FFR futures market has declined from two to one over the next 12 months and none over the next six months (Fig. 3).


In early December, the stock market started to recalibrate the outlook for interest rates to higher-for-longer. Consider the following:
(1) The S&P 500 market-cap-weighted stock price index peaked at a record 6090.27 on December 6 and fell 4.3% through Friday’s close to 5827.04. It is 2.4% below its 50-day moving average. If it drops to its current 200-day moving average, that would be an 8.1% pullback from the peak.
 ▌View Related Live Charts: US - S&P 500, US - S&P 500 Share of Stocks Above 50-Day Moving Average by Sector, US - S&P 500 Share of Stocks Above 200-Day Moving Average by Sector
The S&P 500 equal-weighted stock price index is down 7.5% from its November 29 peak and only slightly above its 200-day moving average.

(2) The Nasdaq peaked at a record high of 20,173.89 on December 16. It is down 5.0% since then, to below its 50-day moving average. Its 200-day moving average is currently 17,881.5.
 ▌View Related Live Charts: US - NASDAQ 100 Stocks Above 50-Day & 200-Day Average
(3) The Russell 2000 peaked at 2442.03 on November 25, matching its high at the end of 2021. It is down 10.4% since then. So it is officially in a correction. We have not been keen on SMidCaps in general, and particularly not on the Russell 2000, because their earnings have been flatlining since 2022.
 ▌View Related Live Charts: US - Russell 2000 Index, US - Russell 2000 Stocks Above 200-Day Average
(4) Since Election Day, the following stock price indexes are down: the Dow Jones Industrials Average (-0.7%), the S&P 500 Equal-Weighted (-3.0), and the Russell 2000 (-3.2). Still up since then are the Magnifient-7 stocks (12.2) as well as the Nasdaq (3.9), Nasdaq 100 (3.1), and S&P 500 (0.8).
 ▌View Related Live Charts: US - Magnificent Seven Total Market Cap and Share of S&P 500, US - NASDAQ Composite, US - NASDAQ 100, US - S&P 500, CBOE - DJIA Volatility Index, US - Russell 2000 Index
(5) We anticipated this stock market correction at the end of last year. In the December 17 Morning Briefing, we wrote: “With bullishness abounding, contrarian indicators are flashing red, and we see the potential for a market correction early next year.” Our major concern was that the stock market was discounting too many FFR rate cuts, while the bond market was signaling that the Fed had already cut the rate by too much. Friday’s stock market rout suggests that stock investors have recalibrated their interest-rate outlook to higher-for-longer, a.k.a. normal-for-longer.
The animal spirits unleashed when President Donald Trump won a second term in office on November 5 have been subdued by more realistic outlooks for both Fed policy and the policy stew cooked up by Trump 2.0.
(6) Another important development: Stock market sentiment is turning less bullish, which is a positive from a contrarian perspective. The Investor Intelligence and AAII bull/bear ratios have dropped sharply over the past couple of weeks and undoubtedly did so again this past week.
 ▌View Related Live Charts: US - AAII Investor Sentiment Survey (Cumulative Total)
(7) More downside for stock prices is likely this week if December’s CPI, which will be released on Tuesday, is as hot as the Cleveland Fed’s Inflation Nowcasting tracking model shows—i.e., a 0.38% increase in the headline rate. The core rate indicated is less than that, however, at 0.27%. These m/m increases would put December’s y/y readings at 2.9% and 3.3%. ▌View Related Live Charts: US - Consumer Price Index (CPI)
However, the downside may be short-lived. We are still expecting that the Q4-2024 earnings reporting season, which starts this week, will show at least a 10% y/y increase in S&P 500 companies’ aggregate operating earnings per share. The analysts’ consensus is 8.2% currently. The big banks will start the reporting off at the end of this week. Their results should be strong. In addition, their managements might discuss how deregulation under Trump 2.0 might boost their earnings.
 ▌View Related Live Charts: US - S&P 500 EPS
US Economy: A Solid Labor Market
“The sky is falling! Get out of the way!” That was the reaction of the stock and bond markets on Friday to the stronger-than-expected employment report as investors rushed to sell both stocks and bonds. Is such good news for the economy really bad news for investors? Not in our opinion. Consider the following:
(1) December’s payroll employment increased 256,000, beating expectations after November’s increase of 212,000 was less than expected. Those surprises were mostly attributable to retail sales payrolls, which fell 29,200 in November and increased 43,400 last month. That was attributable to a late Thanksgiving holiday.
The three-month moving average of the monthly changes in total and private payrolls were 170,000 and 138,000 through December. Those are in line with the paces of 2018 and 2019 and consistent with our view that the labor has normalized following the tight conditions during the pandemic years.
 ▌View Related Live Charts: US - Nonfarm Payrolls vs. Unemployment Rate, US - Nonfarm Payrolls (Monthly Change, Cumulative Revisions of Past 2 Months)
(2) Aggregate weekly hours rose 0.2% m/m to another record high last month, while average hourly earnings (AHE) increased 0.3% m/m. As a result, our Earned Income Proxy for private-industry wages and salaries in personal income rose 0.5% to another record high. This augurs well for other measures of consumer income and consumer spending during December, which will be reported over the rest of this month.
 ▌View Related Live Charts: US - Average Weekly Working Hours
 ▌View Related Live Charts: US - Total Private Average Weekly Earnings, US - Average Hourly Earnings - Retail Trade, US - Average Hourly Earnings - Total Goods Producing
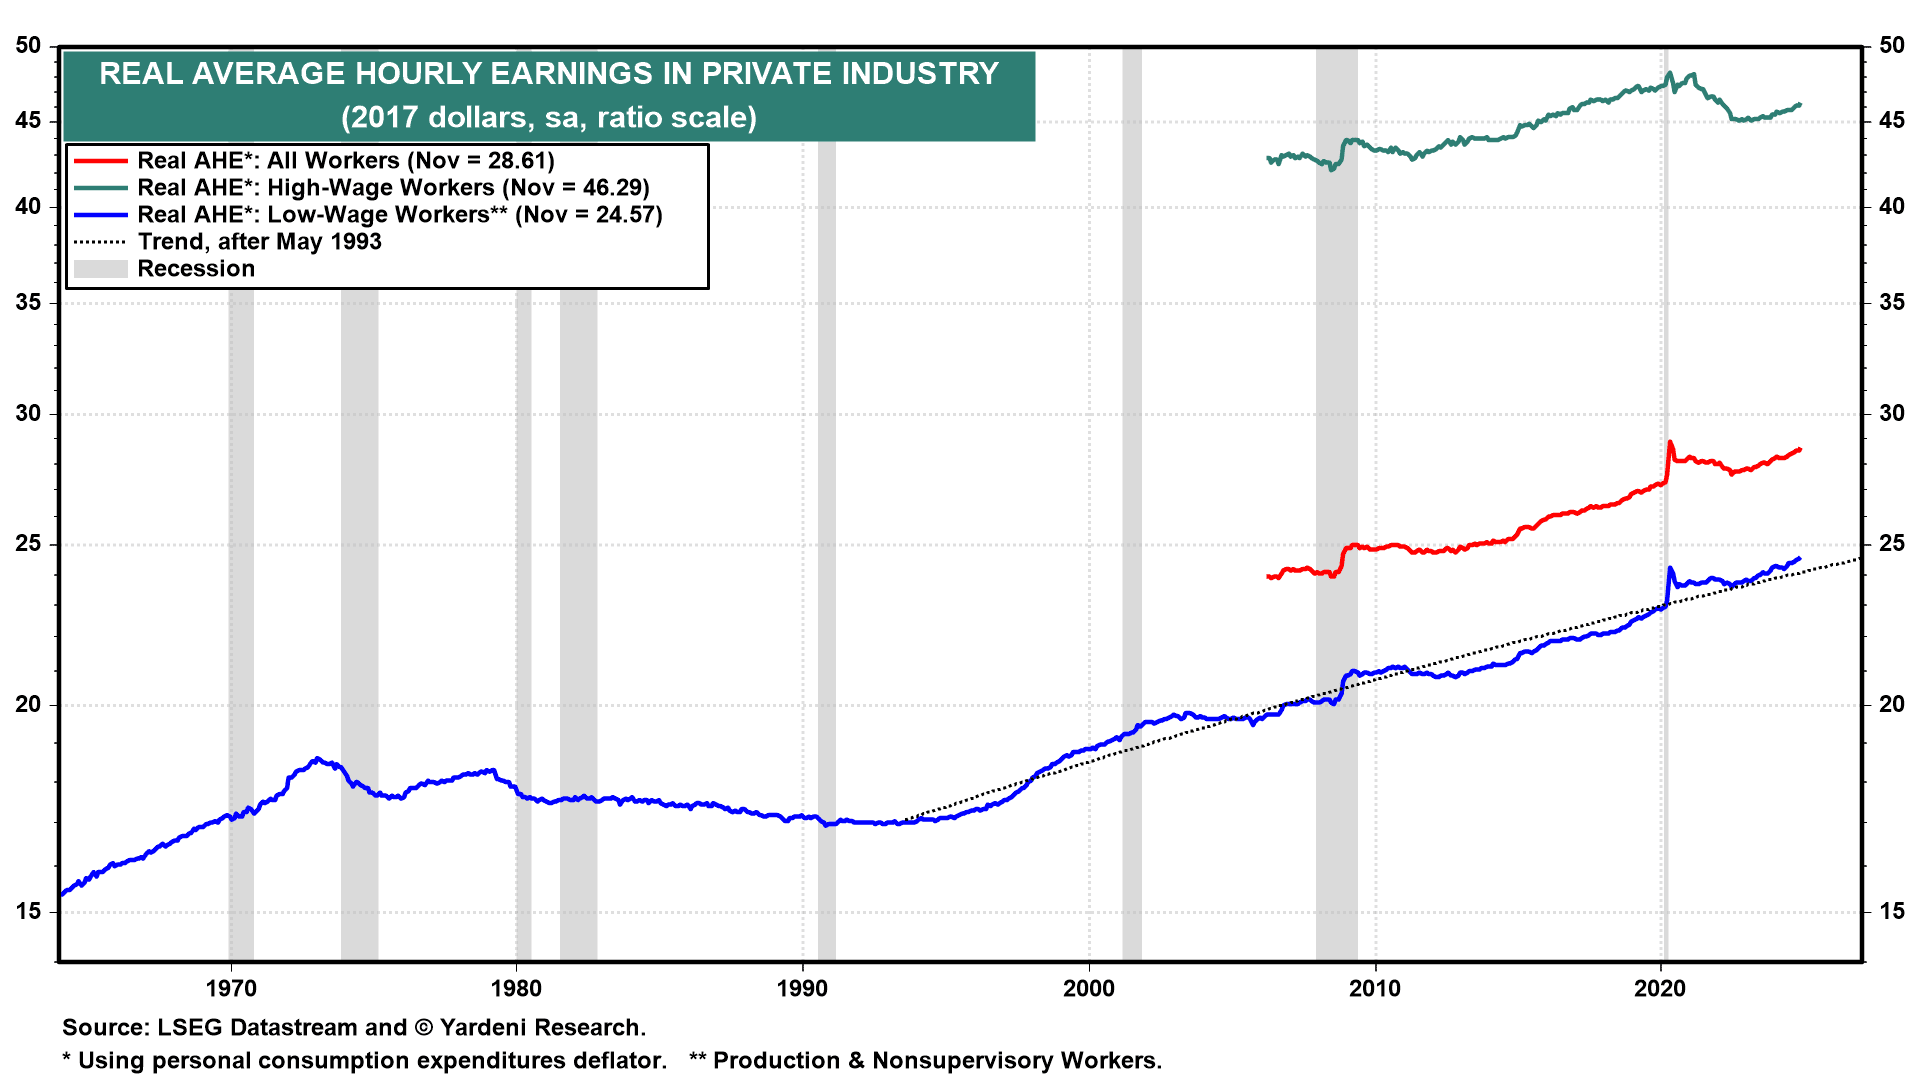
(3) AHE for all workers has been rising faster than consumer prices since early last year, suggesting that productivity growth has rebounded from the pandemic levels.
 ▌View Related Live Charts: US - Average Hourly Earnings - Total Private Service Providing
(4) December’s unemployment rate edged down to 4.1% from 4.2% the month before. Layoffs and initial unemployment claims remain low. There are plenty of job openings. The only issue we see in the labor market is that the average weekly duration of unemployment has risen from 20.6 weeks during July to 23.7 weeks last month. It may be taking longer to find a job because of skills mismatches.

Commodities: An Oily Policy Change
The price of a barrel of a barrel of Brent crude oil rose by $5.12 to $79.76 since the start of the new year through Friday’s close. Initially, the rally was driven by cold weather in the US and Europe. In addition, the Chinese government announced plans for more fiscal stimulus to revive China’s economy.
 ▌View Related Live Charts: MM Crude Oil Fundamental Index
Last week on Friday, the Biden administration imposed new sanctions on Russia. They target more than 180 vessels from Russia’s fleet of shadow tankers that Moscow has used to evade existing oil sanctions. They also blacklist two leading Russian oil producers, Gazprom Neft and Surgutneftegas, and their subsidiaries.
According to The New York Times report, Daleep Singh, the deputy national security adviser for international economics, said it was a “fair question” to ask why Mr. Biden waited until the end of the administration to impose such sanctions.
It might give the Trump administration more bargaining power over Russia in negotiating an end to that country’s war with Ukraine. It might also leave the new administration with an inflation problem that will further unsettle the bond and stock markets. Then again, Trump will probably counter by announcing lots of oil leases on federal land.
Executive Summary
The financial markets have been recalibrating their expectations for monetary policy since the FOMC’s December meeting and their expectations for economic changes under the incoming Trump 2.0 administration since Election Day. In this context, Friday’s strong employment report only served to cement investors’ sense that the Fed should pause its easing. Both bond and stock markets reacted like the sky was falling. We’re not surprised by this January correction, and we view it as healthy: The markets are gaining a more realistic sense of the current situation, recognizing that interest rates will stay higher (i.e., normal) for longer, while the economy remains resilient. A strong Q4 earnings season should help to restore shaken investors’ confidence.
Strategy: Recalibrating the Fed
From March 2022 through August 2024, there was widespread concern that the tightening of monetary policy by the Fed over that period would cause a recession. It was the most widely anticipated recession that didn’t happen on record. Once the Fed started easing monetary policy on September 18, 2024, it was widely expected that the Fed would have to lower interest rates significantly to avert a recession. Now that scenario has lost its credibility, especially following Friday’s strong employment report for December.
The bond and stock markets have been recalibrating the outlook for the Federal Reserve’s monetary policy. The Fed cut the federal funds rate (FFR) by 100bps from September 18 through December 18 and signaled that more cuts are ahead in 2025. Bond market action suggests that investors have come around to our view that the Fed was stimulating an economy that didn’t need to be stimulated and that inflation was getting sticky north of the Fed’s 2.0% target. We argued that the economic and inflation data were signaling that the so-called neutral FFR was closer to 4.0%-5.0% than to 3.0%. We disagreed with the Fed’s view that the FFR was too restrictive when it was around 5.0%. ▌View Related Live Charts: US - Federal Funds Rate, US - Federal Fund Interest Rates
Our view has rapidly become the consensus view in recent weeks, especially after Friday’s strong employment report. That view can be described as a “higher-for-longer” interest-rate outlook, but “normal-for-longer” is the way we prefer to look at it. One of the reasons that we dissented over the past three years from the consensus forecast that a recession was coming is that we believed that the Fed’s monetary tightening simply brought interest rates back up to their normal levels in the years prior to the Great Financial Crisis and wouldn’t unduly stress the financial system, culminating in a recession.
▌View Related Live Charts: US - Treasury Yields vs. Fed Funds Rate
In his September 18, 2024 press conference, Fed Chair Jerome Powell said that the 50bps cut in the FFR announced that day by the Federal Open Market Committee (FOMC) was simply a recalibration of monetary policy: “So we know that it is time to recalibrate our policy to something that is more appropriate given the progress on inflation and on employment moving to a more sustainable level. So the balance of risks are now even. And this is the beginning of that process I mentioned, the direction of which is toward a sense of neutral, and we’ll move as fast or as slow as we think is appropriate in real time.”
We and our friends the Bond Vigilantes disagreed with the Fed’s recalibration. Our August 19 Morning Briefing was titled “Get Ready To Short Bonds?” We argued that the economy was in a soft patch that wouldn’t last too long. We predicted: “Bond investors may be expecting too many interest-rate cuts too soon if in fact August’s economic indicators rebound from July levels and the Fed pushes back against the markets’ current expectations for monetary policy. So we are expecting to see the 10-year Treasury bond yield back in a range between 4.00% and 4.50% next month.”
Much to our consternation, instead of pushing back against the markets’ expectations, the Fed cut the FFR by 50bps on September 18 and Powell signaled that more rate cuts were coming. We pushed back against the Fed. Our October 15 Morning Briefing was titled “Will Fed Get Stuck With Sticky Inflation?” We wrote: “By cutting interest rates despite strong economic growth, the Fed now risks overstimulating demand and reviving inflation. Services and wage inflation remain sticky, raising the risk that headline inflation gets stuck above 2.0%. The bond market agrees with our assessment that the Fed turned abruptly too dovish recently, boosting market expectations for long-term inflation higher.”
So now that the Fed has cut the FFR by 100bps since September 18, 2024, the 10-year bond yield is up 114bps since September 16, 2024. Even the 2-year Treasury note yield is up 91bps since September 24, 2024. Since the last FFR cut, on December 18, the number of additional 25bps rate cuts expected by the FFR futures market has declined from two to one over the next 12 months and none over the next six months (Fig. 3).
In early December, the stock market started to recalibrate the outlook for interest rates to higher-for-longer. Consider the following:
(1) The S&P 500 market-cap-weighted stock price index peaked at a record 6090.27 on December 6 and fell 4.3% through Friday’s close to 5827.04. It is 2.4% below its 50-day moving average. If it drops to its current 200-day moving average, that would be an 8.1% pullback from the peak.
▌View Related Live Charts: US - S&P 500, US - S&P 500 Share of Stocks Above 50-Day Moving Average by Sector, US - S&P 500 Share of Stocks Above 200-Day Moving Average by Sector
The S&P 500 equal-weighted stock price index is down 7.5% from its November 29 peak and only slightly above its 200-day moving average.
(2) The Nasdaq peaked at a record high of 20,173.89 on December 16. It is down 5.0% since then, to below its 50-day moving average. Its 200-day moving average is currently 17,881.5.
▌View Related Live Charts: US - NASDAQ 100 Stocks Above 50-Day & 200-Day Average
(3) The Russell 2000 peaked at 2442.03 on November 25, matching its high at the end of 2021. It is down 10.4% since then. So it is officially in a correction. We have not been keen on SMidCaps in general, and particularly not on the Russell 2000, because their earnings have been flatlining since 2022.
▌View Related Live Charts: US - Russell 2000 Index, US - Russell 2000 Stocks Above 200-Day Average
(4) Since Election Day, the following stock price indexes are down: the Dow Jones Industrials Average (-0.7%), the S&P 500 Equal-Weighted (-3.0), and the Russell 2000 (-3.2). Still up since then are the Magnifient-7 stocks (12.2) as well as the Nasdaq (3.9), Nasdaq 100 (3.1), and S&P 500 (0.8).
▌View Related Live Charts: US - Magnificent Seven Total Market Cap and Share of S&P 500, US - NASDAQ Composite, US - NASDAQ 100, US - S&P 500, CBOE - DJIA Volatility Index, US - Russell 2000 Index
(5) We anticipated this stock market correction at the end of last year. In the December 17 Morning Briefing, we wrote: “With bullishness abounding, contrarian indicators are flashing red, and we see the potential for a market correction early next year.” Our major concern was that the stock market was discounting too many FFR rate cuts, while the bond market was signaling that the Fed had already cut the rate by too much. Friday’s stock market rout suggests that stock investors have recalibrated their interest-rate outlook to higher-for-longer, a.k.a. normal-for-longer.
The animal spirits unleashed when President Donald Trump won a second term in office on November 5 have been subdued by more realistic outlooks for both Fed policy and the policy stew cooked up by Trump 2.0.
(6) Another important development: Stock market sentiment is turning less bullish, which is a positive from a contrarian perspective. The Investor Intelligence and AAII bull/bear ratios have dropped sharply over the past couple of weeks and undoubtedly did so again this past week.
▌View Related Live Charts: US - AAII Investor Sentiment Survey (Cumulative Total)
(7) More downside for stock prices is likely this week if December’s CPI, which will be released on Tuesday, is as hot as the Cleveland Fed’s Inflation Nowcasting tracking model shows—i.e., a 0.38% increase in the headline rate. The core rate indicated is less than that, however, at 0.27%. These m/m increases would put December’s y/y readings at 2.9% and 3.3%. ▌View Related Live Charts: US - Consumer Price Index (CPI)
However, the downside may be short-lived. We are still expecting that the Q4-2024 earnings reporting season, which starts this week, will show at least a 10% y/y increase in S&P 500 companies’ aggregate operating earnings per share. The analysts’ consensus is 8.2% currently. The big banks will start the reporting off at the end of this week. Their results should be strong. In addition, their managements might discuss how deregulation under Trump 2.0 might boost their earnings.
▌View Related Live Charts: US - S&P 500 EPS
US Economy: A Solid Labor Market
“The sky is falling! Get out of the way!” That was the reaction of the stock and bond markets on Friday to the stronger-than-expected employment report as investors rushed to sell both stocks and bonds. Is such good news for the economy really bad news for investors? Not in our opinion. Consider the following:
(1) December’s payroll employment increased 256,000, beating expectations after November’s increase of 212,000 was less than expected. Those surprises were mostly attributable to retail sales payrolls, which fell 29,200 in November and increased 43,400 last month. That was attributable to a late Thanksgiving holiday.
The three-month moving average of the monthly changes in total and private payrolls were 170,000 and 138,000 through December. Those are in line with the paces of 2018 and 2019 and consistent with our view that the labor has normalized following the tight conditions during the pandemic years.
▌View Related Live Charts: US - Nonfarm Payrolls vs. Unemployment Rate, US - Nonfarm Payrolls (Monthly Change, Cumulative Revisions of Past 2 Months)
(2) Aggregate weekly hours rose 0.2% m/m to another record high last month, while average hourly earnings (AHE) increased 0.3% m/m. As a result, our Earned Income Proxy for private-industry wages and salaries in personal income rose 0.5% to another record high. This augurs well for other measures of consumer income and consumer spending during December, which will be reported over the rest of this month.
▌View Related Live Charts: US - Average Weekly Working Hours
▌View Related Live Charts: US - Total Private Average Weekly Earnings, US - Average Hourly Earnings - Retail Trade, US - Average Hourly Earnings - Total Goods Producing
(3) AHE for all workers has been rising faster than consumer prices since early last year, suggesting that productivity growth has rebounded from the pandemic levels.
▌View Related Live Charts: US - Average Hourly Earnings - Total Private Service Providing
(4) December’s unemployment rate edged down to 4.1% from 4.2% the month before. Layoffs and initial unemployment claims remain low. There are plenty of job openings. The only issue we see in the labor market is that the average weekly duration of unemployment has risen from 20.6 weeks during July to 23.7 weeks last month. It may be taking longer to find a job because of skills mismatches.
Commodities: An Oily Policy Change
The price of a barrel of a barrel of Brent crude oil rose by $5.12 to $79.76 since the start of the new year through Friday’s close. Initially, the rally was driven by cold weather in the US and Europe. In addition, the Chinese government announced plans for more fiscal stimulus to revive China’s economy.
▌View Related Live Charts: MM Crude Oil Fundamental Index
Last week on Friday, the Biden administration imposed new sanctions on Russia. They target more than 180 vessels from Russia’s fleet of shadow tankers that Moscow has used to evade existing oil sanctions. They also blacklist two leading Russian oil producers, Gazprom Neft and Surgutneftegas, and their subsidiaries.
According to The New York Times report, Daleep Singh, the deputy national security adviser for international economics, said it was a “fair question” to ask why Mr. Biden waited until the end of the administration to impose such sanctions.
It might give the Trump administration more bargaining power over Russia in negotiating an end to that country’s war with Ukraine. It might also leave the new administration with an inflation problem that will further unsettle the bond and stock markets. Then again, Trump will probably counter by announcing lots of oil leases on federal land.
Big Tech earnings week is here! Stay ahead with MacroMicro’s Economic Calendar — track CPI, GDP, and key earnings like Apple & Google all in one place. Check it out »