Executive Summary
While Ed and Eric have been accentuating the positives in the stock market outlook and also acknowledging the negatives, investors and many commentators seem suddenly to be doing the opposite. Today, Ed outlines both the concerns that dragged the stock market off its midweek record high last week and our base-case Roaring 2020s scenario (55% subjective odds). Even if a 1990s-style meltup was followed by a meltdown (25% odds), we’d expect that meltdown to be short-lived. That’s because our productivity-driven Roaring 2020s economic scenario would still be buoying corporate earnings. … Also: what we’re monitoring to assess the concerns that have weakened the market in recent days, thus focusing our attention on our “bucket list” of what could go wrong (20% odds). Check out the accompanying chart collection.
Strategy I: Accentuating the Negatives.
I was on the road again last week, speaking at the MoneyShow conference in Las Vegas and meeting with a couple of our accounts in Texas. At a client appreciation dinner for one account in Houston, I learned a lot about the oil and gas business from the folks at my table. I told them that everything I know about their business I picked up by watching the TV series Landsman, starring Billy Bob Thornton.
In my presentations, I accentuated the positives for the US economy and stock market while acknowledging the negatives. The S&P 500 rose to a record high of 6144.15 last Wednesday. But then it fell 2.1% during the last two days of the week to close at 6013.13, nearly back down to its 50-day moving average.
 ▌View Related Live Charts: US - S&P 500 Share of Stocks Above 50-Day Moving Average by Sector
That minor decline from the record high seemed to unleash lots of negative chatter in the financial press about what could be going wrong for the economy and the stock market. It didn’t take long to hear stock market pundits accentuating the negatives.
On Friday, for example, billionaire Steve Cohen, founder of Point72 Asset Management, described a bearish outlook at the Future Investment Initiative Institute’s summit in Miami Beach. He pointed to sticky inflation, slowing growth, and the possibility of retaliatory tariffs as drags on the US economy. “I’m actually pretty negative for the first time in a while,” Cohen said. “It may only last a year or so, but it’s definitely a period where I think the best gains have been had and wouldn’t surprise me to see a significant correction.” Cohen also accentuated the possible negative effects of the Musk-led Department of Government Efficiency (DOGE).
Such concerns have been building for the past few weeks, particularly in response to the Trump administration’s policies, which are widely viewed as chaotic and uncertainty stirring, with unclear effects on the economy and stock market. Uncertainty is often a negative for business spending, consumer sentiment, the outlook for corporate earnings, and the stock market. Is it this time too?
Consider the following:
(1) Animal spirits vs policy uncertainty.
The unleashing of animal spirits by the election of President Donald Trump for a second term has already been offset by “policy uncertainty” under Trump 2.0. For instance, the survey of small business owners conducted by the National Federation of Independent Business (NFIB) shows a dramatic increase in the outlook for general business conditions. This series, which measures the percentage of better minus worse assessments soared from -5% during October 2024 to 47% during January

On the other hand, the NFIB’s uncertainty index was 100 during January, one of the highest readings of this series since it started during 1986.

(2) Walmart.
The selloffs in the S&P 500 and the Dow Jones Industrial Average on Thursday and Friday were led by an 8.9% drop in Walmart’s stock price. The company’s earnings rose to a record high during Q4-2024, but management provided cautious guidance for 2025. Given that the stock’s forward P/E had nearly doubled since September 2022, from 20 to last Wednesday’s peak of 38, it took only that whiff of a headwind to send it sliding.

Specifically, what Walmart’s CFO John David Rainey said was that consumers’ “wallets are stretched.” But he also said that their spending remains steady. He noted that Walmart’s shoppers in Mexico seemed to be pulling back, maybe on tariff talk. Walmart will also have to pay an additional 10% tariff on goods imported from China. If the company can’t find alternative cheaper vendors for these goods elsewhere, it will have to either accept a smaller profit margin or pass the prices increases on to consumers, who might respond by buying less.
(3) Consumer sentiment
Also weighing on the stock market on Friday was the release of January’s Consumer Sentiment Index (CSI) survey. It seems to be more sensitive to inflation than the Consumer Confidence Index survey, which is more sensitive to employment. In any case, the former showed a sharp decline in the overall CSI from 71.1 in January to 67.8 in February, the lowest since July 2024.
 ▌View Related Live Charts: US - Consumer Confidence
There was a significant 12% decline in buying conditions for durable goods, partly due to concerns about the impact of tariff policies.
It seems many people are worried about the potential return of high inflation soon. Year-ahead inflation expectations surged from a recent low of 2.6% during November to 4.3% in February, the highest since November 2023.
 ▌View Related Live Charts: US - UMich Inflation Expectations
Interestingly, Republicans expect zero inflation, while Independents and Democrats expect 3.7% and 5.1%! This survey clearly is biased by extreme partisanship. Inflation expectations for the next five to ten years is now up to 3.5%, the highest since April 1995. The increase over the past two months has been the largest since February 2009.
In the past, the CSI survey’s year-ahead inflation expectations series was driven mostly by the price of gasoline.

The latter has been relatively subdued recently. So the current jump in inflation expectations is probably attributable to tariff talk or maybe soaring egg prices or both.
(4) Retail sales
Retail sales fell 0.9% m/m during January.
 ▌View Related Live Charts: US - Retail Sales
That was a significant drop suggesting that consumers might be retrenching. We attribute the weakness to bad weather and to faulty seasonal adjustment. This is confirmed by the weekly Redbook retail sales series, which was up 5.8% y/y through the February 14 week.

We expect to see a strong rebound in retail sales during February and March.
(5) Consumer credit & delinquencies
Consumer credit jumped $40.8 trillion during December, one the biggest monthly gains in the history of the series.

We view that as an aberration rather than an indication that consumers’ budgets are stretched. The ratio of consumer credit to disposable personal income remains relatively low.

Alarmists are also ringing their alarm bells about delinquencies on consumer credit cards that are overdue by 90 days or more. They rose to 11.4% of credit card balances during Q4-2024.
 ▌View Related Live Charts: US - Percent of Balance 90+ Days Delinquent by Loan Type
Furthermore, 7.2% of credit cards transitioned to such delinquency status at the end of last year.
 Those are concerning developments, but they’re hardly alarming when compared to past experience.
(6) Purchasing managers’ survey
Another reason that the stock market sold off on Friday was the release of February’s S&P Global services PMI, which showed a steep decline from 52.9 in January to 49.7 this month.
 ▌View Related Live Charts: US - ISM Non-Manufacturing Index
We doubt that the services economy stopped growing in February. We expect that February’s ISM nonmanufacturing PMI will show a stronger reading when it is released in early March.
(7) Inflation & the Fed
Also unnerving investors last week was the jump in February’s prices-paid and prices-received indexes in the regional business surveys conducted by the Federal Reserve Banks of New York and Philadelphia.

Both were released last week. They suggest that tariff talk is already putting upward pressure on prices. If so, then the Fed’s rate-cutting will remain on pause for a while. We are already fielding questions from accounts wondering if the Fed’s next move might have to be a rate increase if inflation heats up. It's possible, but not likely.
We attribute the spike in these regional PMIs to tariff talk, including worrisome scenarios that we think won’t pan out. We are expecting lots of bilateral negotiations between the US and its major trading partners to lead to bringing down tariffs in a reciprocal fashion rather than to retaliatory tariff wars.
(8) Valuation & Buffett Among the most unsettling development since early last year has been seeing Warren Buffett raising cash at Berkshire Hathaway Inc. The amount of cash and equivalents held by the firm rose to a record $334 billion at the end of last year.
In his annual letter to investors, released on Saturday, the Oracle of Omaha didn’t explain why he had raised so much cash. Instead, he wrote, “Despite what some commentators currently view as an extraordinary cash position at Berkshire, the great majority of your money remains in equities. That preference won’t change. While our ownership in marketable equities moved downward last year from $354 billion to $272 billion, the value of our non-quoted controlled equities increased somewhat and remains far greater than the value of the marketable portfolio.”
Buffett also avoided any mention of Trump 2.0 or recent macroeconomic developments. He also didn’t comment on the stock market. We suspect that Buffett believes that the stock market is overvalued since he hasn’t found much to buy in it lately. So he decided to cash some of his gains and park the funds in Treasuries, which he did discuss at some length in his letter. He noted that Treasury bills provided a good return, which boosted Berkshire’s earnings. He proudly wrote that his company “paid far more in corporate income tax than the U.S. government had ever received from any company—even the American tech titans that commanded market values in the trillions.”
Walmart’s selloff last week suggests that heady valuation multiples are vulnerable to fall if investors have second thoughts about their heady assumptions for corporate earnings. The Buffett Ratio, a measure of valuation, is in record-high territory.
 ▌View Related Live Charts: US - Buffett Indicator
That’s probably all we need to explain why Buffett has been raising cash!
(9) Time to sell? So why aren’t we recommending selling stocks? We are expecting that the bull market will be driven by earnings growth rather than higher valuations this year and likely through the end of the decade. We are sticking with our technology-driven, productivity-led Roaring 2020s scenario. It remains our base case, with a subjective probability of 55%.
We assign another 25% to a 1990s-style meltup. But unlike the meltdown that followed the meltup back then, we expect that any post-meltup meltdown will be short-lived and a great buying opportunity, because our base-case Roaring 2020s economic scenario will keep corporate earnings aloft.
We assign the remaining 20% subjective probability to a bucket of everything that can go wrong. These possible scenarios include a 1970s-style twin peaks in inflation. Another possible bearish outcome would be a debt crisis. And now that Trump is moving to impose tariffs, a trade war becomes a possibility.
Strategy II: Accentuating the Positives
The list of woes above seems to have hit the stock market hard during Thursday and Friday of last week. The list is mostly about developments suggesting that consumers might be retrenching because they have too much debt, inflation may be starting to erode their purchasing power again, and they are uncertain whether Trump 2.0 will or will not benefit them personally. Consider the following:
(1) Jobless claims
Economists are now watching initial unemployment claims in the area around Washington, DC as the DOGE Boys are firing federal workers in roles that they deem unnecessary. We are watching DC area unemployment too; but we will also continue to focus on the national claims data, which remained subdued through the week of February 14.
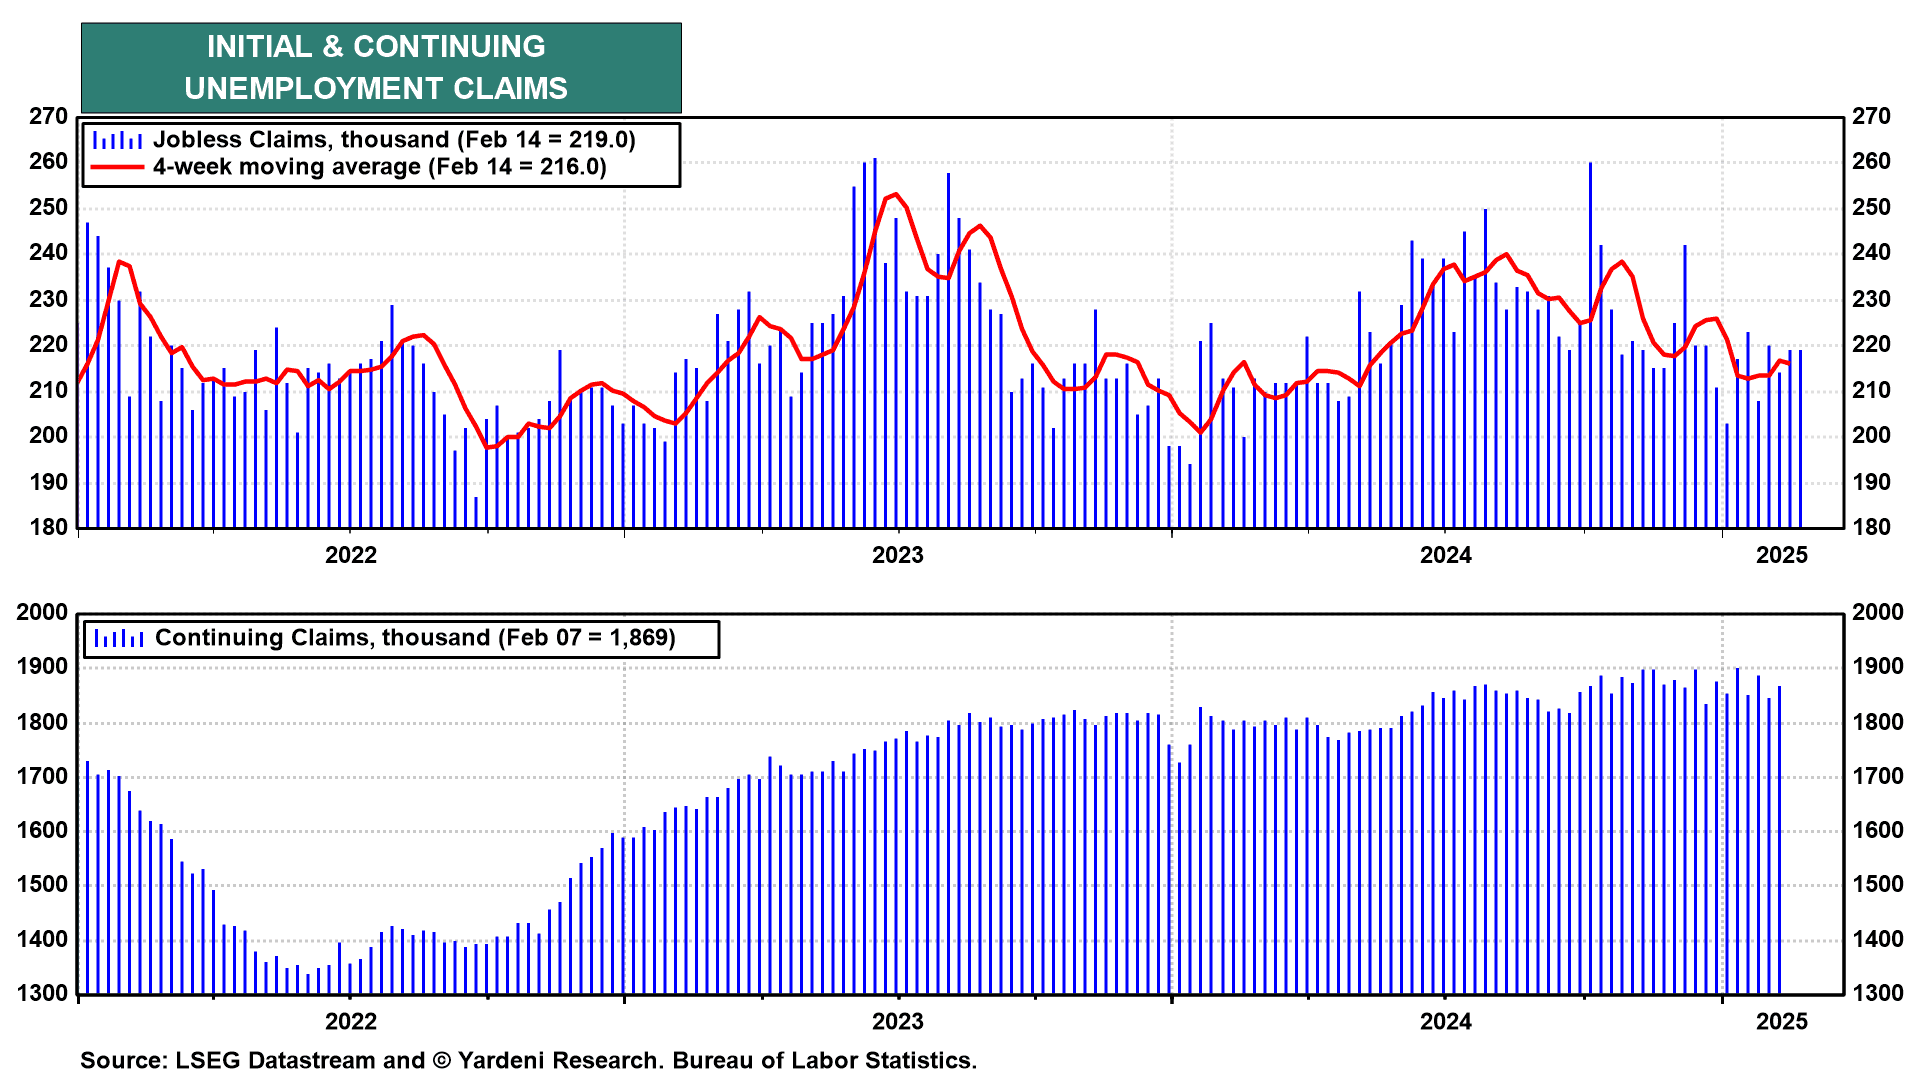 ▌View Related Live Charts: US - Initial & Continuing Jobless Claims
(2) Corporate earnings
We will also be monitoring the weekly data on the forward earnings of the S&P 500, S&P 400, and S&P 600 for signs that Trump 2.0 is weighing on the earnings estimates of industry analysts. All three dipped over the past couple of weeks.
 ▌View Related Live Charts: US - S&P 500 - Forward PE Ratio & EPS
However, the forward earnings of the S&P 500 remains in record-high territory, while that of the S&P 400 remains near its previous record high in early 2022.
(3) Capital spending Policy uncertainty might depress capital spending. Maybe. We aren’t convinced. Technology accounts for about half of capital spending. We expect that business spending on technology won’t be slowed by uncertainties about Trump 2.0. Companies need to proceed with such spending to boost their productivity and to remain competitive.
(4) Reciprocal tariffs As noted above, we expect that Trump’s threat to impose reciprocal tariffs is likely to lead to bilateral negotiations with America’s major trading partners which should lead to lower tariffs rather than a retaliatory trade war.
(5) Energy supremacy One of the central pillars of Trump 2.0 is to exploit America’s abundant energy resources. Last week, the Trump administration issued its first approval for exports from a new liquified natural gas (LNG) plant, which Commonwealth LNG has proposed to build in Cameron Parish, Louisiana. The Houston-based company plans to build a natural gas export terminal on 150 acres where the mouth of Calcasieu Ship Channel meets the Gulf of America. The plant would export up to 9.5 million metric tons of LNG per year—the equivalent of just over 3,700 Superdomes filled with natural gas.
The facility that Commonwealth LNG plans to build will be one of 16 export terminals proposed on the Gulf Coast. It’s less than a third of the size of another LNG terminal proposed to be built just across the Calcasieu Ship Channel called “CP2,” which would be the world’s largest LNG plant if constructed. (See also U.S. LNG Export Terminals–Existing, Approved not Yet Built, and Proposed.)
Executive Summary
While Ed and Eric have been accentuating the positives in the stock market outlook and also acknowledging the negatives, investors and many commentators seem suddenly to be doing the opposite. Today, Ed outlines both the concerns that dragged the stock market off its midweek record high last week and our base-case Roaring 2020s scenario (55% subjective odds). Even if a 1990s-style meltup was followed by a meltdown (25% odds), we’d expect that meltdown to be short-lived. That’s because our productivity-driven Roaring 2020s economic scenario would still be buoying corporate earnings. … Also: what we’re monitoring to assess the concerns that have weakened the market in recent days, thus focusing our attention on our “bucket list” of what could go wrong (20% odds). Check out the accompanying chart collection.
Strategy I: Accentuating the Negatives.
I was on the road again last week, speaking at the MoneyShow conference in Las Vegas and meeting with a couple of our accounts in Texas. At a client appreciation dinner for one account in Houston, I learned a lot about the oil and gas business from the folks at my table. I told them that everything I know about their business I picked up by watching the TV series Landsman, starring Billy Bob Thornton.
In my presentations, I accentuated the positives for the US economy and stock market while acknowledging the negatives. The S&P 500 rose to a record high of 6144.15 last Wednesday. But then it fell 2.1% during the last two days of the week to close at 6013.13, nearly back down to its 50-day moving average.
▌View Related Live Charts: US - S&P 500 Share of Stocks Above 50-Day Moving Average by Sector
That minor decline from the record high seemed to unleash lots of negative chatter in the financial press about what could be going wrong for the economy and the stock market. It didn’t take long to hear stock market pundits accentuating the negatives.
On Friday, for example, billionaire Steve Cohen, founder of Point72 Asset Management, described a bearish outlook at the Future Investment Initiative Institute’s summit in Miami Beach. He pointed to sticky inflation, slowing growth, and the possibility of retaliatory tariffs as drags on the US economy. “I’m actually pretty negative for the first time in a while,” Cohen said. “It may only last a year or so, but it’s definitely a period where I think the best gains have been had and wouldn’t surprise me to see a significant correction.” Cohen also accentuated the possible negative effects of the Musk-led Department of Government Efficiency (DOGE).
Such concerns have been building for the past few weeks, particularly in response to the Trump administration’s policies, which are widely viewed as chaotic and uncertainty stirring, with unclear effects on the economy and stock market. Uncertainty is often a negative for business spending, consumer sentiment, the outlook for corporate earnings, and the stock market. Is it this time too?
Consider the following:
(1) Animal spirits vs policy uncertainty.
The unleashing of animal spirits by the election of President Donald Trump for a second term has already been offset by “policy uncertainty” under Trump 2.0. For instance, the survey of small business owners conducted by the National Federation of Independent Business (NFIB) shows a dramatic increase in the outlook for general business conditions. This series, which measures the percentage of better minus worse assessments soared from -5% during October 2024 to 47% during January
On the other hand, the NFIB’s uncertainty index was 100 during January, one of the highest readings of this series since it started during 1986.
(2) Walmart.
The selloffs in the S&P 500 and the Dow Jones Industrial Average on Thursday and Friday were led by an 8.9% drop in Walmart’s stock price. The company’s earnings rose to a record high during Q4-2024, but management provided cautious guidance for 2025. Given that the stock’s forward P/E had nearly doubled since September 2022, from 20 to last Wednesday’s peak of 38, it took only that whiff of a headwind to send it sliding.
Specifically, what Walmart’s CFO John David Rainey said was that consumers’ “wallets are stretched.” But he also said that their spending remains steady. He noted that Walmart’s shoppers in Mexico seemed to be pulling back, maybe on tariff talk. Walmart will also have to pay an additional 10% tariff on goods imported from China. If the company can’t find alternative cheaper vendors for these goods elsewhere, it will have to either accept a smaller profit margin or pass the prices increases on to consumers, who might respond by buying less.
(3) Consumer sentiment
Also weighing on the stock market on Friday was the release of January’s Consumer Sentiment Index (CSI) survey. It seems to be more sensitive to inflation than the Consumer Confidence Index survey, which is more sensitive to employment. In any case, the former showed a sharp decline in the overall CSI from 71.1 in January to 67.8 in February, the lowest since July 2024.
▌View Related Live Charts: US - Consumer Confidence
There was a significant 12% decline in buying conditions for durable goods, partly due to concerns about the impact of tariff policies.
It seems many people are worried about the potential return of high inflation soon. Year-ahead inflation expectations surged from a recent low of 2.6% during November to 4.3% in February, the highest since November 2023.
▌View Related Live Charts: US - UMich Inflation Expectations
Interestingly, Republicans expect zero inflation, while Independents and Democrats expect 3.7% and 5.1%! This survey clearly is biased by extreme partisanship. Inflation expectations for the next five to ten years is now up to 3.5%, the highest since April 1995. The increase over the past two months has been the largest since February 2009.
In the past, the CSI survey’s year-ahead inflation expectations series was driven mostly by the price of gasoline.
The latter has been relatively subdued recently. So the current jump in inflation expectations is probably attributable to tariff talk or maybe soaring egg prices or both.
(4) Retail sales
Retail sales fell 0.9% m/m during January.
▌View Related Live Charts: US - Retail Sales
That was a significant drop suggesting that consumers might be retrenching. We attribute the weakness to bad weather and to faulty seasonal adjustment. This is confirmed by the weekly Redbook retail sales series, which was up 5.8% y/y through the February 14 week.
We expect to see a strong rebound in retail sales during February and March.
(5) Consumer credit & delinquencies
Consumer credit jumped $40.8 trillion during December, one the biggest monthly gains in the history of the series.
We view that as an aberration rather than an indication that consumers’ budgets are stretched. The ratio of consumer credit to disposable personal income remains relatively low.
Alarmists are also ringing their alarm bells about delinquencies on consumer credit cards that are overdue by 90 days or more. They rose to 11.4% of credit card balances during Q4-2024.
▌View Related Live Charts: US - Percent of Balance 90+ Days Delinquent by Loan Type
Furthermore, 7.2% of credit cards transitioned to such delinquency status at the end of last year.
Those are concerning developments, but they’re hardly alarming when compared to past experience.
(6) Purchasing managers’ survey
Another reason that the stock market sold off on Friday was the release of February’s S&P Global services PMI, which showed a steep decline from 52.9 in January to 49.7 this month.
▌View Related Live Charts: US - ISM Non-Manufacturing Index
We doubt that the services economy stopped growing in February. We expect that February’s ISM nonmanufacturing PMI will show a stronger reading when it is released in early March.
(7) Inflation & the Fed
Also unnerving investors last week was the jump in February’s prices-paid and prices-received indexes in the regional business surveys conducted by the Federal Reserve Banks of New York and Philadelphia.
Both were released last week. They suggest that tariff talk is already putting upward pressure on prices. If so, then the Fed’s rate-cutting will remain on pause for a while. We are already fielding questions from accounts wondering if the Fed’s next move might have to be a rate increase if inflation heats up. It's possible, but not likely.
We attribute the spike in these regional PMIs to tariff talk, including worrisome scenarios that we think won’t pan out. We are expecting lots of bilateral negotiations between the US and its major trading partners to lead to bringing down tariffs in a reciprocal fashion rather than to retaliatory tariff wars.
(8) Valuation & Buffett Among the most unsettling development since early last year has been seeing Warren Buffett raising cash at Berkshire Hathaway Inc. The amount of cash and equivalents held by the firm rose to a record $334 billion at the end of last year.
In his annual letter to investors, released on Saturday, the Oracle of Omaha didn’t explain why he had raised so much cash. Instead, he wrote, “Despite what some commentators currently view as an extraordinary cash position at Berkshire, the great majority of your money remains in equities. That preference won’t change. While our ownership in marketable equities moved downward last year from $354 billion to $272 billion, the value of our non-quoted controlled equities increased somewhat and remains far greater than the value of the marketable portfolio.”
Buffett also avoided any mention of Trump 2.0 or recent macroeconomic developments. He also didn’t comment on the stock market. We suspect that Buffett believes that the stock market is overvalued since he hasn’t found much to buy in it lately. So he decided to cash some of his gains and park the funds in Treasuries, which he did discuss at some length in his letter. He noted that Treasury bills provided a good return, which boosted Berkshire’s earnings. He proudly wrote that his company “paid far more in corporate income tax than the U.S. government had ever received from any company—even the American tech titans that commanded market values in the trillions.”
Walmart’s selloff last week suggests that heady valuation multiples are vulnerable to fall if investors have second thoughts about their heady assumptions for corporate earnings. The Buffett Ratio, a measure of valuation, is in record-high territory.
▌View Related Live Charts: US - Buffett Indicator
That’s probably all we need to explain why Buffett has been raising cash!
(9) Time to sell? So why aren’t we recommending selling stocks? We are expecting that the bull market will be driven by earnings growth rather than higher valuations this year and likely through the end of the decade. We are sticking with our technology-driven, productivity-led Roaring 2020s scenario. It remains our base case, with a subjective probability of 55%.
We assign another 25% to a 1990s-style meltup. But unlike the meltdown that followed the meltup back then, we expect that any post-meltup meltdown will be short-lived and a great buying opportunity, because our base-case Roaring 2020s economic scenario will keep corporate earnings aloft.
We assign the remaining 20% subjective probability to a bucket of everything that can go wrong. These possible scenarios include a 1970s-style twin peaks in inflation. Another possible bearish outcome would be a debt crisis. And now that Trump is moving to impose tariffs, a trade war becomes a possibility.
Strategy II: Accentuating the Positives
The list of woes above seems to have hit the stock market hard during Thursday and Friday of last week. The list is mostly about developments suggesting that consumers might be retrenching because they have too much debt, inflation may be starting to erode their purchasing power again, and they are uncertain whether Trump 2.0 will or will not benefit them personally. Consider the following:
(1) Jobless claims
Economists are now watching initial unemployment claims in the area around Washington, DC as the DOGE Boys are firing federal workers in roles that they deem unnecessary. We are watching DC area unemployment too; but we will also continue to focus on the national claims data, which remained subdued through the week of February 14.
▌View Related Live Charts: US - Initial & Continuing Jobless Claims
(2) Corporate earnings
We will also be monitoring the weekly data on the forward earnings of the S&P 500, S&P 400, and S&P 600 for signs that Trump 2.0 is weighing on the earnings estimates of industry analysts. All three dipped over the past couple of weeks.
▌View Related Live Charts: US - S&P 500 - Forward PE Ratio & EPS
However, the forward earnings of the S&P 500 remains in record-high territory, while that of the S&P 400 remains near its previous record high in early 2022.
(3) Capital spending Policy uncertainty might depress capital spending. Maybe. We aren’t convinced. Technology accounts for about half of capital spending. We expect that business spending on technology won’t be slowed by uncertainties about Trump 2.0. Companies need to proceed with such spending to boost their productivity and to remain competitive.
(4) Reciprocal tariffs As noted above, we expect that Trump’s threat to impose reciprocal tariffs is likely to lead to bilateral negotiations with America’s major trading partners which should lead to lower tariffs rather than a retaliatory trade war.
(5) Energy supremacy One of the central pillars of Trump 2.0 is to exploit America’s abundant energy resources. Last week, the Trump administration issued its first approval for exports from a new liquified natural gas (LNG) plant, which Commonwealth LNG has proposed to build in Cameron Parish, Louisiana. The Houston-based company plans to build a natural gas export terminal on 150 acres where the mouth of Calcasieu Ship Channel meets the Gulf of America. The plant would export up to 9.5 million metric tons of LNG per year—the equivalent of just over 3,700 Superdomes filled with natural gas.
The facility that Commonwealth LNG plans to build will be one of 16 export terminals proposed on the Gulf Coast. It’s less than a third of the size of another LNG terminal proposed to be built just across the Calcasieu Ship Channel called “CP2,” which would be the world’s largest LNG plant if constructed. (See also U.S. LNG Export Terminals–Existing, Approved not Yet Built, and Proposed.)
Big Tech earnings week is here! Stay ahead with MacroMicro’s Economic Calendar — track CPI, GDP, and key earnings like Apple & Google all in one place. Check it out »