For over seven years, MacroMicro has been steadily enriching our website with investment information and developing new user-friendly tools. Today, we are excited to introduce the fully revamped and significantly upgraded "Toolbox: Line Chart."
In this all-new toolbox, you can not only utilize our extensive collection of economic data to create your own charts and conduct investment research, but also take advantage of the recently launched Arithmetic calculator, along with novel calculation methods and Y-axis settings for selected charts. These features allow you to effortlessly accomplish highly complex and fully customized data calculations and charting using the simplest approach.
1. New Charts: Utilize Thousands of Data at Your Fingertips!
First, open the "Line Chart" in the Toolbox, and you'll enter the new interface.
On the right-hand side, you can search through the data items using our extensive database of economic data, adding any chart you wish to view or create. You can also enhance data search precision by selecting the region and category at the top. Once you click the green "Add" button, the data you've chosen will appear on the left side.


2. Arithmetic : Easily Accomplish Complex Calculations with Multiple Variables!
Introduction to Arithmetic Calculator
If you wish to apply arithmetic operations such as addition, subtraction, multiplication, and division to multiple sets of data, you can utilize the Arithmetic function.
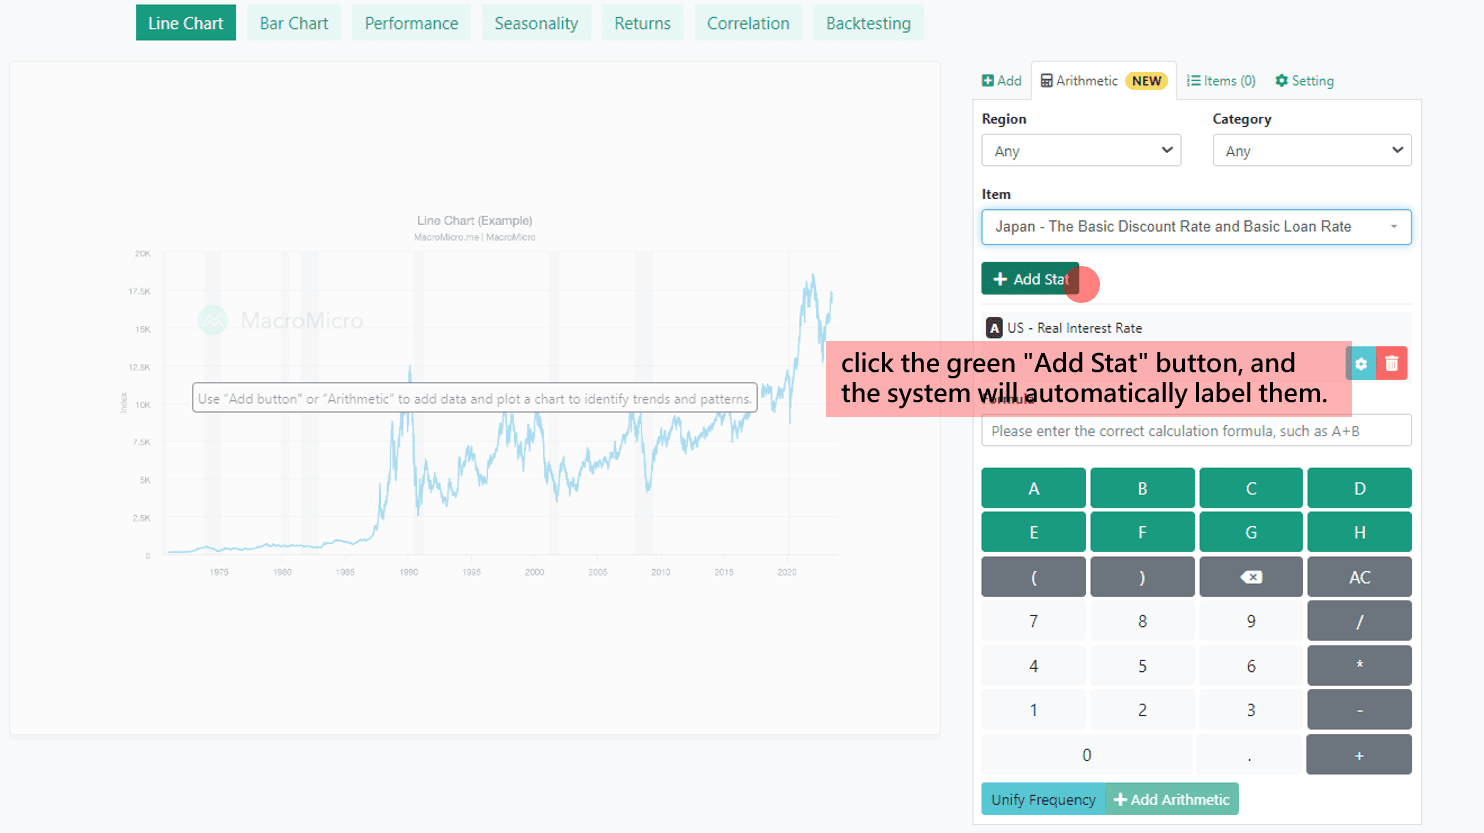
For example, when you add data to the data items, simply click the green "Add Stat" button, and the system will automatically label them as codes A, B, C, ..., G, H in sequence. Afterwards, in the "Formula" section below, you can freely combine these codes using arithmetic operators. For instance, A + B + C or even more complex expressions such as (A + B) * C / D, and so forth. This feature empowers you to perform flexible calculations and analyses with ease.
Frequency, Calculation, and Integration of Arithmetic
After inputting the calculation formula, if your data encompasses different frequencies, such as daily, weekly, or monthly data, remember to click the blue "Unify Frequency" button below. This action will automatically unify all data frequencies to the lowest frequency, ensuring smooth execution of the operations. Lastly, click "Add Arithmetic" to obtain the chart on the left. Alternatively, if you wish to adjust frequencies manually, you can click the blue tool button on the right side of the data, set the frequency, and select an appropriate integration method.
Moreover, if you desire further customization for the elements within the Arithmetic calculator, you can click the same blue tool buttom to make tailored adjustments based on data frequency, integration method, and calculation rules.


3. Items Features: Flexible Customization, Design Your Data Charts!
Chart Types, Colors, Line Thickness
In the "Items", you have the freedom to customize chart attributes to your liking and requirements, including chart types (line or column charts), colors, and line thickness, among others.

Advanced calculation Features
In the "items" section, frequency, aggregation, unit, and operation are showed below, you can employ these when you require complex calculations.
For the "operation" feature, you can use it to calculate various metrics such as YoY, Level Change, Drawdown / Rebound, and lead/lag relationships. Here, we present a comprehensive example
One of the most classic examples from MacroMicro is observing the lead/lag relationship between "U.S. Heavy Truck Sales" and the "S&P 500" index. Over the past 40 years, the reversal of this index has consistently preceded the S&P 500 by more than a year, making it a unique leading indicator.
If you wish to visualize the lead/lag relationship between these two, you can add these datasets, click "operation," then select "Lead/Lag" and enter an "n" value to shift the data points either forward (positive) or backward (negative) by a specific time period. In this example, since heavy truck sales lead the S&P 500 by one year, you would input a positive value of 12 for n, since the current data frequency is "monthly," effectively shifting the heavy truck data points one year ahead.

Y-Axis Customization Settings
If you have multiple datasets and wish to display them in two columns for easy comparison, we offer the "Y-Axis Panel" feature, which allows you to divide your data into different levels for convenient side-by-side viewing. You can set up to 4 panel levels.
Furthermore, we provide Y-axis customization settings, including Label, Max and Min values, Baseline, alignment (left or right), and more. These flexible adjustments ensure the final presentation of your chart meets your preferences. Additionally, you can even apply logarithmic transformations or rotate the Y-axis data.
For example, the "Y-axis Rotate" is commonly used when calculating exchange rate data. The "Log Y-axis" allows you to convert linear scales into logarithmic scales, facilitating the observation of data with exponential growth, such as stock prices.

4. Chart Settings – The Final Touch Before Sharing Your Insights!
In the last step, you'll reach the "Setting", where you can freely add your title, description, and jot down your analysis and observations. You can also set the data date range, chart type, decimal precision, X-axis baseline, and more.

Most importantly, after saving your chart, you can publish it to the exclusive MM community, "user insights," where users engage in discussions, and where charts can be liked and commented on. If your chart perspective gains attention, likes, and follows, you might even have a chance to be selected as "Staff Picks", make it to the TOP ANALYSTS list, or be recognized in the TOP charts, earning M-coin rewards!

Feel free to head to the Toolbox, share your charts and insights, and become your own researcher!
Author:MacroMicro(Jasmine)
Editor:MacroMicro(Dylan)
【 MM Podcast 】 Free Gift for Graduates & Students!

