Executive Summary:
It’s getting harder to make out the shape of the economy through the fog of Trump 2.0’s firings and tariffs. Indeed, one regional Fed bank sees real GDP contracting this quarter, another sees it expanding, and bad weather has distorted signals from several economic indicators. No wonder the stock market’s default position is risk-off and stocks have been correcting. We’ve lost some confidence that the economy will avoid a recession, raising the odds of one to 35%, up from 20%, last week. And we’re wondering whether Trump Tariff Turmoil 2.0 might trigger a rare kind of flash crash unaccompanied by a recession. … Check out the accompanying chart collection.
Strategy I: The Economy’s High NTSR.
The economy’s noise-to-signal ratio (NTSR) has been rising rapidly in recent weeks. As a result, it has gotten harder to get a read on the economy lately. Washington’s rapidly increasing NTSR is also troubling. Indeed, last Wednesday, our Morning Briefing was titled “Trump Turmoil Raises Odds Of A Recession.” We raised our subjective odds of a recession this year from 20% to 35%.
We are considering raising the odds again given that Trump officials recently acknowledged that they expect that their policies will cause some short-term pain. The near-term outlook for the economy and stock market has soured rapidly over the past few weeks.
The DOGE Boys have been firing government workers faster than we expected. That might slow now that various Cabinet secretaries reportingly are pushing back against Elon Musk’s terminators. The Trump administration’s tariff policies are instigating a retaliatory trade war rather than the negotiations to reduce tariffs that we had expected. More “reciprocal” tariffs will be imposed on April 2 by the Trump administration, which also aims to raise revenues with tariffs, implying that some of the tariffs will be permanent.
Stock investors are confused and seem to have concluded that the economy may be falling quickly into a recession. We’ve been betting on the economy’s resilience, but we can understand why risk-off is the stock market’s current default option.
The Nasdaq is in correction territory, and the S&P 500 seems to be headed in the same direction.

The Nasdaq fell below its 200-day moving average at the end of last week and has found support at the bottom end of its short-term upward trending channel. There is another uptrend line that started in 2010, which would provide support for the Nasdaq but in bear market territory.
 ▌View Related Live Charts: US - NASDAQ Composite
The Nasdaq index is currently 9.8% below its record high of 20173.89 on December 16.
The S&P 500 is down 6.1% from its record high on February 19.
 ▌View Related Live Charts: US - CNN Fear and Greed Index
It is slightly below its 200-day moving average. It has been a very rapid decline. It reminds us of the plunge in the S&P 500 during the Kennedy Slide of 1962 (also known as the “Flash Crash of 1962”). The stock market did not experience a stable recovery until after the end of the Cuban Missile Crisis in October 1962.
 ▌View Related Live Charts: MM US Stock Fundamental Index
The crash was partly attributable to a big price increase by US Steel that was loudly and successfully opposed by the Kennedy administration. This time, the selloff is largely attributable to Trump Tariff Turmoil 2.0.
Corrections are caused by fears that the economy is falling into a recession. During these events, stock prices fall 10%-20%. But they recover relatively quickly once those fears abate. During the bull market from 2009 through 2020, we counted 66 “panic attacks,” which included a few corrections. Bear markets occur when the correction turns into a decline of more than 20%, usually because a recession happens. There have been only three bear markets that occurred without an accompanying recession: the one in 1962, the one late in 1987, and the one in 2022.
There is certainly a recession scare currently. Our bet on the resilience of the economy is keeping us in the correction camp. However, Trump Tariff Turmoil 2.0 has the potential to cause a fourth bear market without a recession.
Yes, but what about the latest batch of economic indicators that are heightening recession fears? Consider the following:
(1) Atlanta Fed versus New York Fed Nowcasts. The Atlanta Fed’s GDPNow tracking model is currently showing Q1’s real GDP decreasing by 2.4% (q/q saar). However, the New York Fed’s Nowcast tracking model shows it increasing 2.7%! Go figure.
We usually favor the Atlanta Fed model over the New York Fed one. However, this time, we are betting on the New York Fed’s forecast. We don’t know why the two models differ so much.
What we do know is that the Atlanta Fed estimate dropped from +2.3% to -1.5% following the release on February 28 of a big jump in January’s imports, led by an odd jump in gold imports. In addition, on that same day, January’s real personal consumption expenditures showed a big decline of -0.5% m/m. The GDPNow estimate was lowered again to -2.8% on March 3 after the release of the ISM manufacturing index for February. It is currently -2.4%.
(2) Surging (gold) imports. In a March 7 post on LinkedIn, Pat Higgins, the creator of GDPNow, explained that much of the widening of the trade deficit in January was due to an increase in nonmonetary gold imports from $13.2 billion in December to $32.6 billion in January. This accounted for nearly 60% of the widening of the goods trade deficit. Higgins concluded: “Removing gold from imports and exports leads to an increase in both GDPNow’s topline growth forecast and the contribution of net exports to that forecast, of about 2 percentage points.” That’s obviously a significant swing.
(3) Weak (and strong) retail sales.
Furthermore, the drop in real consumer spending during January undoubtedly was caused by inclement weather that month, which was the coldest since 1988. Industrial output of utilities soared to a record high in January.
 ▌View Related Live Charts: US - Industrial Production & Capacity Utilization
Auto sales fell sharply in January and rebounded slightly in February.
 ▌View Related Live Charts: US - Retail Sales vs. Car Sales
Retail sales excluding food services dropped 1.2% m/m during January. Again, we blame the weather. Nevertheless, it still rose 4.0% y/y.
 ▌View Related Live Charts: US - Retail Sales
The Redbook retail sales index rose to 6.1% y/y during the February 28 week. Then again, the Consumer Confidence Index survey showed a sharp decline in vacation plans during February.
 ▌View Related Live Charts: US - Consumer Confidence
Furthermore, Target said on Tuesday that it expects little to no sales growth this year, with CEO Brian Cornell telling CNBC that higher prices are on the way. Walmart and electronics retailer Best Buy also recently warned about expectations for 2025.
(4) Mixed signals from the PMIs.
February’s purchasing managers added to the dissonance provided by the latest batch of economic indicators. The M-PMI dipped to 50.3 in February from 50.9 in January.
 ▌View Related Live Charts: US - ISM Manufacturing PMI
However, those were the first back-to-back readings above 50.0 since September and October 2022. Then again, February’s M-PMI subindexes for new orders (48.6) and employment (47.6) fell below 50.0. The regional business surveys conducted by five of the 12 Fed district banks showed better growth during February.
February’s NM-PMI remained solidly above 50.0 at 53.5.

All its major subindexes did the same. Just as we expected, the S&P Global flash NM-PMI provided a misleadingly weak estimate of the ISM version of this index.

Strategy II: Labor Market’s High NTSR.
Friday’s employment report for February also provided plenty of mixed signals. The payroll employment series (which measures the number of full-time and part-time jobs) rose 151,000, while the household employment series (which measures the number of workers with one or more jobs) fell 588,000. The latter is very volatile. It was up 2.2 million during January following an annual benchmark revision. The former was weaker than we expected, as we had anticipated a rebound from January’s cold blast. Well, it turns out that the weather was also bad in February. Consider the following:
(1) Bad weather again?
The household employment survey shows that 404,000 nonagricultural workers were not at work during February, the most since February 2014. The survey also found that 1.31 million nonagricultural workers who work full time had to work part time last month because of the weather. That’s the most since February 2021.
 ▌View Related Live Charts: US - Household Survey Employment - Workers Not at Work because of Weather
We had expected average weekly hours to rebound in February. Instead, it remained flat at January’s level. If bad weather depressed both months’ readings, then there should be a solid rebound in average weekly hours during March.
(2) Payroll employment.
While February’s payroll employment gain was weaker than we’d expected, the three-month average gain was 200,000.
 ▌View Related Live Charts: US - Nonfarm Payrolls vs. Unemployment Rate
That’s a robust reading. Excluding government, the three-month average was 169,000. That’s also a solid reading.
The questions ahead are how much will federal government employment fall in coming months as a result of the activities of the DOGE Boys, and will private payroll gains more than offset the losses of federal jobs? We think so, though this is certainly one of the great uncertainties resulting from Trump Turmoil 2.0. The losses started in February with federal government employment down 10,000.

This number could potentially double, triple, or even quadruple in coming months.
(3) Earned income proxy.
During February, private-sector payrolls rose 0.1%, the average workweek for private-sector workers was unchanged, and average hourly earnings in the private sector rose 0.3%. So our Earned Income Proxy edged up 0.4% m/m.
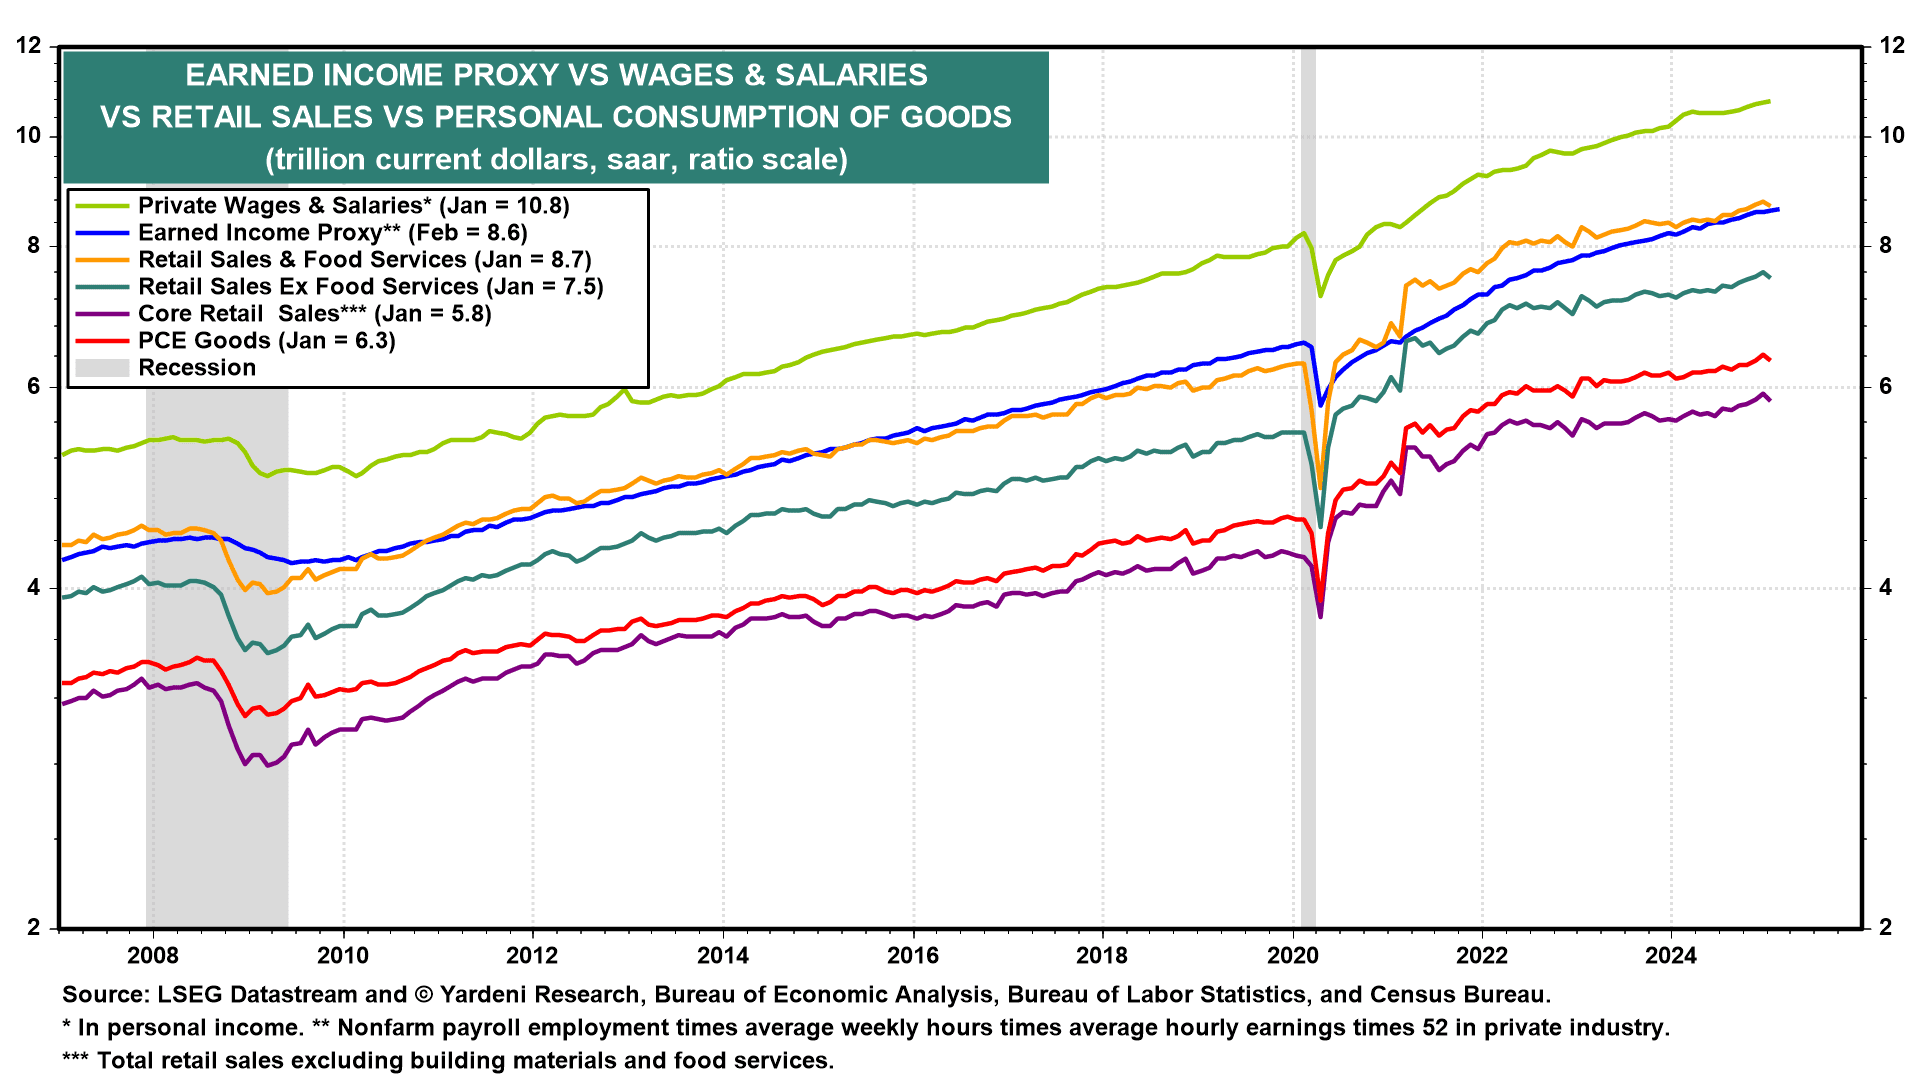
We expect bigger rebounds in February’s retail sales and total consumer spending from January’s deep freeze, unless bad weather kept shoppers at home during February too.
(4) Unemployment and layoffs.
The bad news is that February’s Challenger Report showed that government-announced layoffs totaled 62,240.

The private sector isn’t likely to significantly offset such job cuts if they all hit in March and April, especially since the Trump administration is planning even more layoffs.
In the private sector, announced layoffs in retailing during February totaled 38,960, the second highest tally on record. Retail payrolls fell 6,300 during the month. Information employment rose 5,000 last month. Announced layoffs in technology totaled 14,550. This means that we should expect sizeable increases in weekly initial and continuing unemployment claims in coming weeks.
While the official headline unemployment rate remained low at 4.1% during February, the U-6 rate rose to 8.0%, the highest since 2021.
 ▌View Related Live Charts: US - Unemployment Rate
The latter was boosted by more workers employed part-time for economic reasons.

Both jobless rates are bound to increase during the next few months.
Executive Summary:
It’s getting harder to make out the shape of the economy through the fog of Trump 2.0’s firings and tariffs. Indeed, one regional Fed bank sees real GDP contracting this quarter, another sees it expanding, and bad weather has distorted signals from several economic indicators. No wonder the stock market’s default position is risk-off and stocks have been correcting. We’ve lost some confidence that the economy will avoid a recession, raising the odds of one to 35%, up from 20%, last week. And we’re wondering whether Trump Tariff Turmoil 2.0 might trigger a rare kind of flash crash unaccompanied by a recession. … Check out the accompanying chart collection.
Strategy I: The Economy’s High NTSR.
The economy’s noise-to-signal ratio (NTSR) has been rising rapidly in recent weeks. As a result, it has gotten harder to get a read on the economy lately. Washington’s rapidly increasing NTSR is also troubling. Indeed, last Wednesday, our Morning Briefing was titled “Trump Turmoil Raises Odds Of A Recession.” We raised our subjective odds of a recession this year from 20% to 35%.
We are considering raising the odds again given that Trump officials recently acknowledged that they expect that their policies will cause some short-term pain. The near-term outlook for the economy and stock market has soured rapidly over the past few weeks.
The DOGE Boys have been firing government workers faster than we expected. That might slow now that various Cabinet secretaries reportingly are pushing back against Elon Musk’s terminators. The Trump administration’s tariff policies are instigating a retaliatory trade war rather than the negotiations to reduce tariffs that we had expected. More “reciprocal” tariffs will be imposed on April 2 by the Trump administration, which also aims to raise revenues with tariffs, implying that some of the tariffs will be permanent.
Stock investors are confused and seem to have concluded that the economy may be falling quickly into a recession. We’ve been betting on the economy’s resilience, but we can understand why risk-off is the stock market’s current default option.
The Nasdaq is in correction territory, and the S&P 500 seems to be headed in the same direction.
The Nasdaq fell below its 200-day moving average at the end of last week and has found support at the bottom end of its short-term upward trending channel. There is another uptrend line that started in 2010, which would provide support for the Nasdaq but in bear market territory.
▌View Related Live Charts: US - NASDAQ Composite
The Nasdaq index is currently 9.8% below its record high of 20173.89 on December 16.
The S&P 500 is down 6.1% from its record high on February 19.
▌View Related Live Charts: US - CNN Fear and Greed Index
It is slightly below its 200-day moving average. It has been a very rapid decline. It reminds us of the plunge in the S&P 500 during the Kennedy Slide of 1962 (also known as the “Flash Crash of 1962”). The stock market did not experience a stable recovery until after the end of the Cuban Missile Crisis in October 1962.
▌View Related Live Charts: MM US Stock Fundamental Index
The crash was partly attributable to a big price increase by US Steel that was loudly and successfully opposed by the Kennedy administration. This time, the selloff is largely attributable to Trump Tariff Turmoil 2.0.
Corrections are caused by fears that the economy is falling into a recession. During these events, stock prices fall 10%-20%. But they recover relatively quickly once those fears abate. During the bull market from 2009 through 2020, we counted 66 “panic attacks,” which included a few corrections. Bear markets occur when the correction turns into a decline of more than 20%, usually because a recession happens. There have been only three bear markets that occurred without an accompanying recession: the one in 1962, the one late in 1987, and the one in 2022.
There is certainly a recession scare currently. Our bet on the resilience of the economy is keeping us in the correction camp. However, Trump Tariff Turmoil 2.0 has the potential to cause a fourth bear market without a recession.
Yes, but what about the latest batch of economic indicators that are heightening recession fears? Consider the following:
(1) Atlanta Fed versus New York Fed Nowcasts. The Atlanta Fed’s GDPNow tracking model is currently showing Q1’s real GDP decreasing by 2.4% (q/q saar). However, the New York Fed’s Nowcast tracking model shows it increasing 2.7%! Go figure.
We usually favor the Atlanta Fed model over the New York Fed one. However, this time, we are betting on the New York Fed’s forecast. We don’t know why the two models differ so much.
What we do know is that the Atlanta Fed estimate dropped from +2.3% to -1.5% following the release on February 28 of a big jump in January’s imports, led by an odd jump in gold imports. In addition, on that same day, January’s real personal consumption expenditures showed a big decline of -0.5% m/m. The GDPNow estimate was lowered again to -2.8% on March 3 after the release of the ISM manufacturing index for February. It is currently -2.4%.
(2) Surging (gold) imports. In a March 7 post on LinkedIn, Pat Higgins, the creator of GDPNow, explained that much of the widening of the trade deficit in January was due to an increase in nonmonetary gold imports from $13.2 billion in December to $32.6 billion in January. This accounted for nearly 60% of the widening of the goods trade deficit. Higgins concluded: “Removing gold from imports and exports leads to an increase in both GDPNow’s topline growth forecast and the contribution of net exports to that forecast, of about 2 percentage points.” That’s obviously a significant swing.
(3) Weak (and strong) retail sales.
Furthermore, the drop in real consumer spending during January undoubtedly was caused by inclement weather that month, which was the coldest since 1988. Industrial output of utilities soared to a record high in January.
▌View Related Live Charts: US - Industrial Production & Capacity Utilization
Auto sales fell sharply in January and rebounded slightly in February.
▌View Related Live Charts: US - Retail Sales vs. Car Sales
Retail sales excluding food services dropped 1.2% m/m during January. Again, we blame the weather. Nevertheless, it still rose 4.0% y/y.
▌View Related Live Charts: US - Retail Sales
The Redbook retail sales index rose to 6.1% y/y during the February 28 week. Then again, the Consumer Confidence Index survey showed a sharp decline in vacation plans during February.
▌View Related Live Charts: US - Consumer Confidence
Furthermore, Target said on Tuesday that it expects little to no sales growth this year, with CEO Brian Cornell telling CNBC that higher prices are on the way. Walmart and electronics retailer Best Buy also recently warned about expectations for 2025.
(4) Mixed signals from the PMIs.
February’s purchasing managers added to the dissonance provided by the latest batch of economic indicators. The M-PMI dipped to 50.3 in February from 50.9 in January.
▌View Related Live Charts: US - ISM Manufacturing PMI
However, those were the first back-to-back readings above 50.0 since September and October 2022. Then again, February’s M-PMI subindexes for new orders (48.6) and employment (47.6) fell below 50.0. The regional business surveys conducted by five of the 12 Fed district banks showed better growth during February.
February’s NM-PMI remained solidly above 50.0 at 53.5.
All its major subindexes did the same. Just as we expected, the S&P Global flash NM-PMI provided a misleadingly weak estimate of the ISM version of this index.
Strategy II: Labor Market’s High NTSR.
Friday’s employment report for February also provided plenty of mixed signals. The payroll employment series (which measures the number of full-time and part-time jobs) rose 151,000, while the household employment series (which measures the number of workers with one or more jobs) fell 588,000. The latter is very volatile. It was up 2.2 million during January following an annual benchmark revision. The former was weaker than we expected, as we had anticipated a rebound from January’s cold blast. Well, it turns out that the weather was also bad in February. Consider the following:
(1) Bad weather again?
The household employment survey shows that 404,000 nonagricultural workers were not at work during February, the most since February 2014. The survey also found that 1.31 million nonagricultural workers who work full time had to work part time last month because of the weather. That’s the most since February 2021.
▌View Related Live Charts: US - Household Survey Employment - Workers Not at Work because of Weather
We had expected average weekly hours to rebound in February. Instead, it remained flat at January’s level. If bad weather depressed both months’ readings, then there should be a solid rebound in average weekly hours during March.
(2) Payroll employment.
While February’s payroll employment gain was weaker than we’d expected, the three-month average gain was 200,000.
▌View Related Live Charts: US - Nonfarm Payrolls vs. Unemployment Rate
That’s a robust reading. Excluding government, the three-month average was 169,000. That’s also a solid reading.
The questions ahead are how much will federal government employment fall in coming months as a result of the activities of the DOGE Boys, and will private payroll gains more than offset the losses of federal jobs? We think so, though this is certainly one of the great uncertainties resulting from Trump Turmoil 2.0. The losses started in February with federal government employment down 10,000.
This number could potentially double, triple, or even quadruple in coming months.
(3) Earned income proxy.
During February, private-sector payrolls rose 0.1%, the average workweek for private-sector workers was unchanged, and average hourly earnings in the private sector rose 0.3%. So our Earned Income Proxy edged up 0.4% m/m.
We expect bigger rebounds in February’s retail sales and total consumer spending from January’s deep freeze, unless bad weather kept shoppers at home during February too.
(4) Unemployment and layoffs.
The bad news is that February’s Challenger Report showed that government-announced layoffs totaled 62,240.
The private sector isn’t likely to significantly offset such job cuts if they all hit in March and April, especially since the Trump administration is planning even more layoffs.
In the private sector, announced layoffs in retailing during February totaled 38,960, the second highest tally on record. Retail payrolls fell 6,300 during the month. Information employment rose 5,000 last month. Announced layoffs in technology totaled 14,550. This means that we should expect sizeable increases in weekly initial and continuing unemployment claims in coming weeks.
While the official headline unemployment rate remained low at 4.1% during February, the U-6 rate rose to 8.0%, the highest since 2021.
▌View Related Live Charts: US - Unemployment Rate
The latter was boosted by more workers employed part-time for economic reasons.
Both jobless rates are bound to increase during the next few months.
Big Tech earnings week is here! Stay ahead with MacroMicro’s Economic Calendar — track CPI, GDP, and key earnings like Apple & Google all in one place. Check it out »