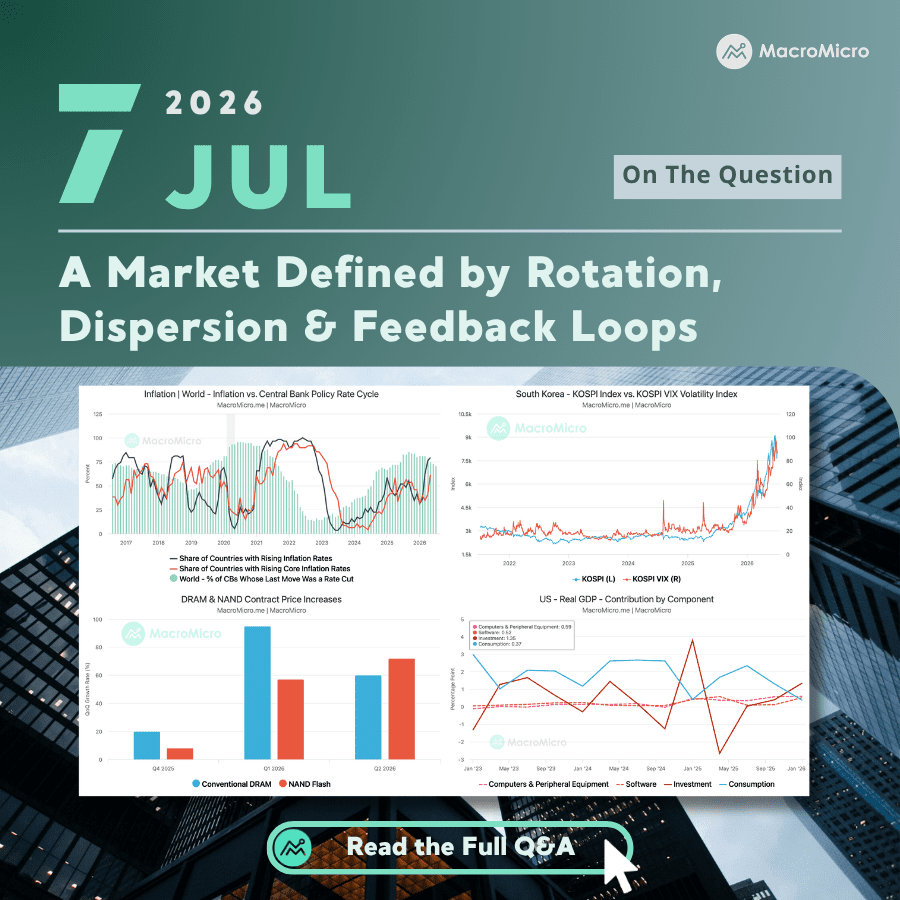
The market is moving beyond a single dominant narrative. Capital is broadening beyond the US, but the shift is concentrated in the semiconductor and AI hardware ecosystem, while a renewed manufacturing restocking cycle supports cyclicals and high beta.
At the same time, investors are becoming more selective about where AI spending translates into cash flow, as memory shortages shift pricing power toward suppliers and leveraged single-stock ETFs add new procyclical risks. With the US expansion becoming increasingly investment-led and central banks navigating an uneven inflation shock rather than a synchronized tightening cycle, the next phase of the market will be defined less by broad exposure than by understanding where capital, capacity, and cash flow are actually moving.
Key Takeaways
- Global capital is broadening, but AI hardware and semiconductors remain the central engine of market leadership.
- A renewed manufacturing cycle is supporting cyclicals, while investors increasingly favor AI exposure backed by cash flow rather than capex alone.
- Supply constraints, leveraged ETFs, and market concentration are creating new sources of volatility across the technology ecosystem.
- The US expansion remains investment-led, while diverging monetary policy and Fed reform add a new layer of uncertainty.
About On the Question
On the Question compiles macroeconomic, investment, and geopolitical risk questions submitted by our corporate clients. Our clients span a broad range of industries, including financial services, semiconductors and electronics, automotive manufacturing, shipping and logistics, steel and heavy industry, real estate development, energy and petrochemicals, and many other key sectors across the global economy.
 Get answers from MM AI.
-
Why did Korea's circuit breaker trigger six times in 2026, indicating structural issues beyond semiconductor volatility?
💡Korea's circuit breaker triggered six times in the first half of 2026, stemming from both semiconductor volatility and structural issues. Samsung Electronics and SK Hynix constitute approximately 40% of the KOSPI index, making the market highly susceptible to shocks in these companies. This concentration is amplified by leveraged single-stock ETFs, which magnify underlying movements through daily rebalancing. A recent downgrade of SK Hynix's Q2 outlook, for instance, caused both chip stocks to fall over 10% in a single session, leading to a circuit breaker trigger. This pattern will likely persist until index concentration or leveraged ETF exposure decreases.
-
How do single-stock leveraged ETFs drive market instability, given their daily rebalancing mechanisms?
💡Single-stock leveraged ETFs drive market instability primarily through their daily rebalancing mechanism. To maintain a fixed leverage ratio, these funds are compelled to buy into strength and sell into weakness daily, thereby amplifying existing market trends. Nomura estimates that a mere 1% move in the underlying asset can necessitate up to $9 billion in rebalancing flow across related products. These ETFs now account for over 20% of the entire leveraged ETF market, with Korea approving its first 16 double-leveraged single-stock products in May, linked to Samsung Electronics and SK Hynix. Trading in these Korean products reached 212 trillion won in June alone, representing 26.6% of total Korean ETF turnover. Both the Bank of Korea and the FSS have highlighted the procyclical risk posed by these products, with the FSS chairman expressing regret over their approval.
-
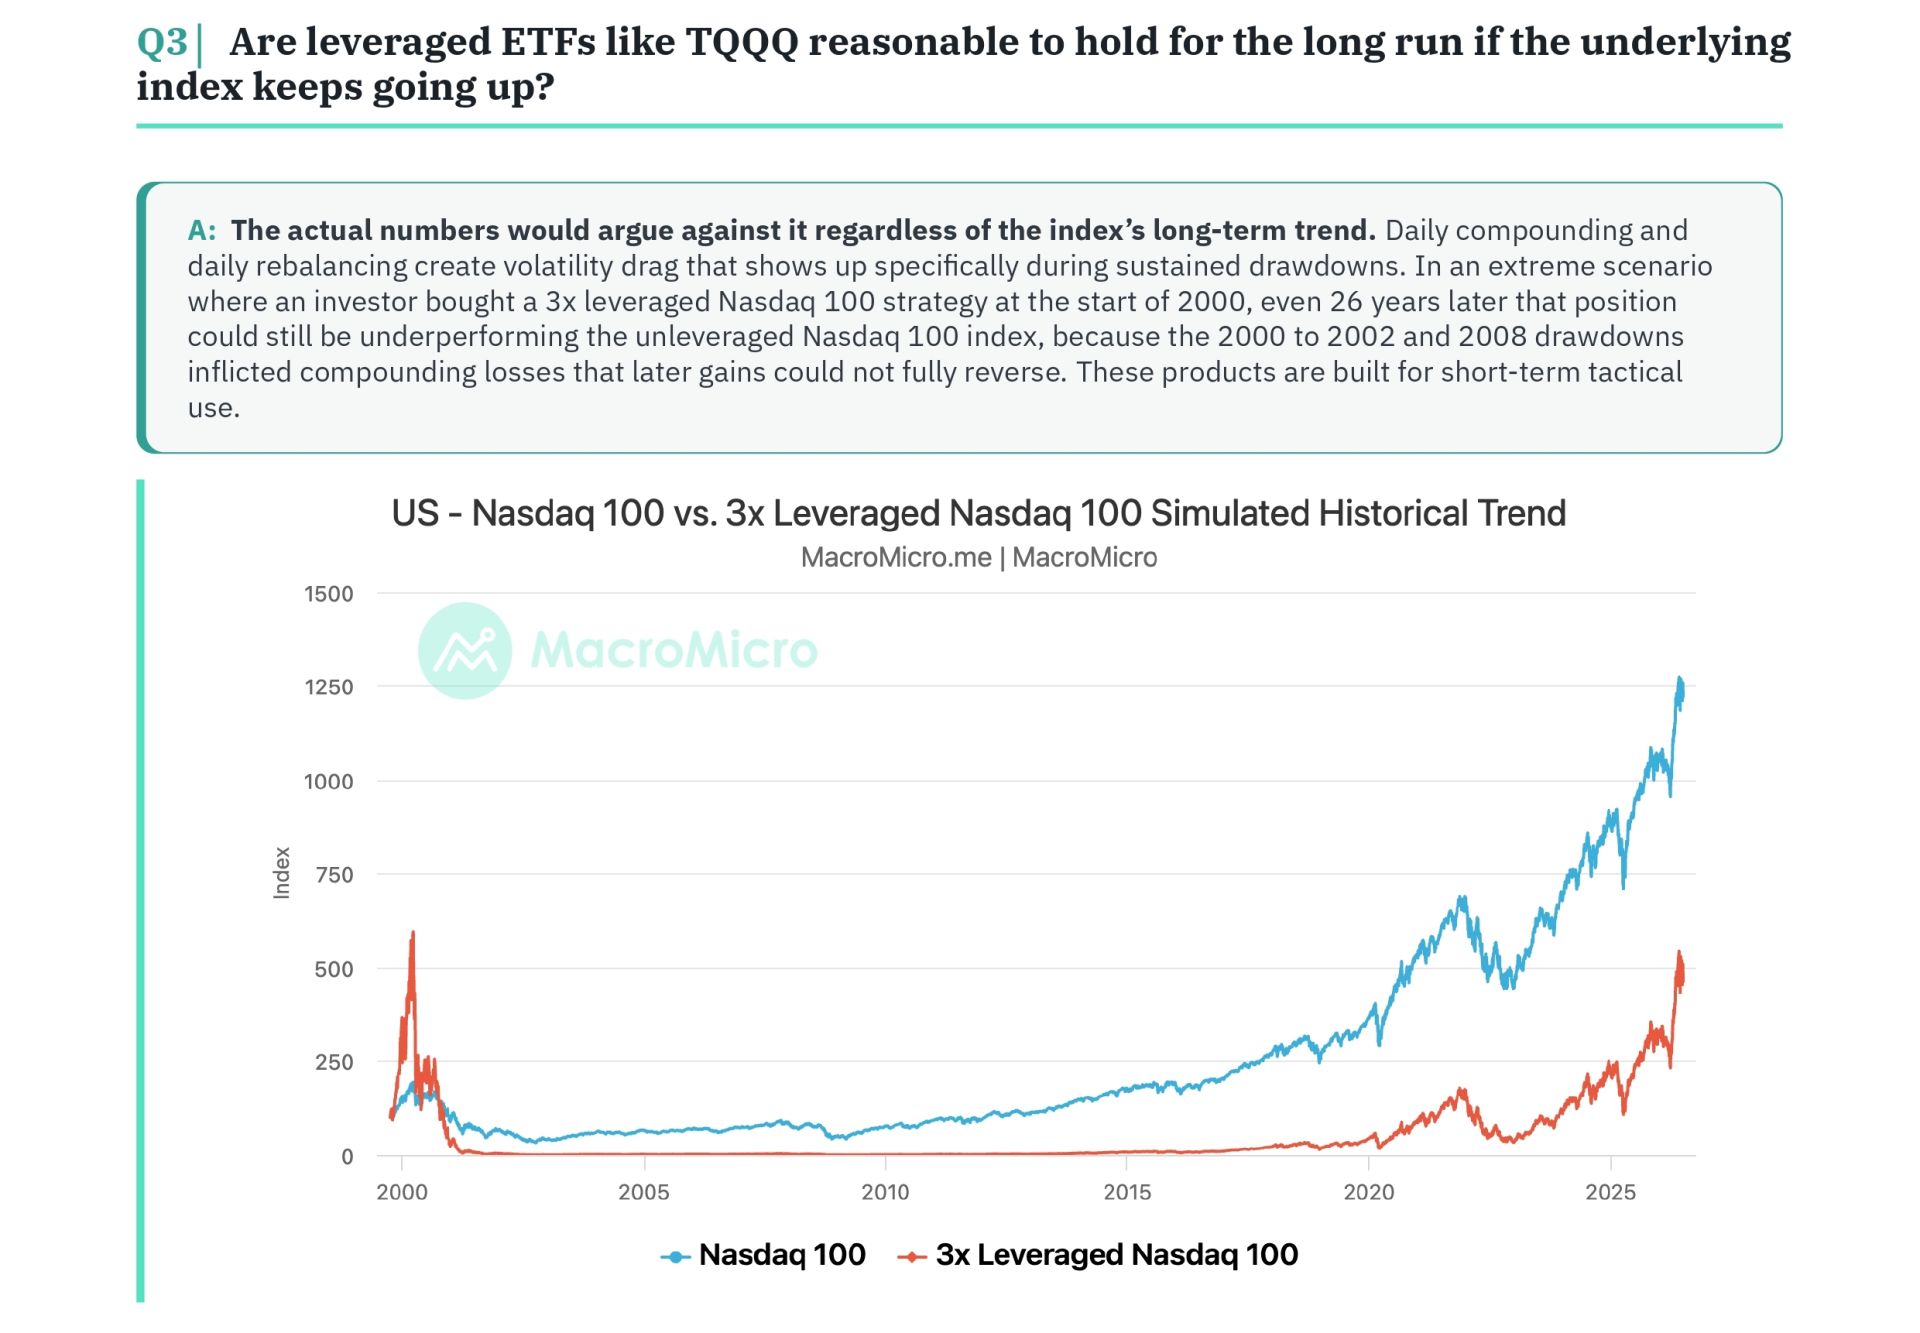
Are leveraged ETFs like TQQQ suitable for long-term holding, considering volatility drag and compounding losses?
💡Leveraged ETFs like TQQQ are generally not suitable for long-term holding, regardless of the underlying index's long-term upward trend, due to volatility drag created by daily compounding and rebalancing. This drag is particularly evident during sustained drawdowns. For example, an investor who bought a 3x leveraged Nasdaq 100 strategy at the start of 2000 could still be underperforming the unleveraged Nasdaq 100 index 26 years later. The significant drawdowns of 2000-2002 and 2008 inflicted compounding losses that subsequent gains could not fully reverse. These products are designed for short-term, tactical use.
-
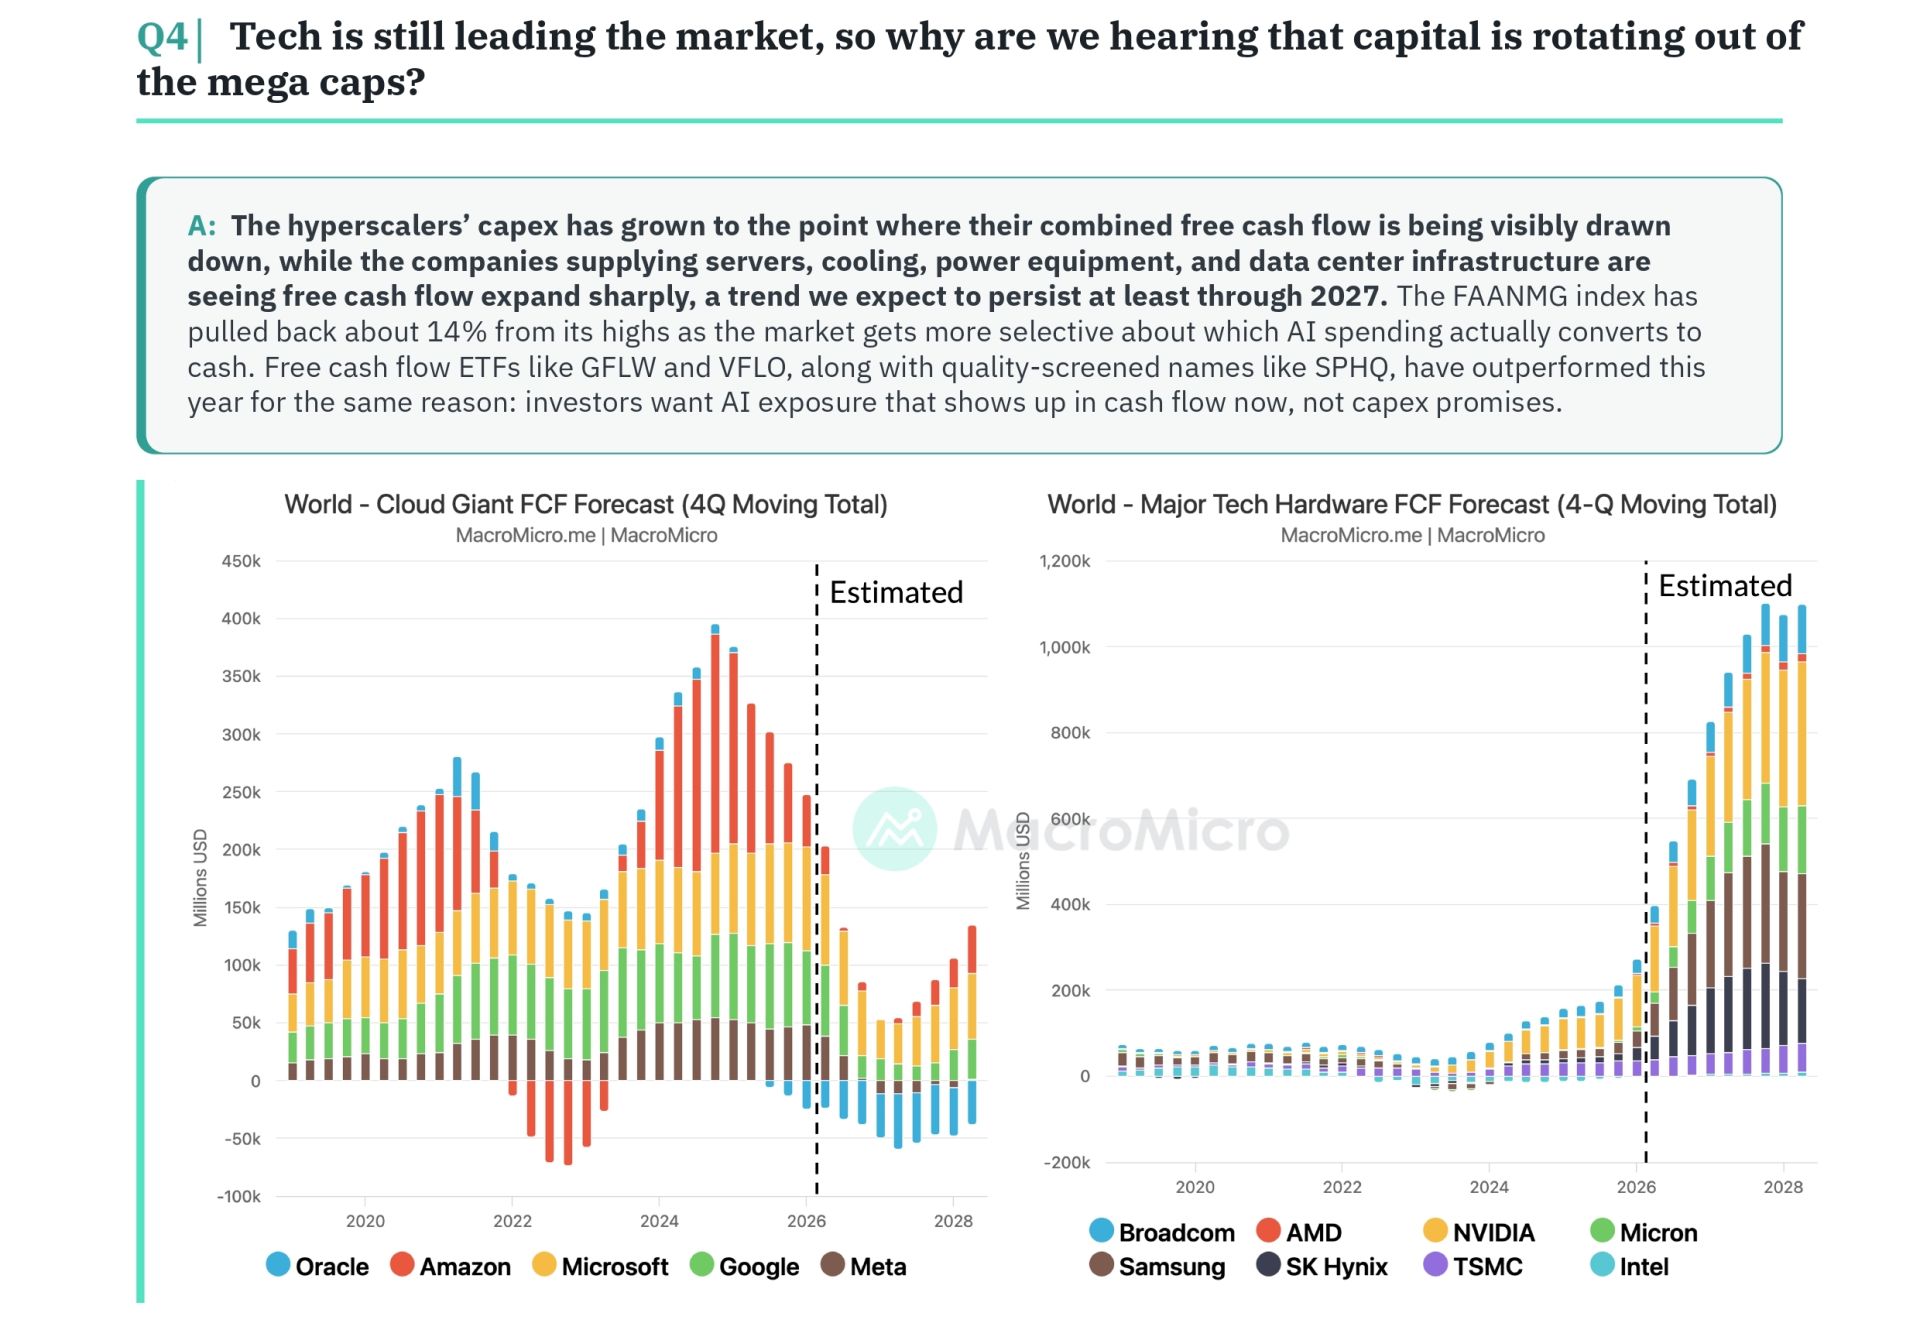
Why is capital rotating out of mega-cap tech, despite continued market leadership from the tech sector?
💡Capital is rotating out of mega-cap tech despite the sector's market leadership because the hyperscalers' capital expenditure has grown to a point where their combined free cash flow is visibly declining. In contrast, companies supplying servers, cooling, power equipment, and data center infrastructure are experiencing sharp increases in free cash flow, a trend expected to continue through 2027. The FAANMG index has retreated approximately 14% from its highs, indicating increased market selectivity regarding AI spending that translates into immediate cash flow. Free cash flow ETFs like GFLW and VFLO, alongside quality-screened names such as SPHQ, have outperformed this year, as investors prioritize AI exposure that generates current cash flow over future capex promises.
-
Does the outperformance of cyclical and high-beta stocks this year indicate a late-cycle economic phase?
💡The outperformance of cyclical and high-beta stocks this year does not indicate a late-cycle economic phase; rather, it suggests the opposite, based on the current manufacturing cycle. The manufacturing cycle index rose to 0.55 in June from 0.43, marking a second upswing after the 2025 peak and subsequent pullback, a pattern infrequently observed in the last decade. This aligns with an active restocking phase, explaining why high-beta and momentum factors, along with cyclicals like materials and discretionary, have outperformed defensives such as healthcare, staples, and utilities. The primary risk is not being late-cycle now, but rather if restocking becomes passive in the fourth quarter. If new orders continue to outpace inventory builds, this phase will persist; however, if new orders decline while inventories climb, it signals a cycle reversal.
-
What caused central banks to raise rates in 2026, and is this a return to the 2022 hiking cycle?
💡Central banks raised rates in 2026 for the first time since 2023, driven by a combination of factors, primarily the Middle East conflict pushing energy prices higher and global inflation breadth reaching approximately 79.3% of countries. The Bank of Japan hiked to 1.0% in June, a 31-year high, the ECB raised its deposit rate to 2.25%, and Australia enacted three hikes. However, this is not a return to the synchronized global tightening cycle of 2022, as only about 26.7% of central banks are currently in a hiking stance, a marginal increase from 25.3%. If Middle East tensions subside, energy-driven inflation should ease, making a Fed hike this year unlikely, with a return to cuts possible in 2027. Gold and crypto ETFs saw large outflows as real rates rose, but sustained central bank gold buying suggests the pullback is an entry point, not a trend reversal.
-
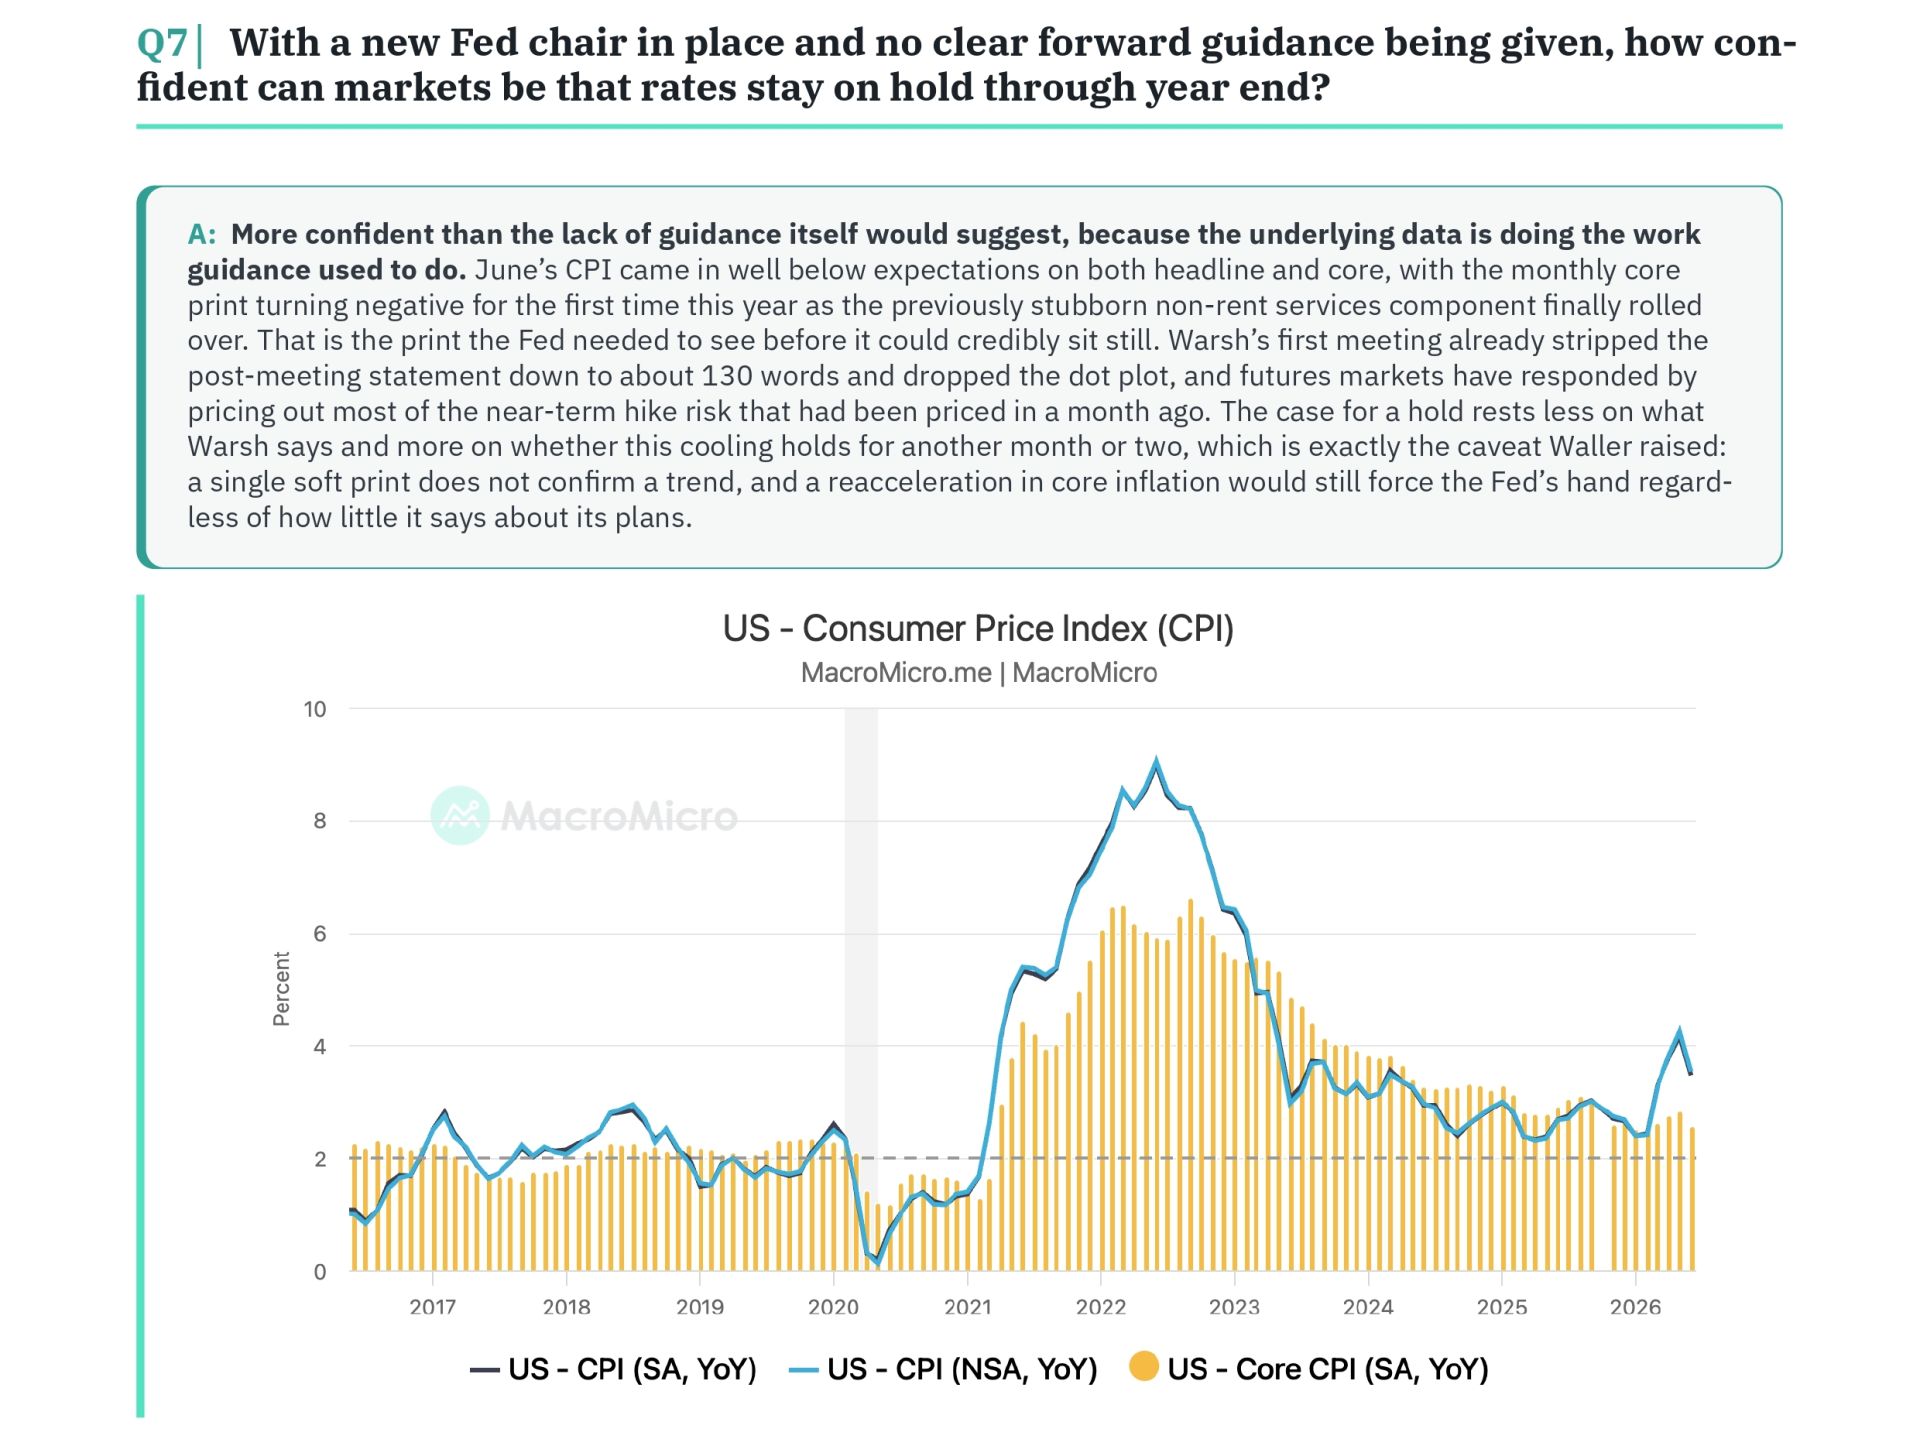
How confident can markets be about stable rates through year-end, despite a lack of clear Fed guidance?
💡Markets can be more confident about stable rates through year-end than the lack of clear Fed guidance suggests, because underlying data is now performing the role guidance once did. June's CPI, both headline and core, came in significantly below expectations, with the monthly core print turning negative for the first time this year as the previously stubborn non-rent services component finally softened. This was the data point the Fed needed to credibly maintain a pause. Warsh's initial meeting already streamlined the post-meeting statement to about 130 words and eliminated the dot plot, and futures markets have responded by largely pricing out near-term hike risk. The case for a hold depends less on Warsh's statements and more on whether this cooling trend persists for another one to two months, echoing Waller's caveat that a single soft print does not confirm a trend and a reacceleration in core inflation would still necessitate Fed action.
-
What do Warsh's new Fed policy task forces signal about the direction of monetary reform and balance sheet policy?
💡Warsh's naming of leaders for the Fed's five new policy task forces signals a deliberate, cautious approach to reform. The roster of 15 members across communications, balance sheet policy, data, productivity and employment, and inflation framework, drawing on former central bank governors and figures from business and academia without clear partisan or ideological leans, indicates an effort to ensure recommendations are not easily dismissed. This suggests a slower, more careful process than the communication shift. The Communications task force, led by critics of forward guidance like Mervyn King and Richard Fisher, suggests Warsh's dropped-dot-plot approach may become standard, focusing on explaining the reaction function. Balance sheet policy, led by Raghuram Rajan and Jeremy Stein, remains genuinely unresolved; Rajan highlights QT's faster reserve drain compared to QE's sticky deposits, while Stein argues for a larger balance sheet via reserves and short-term assets. Neither leader advocates for aggressive shrinkage, leaving the direction unclear, and other groups, particularly inflation framework, still need to reveal their stances on more politically sensitive issues.
-
Is the AI-driven memory shortage impacting broad consumer prices, or is Apple's price hike an isolated event?
💡The AI-driven memory shortage is broader than just Apple and is indeed filtering into consumer prices across the board. Memory suppliers have reallocated capacity towards HBM and high-margin DRAM to meet AI training and inference demands, resulting in tight supply for standard DRAM and NAND. This capacity squeeze is manifesting at the consumer level, with several Chinese phone brands and Dell already raising prices this year. Apple subsequently increased prices on its products by 10% to 30%, citing the same cost pressures. While investment in AI infrastructure contributed roughly half of US GDP growth in the first quarter, and retail sales and real consumption continue to expand, indicating investment is still driving growth, the key question is whether this remains a contained input-cost issue or impacts broader consumption.
-
How did memory suppliers gain significant pricing power over large customers like Apple?
💡Memory suppliers gained significant pricing power over large customers like Apple primarily through industry-wide capacity reallocation. Between 2023 and 2025, memory manufacturers shifted production towards HBM and DDR5 for generative AI training, allowing older DDR4 and LPDDR4 lines to diminish. Simultaneously, agentic AI is increasing CPU demand and token volumes, driving up demand for standard DRAM and enterprise SSDs while capacity remains concentrated in HBM. Suppliers also drastically cut capital expenditure after the 2023 loss cycle, limiting new NAND capacity. Consequently, Cloud Service Providers (CSPs) are now entering long-term supply agreements to secure volume, with Micron disclosing 16 strategic customer agreements totaling approximately $100 billion in cumulative committed revenue through 2030, some without price caps, and even prepaying with cash deposits. Consumer brands are left to purchase residual capacity, effectively nullifying Apple's prior negotiating leverage.
