Executive Summary:
We continue to bet on the resilience of the American economy. Yes, the Atlanta Fed’s GDPNow model lowered its Q1 GDP forecast significantly on Friday. The volatile model swung in response to January’s surge in imported goods ahead of Trump’s tariffs. In addition, consumer spending was depressed by a colder-than-usual January, but consumer spending and the model are bound to rebound in February. Eric explains why we believe pessimism about the economic outlook is unwarranted. … Also: The uncertainty introduced by Trump 2.0’s flurry of aggressive actions has lured bears out of their caves. Eric provides counterarguments to their most common growlings. Check out the accompanying chart collection.
Strategy I: Addressing the Growth Scare
On Friday, the Atlanta Fed’s Q1 GDPNow model fell from 2.3% to -1.5% (q/q, saar).
 ▌View Related Live Charts: Atlanta Fed’s GDPNow model
Naturally, that amplified the ongoing concerns that the US economy is quickly slowing, perhaps due to uncertainty attributable to Trump 2.0. While much of the drop in the model’s estimate did have to do with Trump 2.0, January’s trade data that triggered it don’t portend a significant economic slowdown. Neither do January’s consumption data, in our opinion. Both were released on Friday.
Here’s more:
(1) Frontrunning tariffs.
In the GDP calculation, when US imports rise faster than exports, that weighs on real GDP growth. In January, goods imports soared to a record high, causing the trade deficit to widen 70% y/y to $153.3 billion, or a $1.8 trillion annualized deficit.
 ▌View Related Live Charts: US - Exports vs Imports
The bulk of this surge represented importers getting ahead of potential tariff increases. Imports of industrial supplies increased by 63.2%, and imports of consumer goods rose by 25.9%.
The trade data went from weighing on the GDPNow model’s expected Q1 growth by -0.41% to -3.70%, leading to the huge swing.
 ▌View Related Live Charts: Atlanta Fed’s GDPNow model
(2) Wait for the February data. The problem with the GDPNow model is that it can be erratic, and its latest swing catches only the surge in imports. The reason net exports are subtracted from overall GDP is that usually imports are already accounted for in consumption and inventory investment data—that’s why they typically correlate with US economic growth. Consumption was weak in January because of the coldest January weather since 2011. We expect that consumption will rebound while imports weaken in February and March. If so, then real GDP should grow at least 1.5% in Q1 and 2.5% in Q2.
(3) Markets’ reaction,
The 10-year Treasury yield now stands just below the bottom of our 2025 expected range of 4.25%-4.75%, hovering around 4.20%.
 ▌View Related Live Charts: US - 10Y Treasury vs. TIPS Bond Yields
It had been around 4.25% on Friday—and stocks had been up on the day—until Ukrainian President Volodymyr Zelenskyy’s public meeting with President Donald Trump and Vice President JD Vance turned into a chaotic shouting match. Stocks managed to finish the day higher thanks to some month-end markups (or window dressing).
In any event, the markets may be reading too much into the trade data that are temporarily weighing on GDP expectations. We’re still expecting a rebound in the February and March economic data; however, growth will likely slow during Q1 and perhaps Q2 before accelerating in the back half of the year as uncertainty fades.
Strategy II: Animal Spirits Trump Uncertainty
If you’re searching for a bearish narrative, take your pick. Bearish prognosticators have been licking their wounds since the no-show recession of 2022 and 2023 and since the 2024 summer slowdown proved to be a head fake. Trump 2.0 seems to be bringing them out of hibernation.
Among the many economic challenges ahead cited by the growing cohort of bears are:
- Fiscal stimulus will diminish, weighing directly on GDP. In other words, a fiscal cliff is coming soon.
- Consumers will retrench because they are too leveraged or have run out of excess savings.
- The positives of Trump 2.0’s pro-business stance are outweighed by the negatives of policy uncertainty, drummed up by daily executive orders and tariff announcements. This uncertainty will restrain capital spending and is already spurring a slowdown in the services economy.
- The Department of Government Efficiency (DOGE) is slashing the federal workforce and contracted workers. That will jack up unemployment and knock down consumer spending.
- Should DOGE fail in its aims of narrowing the budget and slowing the growth in federal spending, then higher interest rates and a fiscal crisis are inevitable. Corporate defaults, slimmer profit margins, and lower stock prices surely would follow. The reduced net wealth effect would weigh doubly on consumer spending. Construction employment would suffer from the housing market malaise under higher rates.
So whether DOGE succeeds or fails, the thinking goes, the economy is doomed. Woe is us! The wall of worry grows a brick row higher each day.
We believe the current uncertainty will be offset by the US economy’s dynamism. The economy has demonstrated its resilience since the pandemic started. That’s especially true over the past three years, when monetary policy turned restrictive to beat down inflation yet the economy continued to grow. There hasn’t been a recession since the pandemic lockdowns during the first two quarters of 2020.
We expect that pro-business policies, as they emerge, will boost longer-term confidence, allaying short-term uncertainties related to Trump 2.0. We think the naysayers are hanging too much significance on what drove economic growth in the years that followed the pandemic and not enough on what will drive it going forward.
Ironically, their excuse for being wrong in expecting a recession over the past three years is that fiscal policy was stimulative, which staved off the downturn. Now that it is likely to turn less stimulative, the odds of a recession are increasing again, in their opinion. That is such yesterday thinking! We are thinking ahead to tomorrow, focused on future developments that are already stimulating the economy such as the tech-led productivity boom at the crux of our Roaring 2020s outlook. In short, our long-held bullish stance remains intact.
Consider some rebuttals to the bears’ concerns:
(1) Government vs private sector spending. There’s a certain fatalism in believing that the US economy is heading for a debt crisis but at the same time believing that anything done to avert it would plunge the economy into a recession caused by a fiscal cliff anyway.
Some chalk up America’s real GDP growth in the post-pandemic period mostly to massive fiscal stimulus. We agree that the pandemic-time fiscal stimulus was excessive, as the sticky inflationary pressures still evident four years later attest. But more importantly, we believe that the private sector can offset the slowdown in government spending and is likely to do so by allocating capital to more productive projects and sectors.
For instance, the Biden administration focused too much on electric vehicles and green energy and not enough on semiconductors, defense, and the electric grid. The CHIPS and Science Act (around $53 billion in appropriated funds) paled in comparison to the Inflation Reduction Act (a $400 billion hit to the federal deficit), and the Infrastructure Investment and Jobs Act (around $550 billion in new spending).

But the AI boom is already boosting massive private-sector spending on R&D, information processing equipment, and software, which now account for half of all nonresidential fixed investment.
 ▌View Related Live Charts: Big Tech - Magnificent 7 CapEx (Cumulative Total)
Between Apple’s latest announcement and Stargate (Microsoft/OpenAI, Oracle, and SoftBank), there’s $1 trillion of planned capital spending over the next four years.
(2) Offering outlay relief. We were encouraged by the latest budget bill passed by the House of Representatives, which includes $2 trillion of directed spending cuts over the next decade. All else equal, lower federal spending means slower economic growth. If federal spending does fall by $2 trillion by 2035, GDP growth will be lower unless consumption and investment rise and/or the trade deficit narrows. We are optimistic that all three of these will occur.
Can personal consumption expenditures and fixed investment increase by an extra $2 trillion over the next 10 years? Certainly. Consumption is 68% of GDP, or $19 trillion, and will likely breach $25 trillion within the next decade.

Investment is 18% of GDP, or $5 trillion, and will likely breach $7 trillion. Given our expectations that productivity growth reaches 3.0%-3.5% by 2030, an extra $2 trillion is achievable.
 ▌View Related Live Charts: US - Nonfarm Payrolls vs. Unemployment Rate
We expect both tax cuts and deregulation to accelerate consumption and capital spending, helping to quicken those productivity gains.
(3) Taming trade. The trade deficit can also do some lifting. Reducing net exports from the current -3.1% of GDP to -1.5% would improve GDP by $663 billion by 2035 (assuming annualized nominal GDP growth of 4%). So consumption and investment combined would have to pick up by only $1.3 trillion. These are not mutually exclusive events. Increased domestic investment is the likely result of Trump 2.0’s nascent trade policies, which are also aimed at improving the trade deficit. This scenario includes consumers’ spending more on domestically produced goods and services.
(4) Reducing revenues? Or raising them?
The $2 trillion of spending cuts in the House bill were paired with $4.5 trillion in tax cuts. The reduction in receipts from the baseline would roughly reduce federal revenues by about 1.0%-1.5% of GDP through the next decade.
 ▌View Related Live Charts: US - Federal Government - Tax Receipts on Corporate Income
In our opinion, the stimulative impact of lower taxes and encouraged investment in the US will offset a portion of the cuts with higher growth.
(5) Putting a dent in the deficit. If outlays grow at a 5% average annualized rate—which is roughly average for the 2014-19 period—then the $2 trillion in spending cuts will push federal outlays down to about 20% of GDP. That would be historically normal and consistent with a budget deficit that’s 3% of GDP.

 ▌View Related Live Charts: US - Federal Surplus or Deficit (% of GDP)
We’re doing very back-of-the-envelope math here, but the point is that lower federal spending is not a doom scenario for the US economy and Trump 2.0’s economic goals are more realistic than they get credit for. In other words, the markets aren’t pricing in these optimistic possibilities.
(6) Consumers keeping it cool, not cooling
The US consumer is fine. Since the root cause of rising unemployment last year was mostly immigration and increased labor force participation, we do not believe DOGE-related firings will spiral into mass layoffs.
 ▌View Related Live Charts: US - Unemployment Rate
Government employees make up just 12.5% of total payrolls, and state and local governments should be less affected by DOGE than the federal government.

As long as the unemployment rate remains in the 4.0%-4.5% range that we expect—which is likely now that immigration has slowed substantially—consumers will continue to spend apace.
Last Monday on CNBC, JP Morgan CEO Jamie Dimon, long bearish on consumer spending, said he now sees consumers as nearly “back to normal”: “[T]hey don’t have all the extra money, but they have jobs. Wages are going up. …So you are starting to see what I put at normal. Credit costs have normalized. So it’s just almost back to what I call a normal environment.”
Dimon was among the most worried about the consumer throughout 2022 and 2023. As he suggests, real wages are rising.
 ▌View Related Live Charts: US - Hourly Wage Growth by Work Type
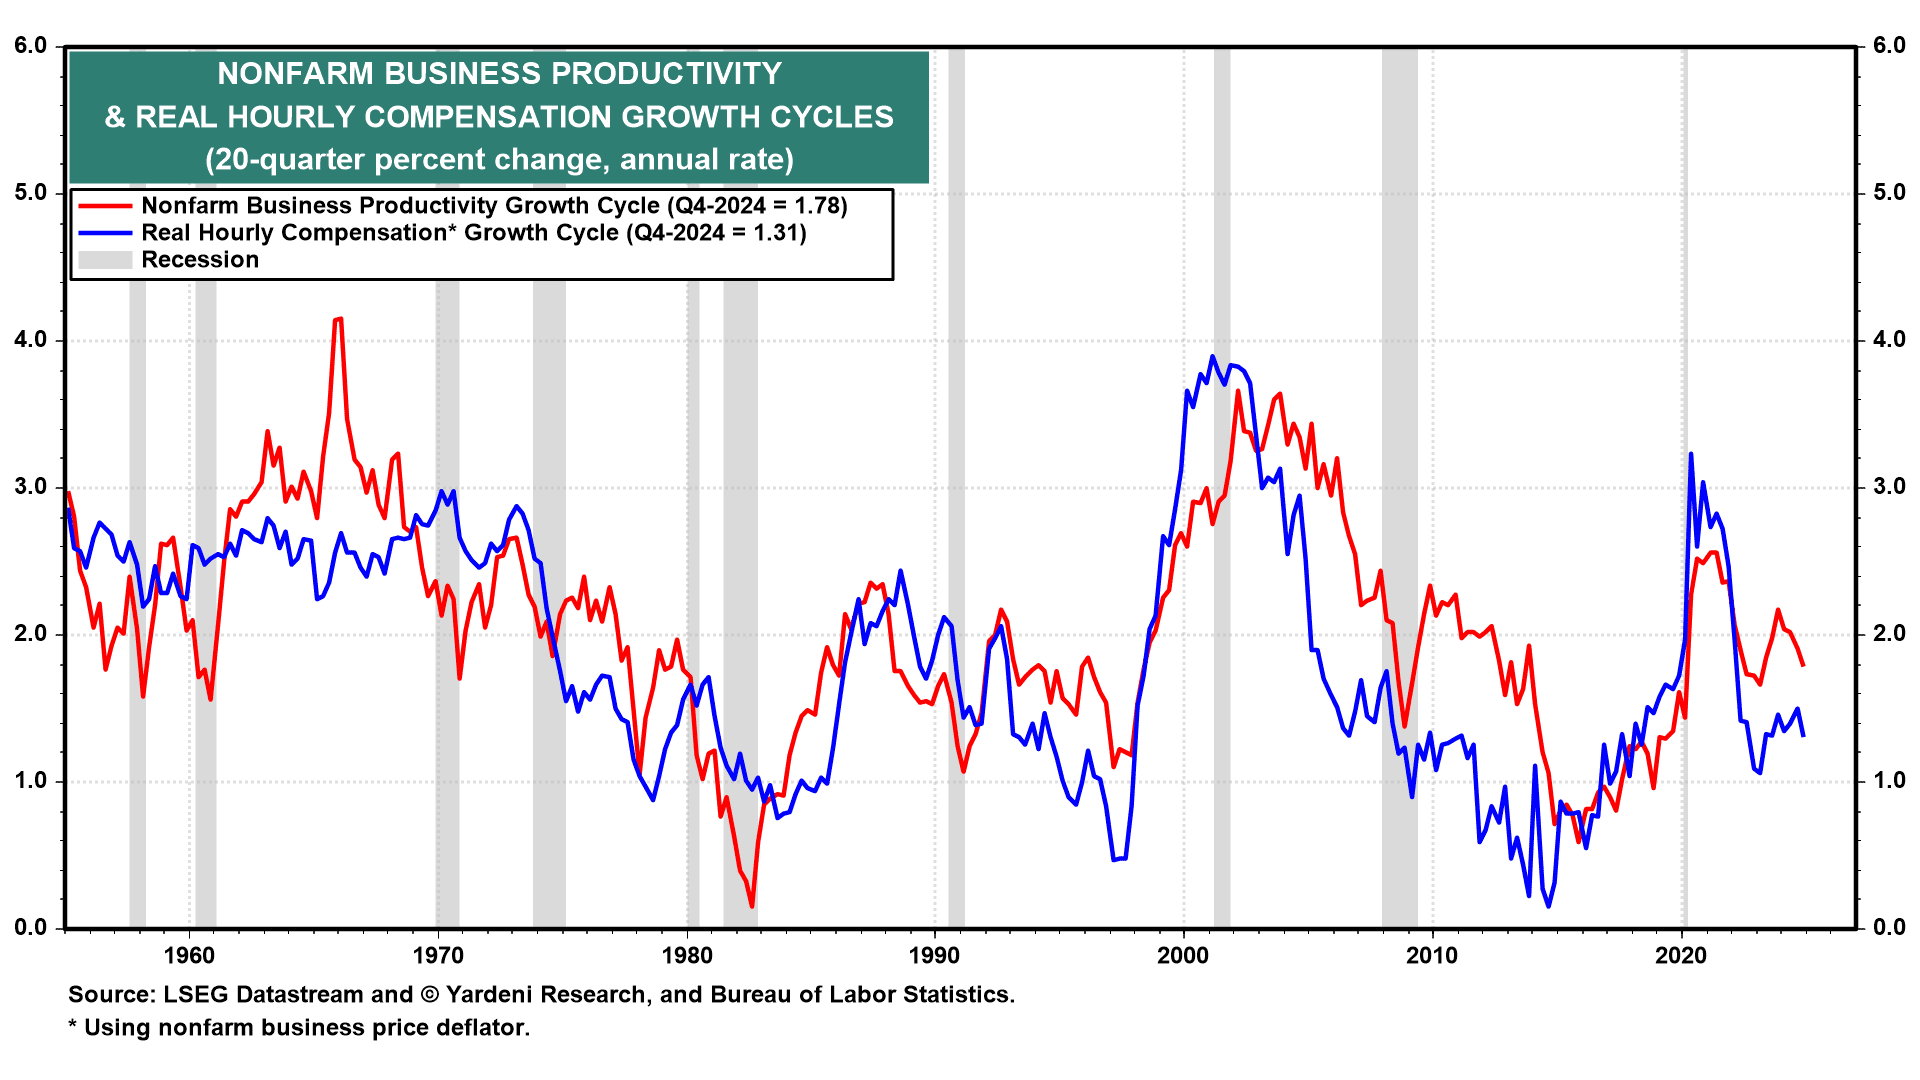
We expect rising productivity growth to keep that train on track.
(7) Uncertainty abounds.
Certainty is good for business. The outlook has gotten more uncertain over the past few months.

But we do not expect this uncertainty to persist. While the S&P Global NM-PMI contracted slightly this month, it tends to be more volatile than the ISM NM-PMI.
 ▌View Related Live Charts: US - ISM Services Index
Redbook retail sales are still up 5.9% y/y.
 ▌View Related Live Charts: US - Retail Sales
And based on regional Fed manufacturing surveys, we expect the ISM M-PMI to post a second straight month above 50.0, indicative of expansion.
 ▌View Related Live Charts: US - ISM Manufacturing PMI
Last month marked the index’s first foray into expansion territory since the Fed started tightening in early 2022 and suggests the manufacturing sector has finally entered a rolling recovery.
(8) Housing horror show. The housing market has been a mess for several years, if not since the turn of the century. With overall construction employment around record highs, several observers have insinuated that the economy is entering a cyclical slowdown as housing permits and starts fall.
 ▌View Related Live Charts: US - Nonfarm Payrolls - Construction (Monthly Change)
 ▌View Related Live Charts: US - Housing Starts vs. Building Permits
But as Austin, Texas shows us (see this recent Bloomberg story), deregulation is the answer to high home prices. We believe Trump 2.0 will tackle this on a national level, stimulating more housing starts and permits and thereby keeping employment elevated.
Meanwhile, the supply of construction employment has fallen with decreased immigration, so employers are likely to hold onto their workers. And though many in construction are working on nonresidential buildings, it’s notable that roughly half of residential construction employment is remodelers.

That suggests that construction employment is relatively shielded from any potential housing slowdown, and that construction skills are transferable across different types of projects.
(9) Winning with the wealth effect
The excess-savings-depleting story that led to a lot of worry about the economic outlook over the past couple years was a nonstarter, in our opinion, mostly because retiring Baby Boomers were sitting on huge nest eggs that continued to appreciate. Between near-record stock prices and high home prices, the Baby Boomers now hold roughly $83 trillion of the $160 trillion in US household wealth.

So we haven’t been worried about the relatively low personal savings rate; in fact, we think it may fall into negative territory by the end of the decade.
Could the wealth effect reverse? A bear market in stocks and much lower home prices likely would lead consumers and businesses to pull back some of their spending. But that would be likely only in a recession, which we see as improbable at the moment. If a recession were to become more likely, automatic stabilizers and the ease-first-ask-questions-later Fed would quickly restimulate markets and the economy. Both a recession and a fiscal crisis are in our 20%-probability what-could-go-wrong bucket of economic scenarios. We still apply an 80% subjective probability to outcomes that are bullish for US stocks.
Executive Summary:
We continue to bet on the resilience of the American economy. Yes, the Atlanta Fed’s GDPNow model lowered its Q1 GDP forecast significantly on Friday. The volatile model swung in response to January’s surge in imported goods ahead of Trump’s tariffs. In addition, consumer spending was depressed by a colder-than-usual January, but consumer spending and the model are bound to rebound in February. Eric explains why we believe pessimism about the economic outlook is unwarranted. … Also: The uncertainty introduced by Trump 2.0’s flurry of aggressive actions has lured bears out of their caves. Eric provides counterarguments to their most common growlings. Check out the accompanying chart collection.
Strategy I: Addressing the Growth Scare
On Friday, the Atlanta Fed’s Q1 GDPNow model fell from 2.3% to -1.5% (q/q, saar).
▌View Related Live Charts: Atlanta Fed’s GDPNow model
Naturally, that amplified the ongoing concerns that the US economy is quickly slowing, perhaps due to uncertainty attributable to Trump 2.0. While much of the drop in the model’s estimate did have to do with Trump 2.0, January’s trade data that triggered it don’t portend a significant economic slowdown. Neither do January’s consumption data, in our opinion. Both were released on Friday.
Here’s more:
(1) Frontrunning tariffs.
In the GDP calculation, when US imports rise faster than exports, that weighs on real GDP growth. In January, goods imports soared to a record high, causing the trade deficit to widen 70% y/y to $153.3 billion, or a $1.8 trillion annualized deficit.
▌View Related Live Charts: US - Exports vs Imports
The bulk of this surge represented importers getting ahead of potential tariff increases. Imports of industrial supplies increased by 63.2%, and imports of consumer goods rose by 25.9%.
The trade data went from weighing on the GDPNow model’s expected Q1 growth by -0.41% to -3.70%, leading to the huge swing.
▌View Related Live Charts: Atlanta Fed’s GDPNow model
(2) Wait for the February data. The problem with the GDPNow model is that it can be erratic, and its latest swing catches only the surge in imports. The reason net exports are subtracted from overall GDP is that usually imports are already accounted for in consumption and inventory investment data—that’s why they typically correlate with US economic growth. Consumption was weak in January because of the coldest January weather since 2011. We expect that consumption will rebound while imports weaken in February and March. If so, then real GDP should grow at least 1.5% in Q1 and 2.5% in Q2.
(3) Markets’ reaction,
The 10-year Treasury yield now stands just below the bottom of our 2025 expected range of 4.25%-4.75%, hovering around 4.20%.
▌View Related Live Charts: US - 10Y Treasury vs. TIPS Bond Yields
It had been around 4.25% on Friday—and stocks had been up on the day—until Ukrainian President Volodymyr Zelenskyy’s public meeting with President Donald Trump and Vice President JD Vance turned into a chaotic shouting match. Stocks managed to finish the day higher thanks to some month-end markups (or window dressing).
In any event, the markets may be reading too much into the trade data that are temporarily weighing on GDP expectations. We’re still expecting a rebound in the February and March economic data; however, growth will likely slow during Q1 and perhaps Q2 before accelerating in the back half of the year as uncertainty fades.
Strategy II: Animal Spirits Trump Uncertainty
If you’re searching for a bearish narrative, take your pick. Bearish prognosticators have been licking their wounds since the no-show recession of 2022 and 2023 and since the 2024 summer slowdown proved to be a head fake. Trump 2.0 seems to be bringing them out of hibernation.
Among the many economic challenges ahead cited by the growing cohort of bears are:
- Fiscal stimulus will diminish, weighing directly on GDP. In other words, a fiscal cliff is coming soon.
- Consumers will retrench because they are too leveraged or have run out of excess savings.
- The positives of Trump 2.0’s pro-business stance are outweighed by the negatives of policy uncertainty, drummed up by daily executive orders and tariff announcements. This uncertainty will restrain capital spending and is already spurring a slowdown in the services economy.
- The Department of Government Efficiency (DOGE) is slashing the federal workforce and contracted workers. That will jack up unemployment and knock down consumer spending.
- Should DOGE fail in its aims of narrowing the budget and slowing the growth in federal spending, then higher interest rates and a fiscal crisis are inevitable. Corporate defaults, slimmer profit margins, and lower stock prices surely would follow. The reduced net wealth effect would weigh doubly on consumer spending. Construction employment would suffer from the housing market malaise under higher rates.
So whether DOGE succeeds or fails, the thinking goes, the economy is doomed. Woe is us! The wall of worry grows a brick row higher each day.
We believe the current uncertainty will be offset by the US economy’s dynamism. The economy has demonstrated its resilience since the pandemic started. That’s especially true over the past three years, when monetary policy turned restrictive to beat down inflation yet the economy continued to grow. There hasn’t been a recession since the pandemic lockdowns during the first two quarters of 2020.
We expect that pro-business policies, as they emerge, will boost longer-term confidence, allaying short-term uncertainties related to Trump 2.0. We think the naysayers are hanging too much significance on what drove economic growth in the years that followed the pandemic and not enough on what will drive it going forward.
Ironically, their excuse for being wrong in expecting a recession over the past three years is that fiscal policy was stimulative, which staved off the downturn. Now that it is likely to turn less stimulative, the odds of a recession are increasing again, in their opinion. That is such yesterday thinking! We are thinking ahead to tomorrow, focused on future developments that are already stimulating the economy such as the tech-led productivity boom at the crux of our Roaring 2020s outlook. In short, our long-held bullish stance remains intact.
Consider some rebuttals to the bears’ concerns:
(1) Government vs private sector spending. There’s a certain fatalism in believing that the US economy is heading for a debt crisis but at the same time believing that anything done to avert it would plunge the economy into a recession caused by a fiscal cliff anyway.
Some chalk up America’s real GDP growth in the post-pandemic period mostly to massive fiscal stimulus. We agree that the pandemic-time fiscal stimulus was excessive, as the sticky inflationary pressures still evident four years later attest. But more importantly, we believe that the private sector can offset the slowdown in government spending and is likely to do so by allocating capital to more productive projects and sectors.
For instance, the Biden administration focused too much on electric vehicles and green energy and not enough on semiconductors, defense, and the electric grid. The CHIPS and Science Act (around $53 billion in appropriated funds) paled in comparison to the Inflation Reduction Act (a $400 billion hit to the federal deficit), and the Infrastructure Investment and Jobs Act (around $550 billion in new spending).
But the AI boom is already boosting massive private-sector spending on R&D, information processing equipment, and software, which now account for half of all nonresidential fixed investment.
▌View Related Live Charts: Big Tech - Magnificent 7 CapEx (Cumulative Total)
Between Apple’s latest announcement and Stargate (Microsoft/OpenAI, Oracle, and SoftBank), there’s $1 trillion of planned capital spending over the next four years.
(2) Offering outlay relief. We were encouraged by the latest budget bill passed by the House of Representatives, which includes $2 trillion of directed spending cuts over the next decade. All else equal, lower federal spending means slower economic growth. If federal spending does fall by $2 trillion by 2035, GDP growth will be lower unless consumption and investment rise and/or the trade deficit narrows. We are optimistic that all three of these will occur.
Can personal consumption expenditures and fixed investment increase by an extra $2 trillion over the next 10 years? Certainly. Consumption is 68% of GDP, or $19 trillion, and will likely breach $25 trillion within the next decade.
Investment is 18% of GDP, or $5 trillion, and will likely breach $7 trillion. Given our expectations that productivity growth reaches 3.0%-3.5% by 2030, an extra $2 trillion is achievable.
▌View Related Live Charts: US - Nonfarm Payrolls vs. Unemployment Rate
We expect both tax cuts and deregulation to accelerate consumption and capital spending, helping to quicken those productivity gains.
(3) Taming trade. The trade deficit can also do some lifting. Reducing net exports from the current -3.1% of GDP to -1.5% would improve GDP by $663 billion by 2035 (assuming annualized nominal GDP growth of 4%). So consumption and investment combined would have to pick up by only $1.3 trillion. These are not mutually exclusive events. Increased domestic investment is the likely result of Trump 2.0’s nascent trade policies, which are also aimed at improving the trade deficit. This scenario includes consumers’ spending more on domestically produced goods and services.
(4) Reducing revenues? Or raising them?
The $2 trillion of spending cuts in the House bill were paired with $4.5 trillion in tax cuts. The reduction in receipts from the baseline would roughly reduce federal revenues by about 1.0%-1.5% of GDP through the next decade.
▌View Related Live Charts: US - Federal Government - Tax Receipts on Corporate Income
In our opinion, the stimulative impact of lower taxes and encouraged investment in the US will offset a portion of the cuts with higher growth.
(5) Putting a dent in the deficit. If outlays grow at a 5% average annualized rate—which is roughly average for the 2014-19 period—then the $2 trillion in spending cuts will push federal outlays down to about 20% of GDP. That would be historically normal and consistent with a budget deficit that’s 3% of GDP.
▌View Related Live Charts: US - Federal Surplus or Deficit (% of GDP)
We’re doing very back-of-the-envelope math here, but the point is that lower federal spending is not a doom scenario for the US economy and Trump 2.0’s economic goals are more realistic than they get credit for. In other words, the markets aren’t pricing in these optimistic possibilities.
(6) Consumers keeping it cool, not cooling
The US consumer is fine. Since the root cause of rising unemployment last year was mostly immigration and increased labor force participation, we do not believe DOGE-related firings will spiral into mass layoffs.
▌View Related Live Charts: US - Unemployment Rate
Government employees make up just 12.5% of total payrolls, and state and local governments should be less affected by DOGE than the federal government.
As long as the unemployment rate remains in the 4.0%-4.5% range that we expect—which is likely now that immigration has slowed substantially—consumers will continue to spend apace.
Last Monday on CNBC, JP Morgan CEO Jamie Dimon, long bearish on consumer spending, said he now sees consumers as nearly “back to normal”: “[T]hey don’t have all the extra money, but they have jobs. Wages are going up. …So you are starting to see what I put at normal. Credit costs have normalized. So it’s just almost back to what I call a normal environment.”
Dimon was among the most worried about the consumer throughout 2022 and 2023. As he suggests, real wages are rising.
▌View Related Live Charts: US - Hourly Wage Growth by Work Type
We expect rising productivity growth to keep that train on track.
(7) Uncertainty abounds.
Certainty is good for business. The outlook has gotten more uncertain over the past few months.
But we do not expect this uncertainty to persist. While the S&P Global NM-PMI contracted slightly this month, it tends to be more volatile than the ISM NM-PMI.
▌View Related Live Charts: US - ISM Services Index
Redbook retail sales are still up 5.9% y/y.
▌View Related Live Charts: US - Retail Sales
And based on regional Fed manufacturing surveys, we expect the ISM M-PMI to post a second straight month above 50.0, indicative of expansion.
▌View Related Live Charts: US - ISM Manufacturing PMI
Last month marked the index’s first foray into expansion territory since the Fed started tightening in early 2022 and suggests the manufacturing sector has finally entered a rolling recovery.
(8) Housing horror show. The housing market has been a mess for several years, if not since the turn of the century. With overall construction employment around record highs, several observers have insinuated that the economy is entering a cyclical slowdown as housing permits and starts fall.
▌View Related Live Charts: US - Nonfarm Payrolls - Construction (Monthly Change)
▌View Related Live Charts: US - Housing Starts vs. Building Permits
But as Austin, Texas shows us (see this recent Bloomberg story), deregulation is the answer to high home prices. We believe Trump 2.0 will tackle this on a national level, stimulating more housing starts and permits and thereby keeping employment elevated.
Meanwhile, the supply of construction employment has fallen with decreased immigration, so employers are likely to hold onto their workers. And though many in construction are working on nonresidential buildings, it’s notable that roughly half of residential construction employment is remodelers.
That suggests that construction employment is relatively shielded from any potential housing slowdown, and that construction skills are transferable across different types of projects.
(9) Winning with the wealth effect
The excess-savings-depleting story that led to a lot of worry about the economic outlook over the past couple years was a nonstarter, in our opinion, mostly because retiring Baby Boomers were sitting on huge nest eggs that continued to appreciate. Between near-record stock prices and high home prices, the Baby Boomers now hold roughly $83 trillion of the $160 trillion in US household wealth.
So we haven’t been worried about the relatively low personal savings rate; in fact, we think it may fall into negative territory by the end of the decade.
Could the wealth effect reverse? A bear market in stocks and much lower home prices likely would lead consumers and businesses to pull back some of their spending. But that would be likely only in a recession, which we see as improbable at the moment. If a recession were to become more likely, automatic stabilizers and the ease-first-ask-questions-later Fed would quickly restimulate markets and the economy. Both a recession and a fiscal crisis are in our 20%-probability what-could-go-wrong bucket of economic scenarios. We still apply an 80% subjective probability to outcomes that are bullish for US stocks.
Big Tech earnings week is here! Stay ahead with MacroMicro’s Economic Calendar — track CPI, GDP, and key earnings like Apple & Google all in one place. Check it out »