MACRO CONDITIONS · CYCLE DYNAMICS
What the Indicators Are Telling Us
October's selloff came in two waves, and in both the market was repricing the cost of money rather than any break in demand. The first wave hit in mid-month, when September CPI rose to 3.7% and PPI to 6.4% just as CoreWeave's five-year CDS spread pushed past 1,100bp. Reports that Anthropic's quarterly growth had slowed to about 45% then sent the Philadelphia Semiconductor Index down for eight straight sessions, its longest losing streak since 2008.
The second wave arrived at month-end with hyperscaler earnings, when Alphabet fell 12.6% on October 29, the largest one-day drop in its history, and Amazon slid about 11% after hours. Both had reported strong cloud growth, so investors were reacting to cash flow instead: Alphabet's trailing free cash flow fell 73%, and Amazon's turned negative by $42.4B.
Bonds moved the other way. After peaking near 5.3% in early October, its highest level since 2007, the US 10-year closed at 4.89% on November 2, a seven-week low. The Fed held at 3.75%-4.00% and the ECB at 2.50%, and a 7.6% fall in Brent futures on November 2 on signs of US-Iran talks eased the inflation outlook further. Global borrowing costs remain close to the cycle high, though, with MM's GDP-weighted global 10-year yield at 5.20% on October 29, only 12bp below its September peak and 68bp above where it began the year. Companies, meanwhile, have rarely sounded better: MM's AI-based S&P 500 Earnings Call Optimism Index reached its historical maximum in the early Q3 calls.
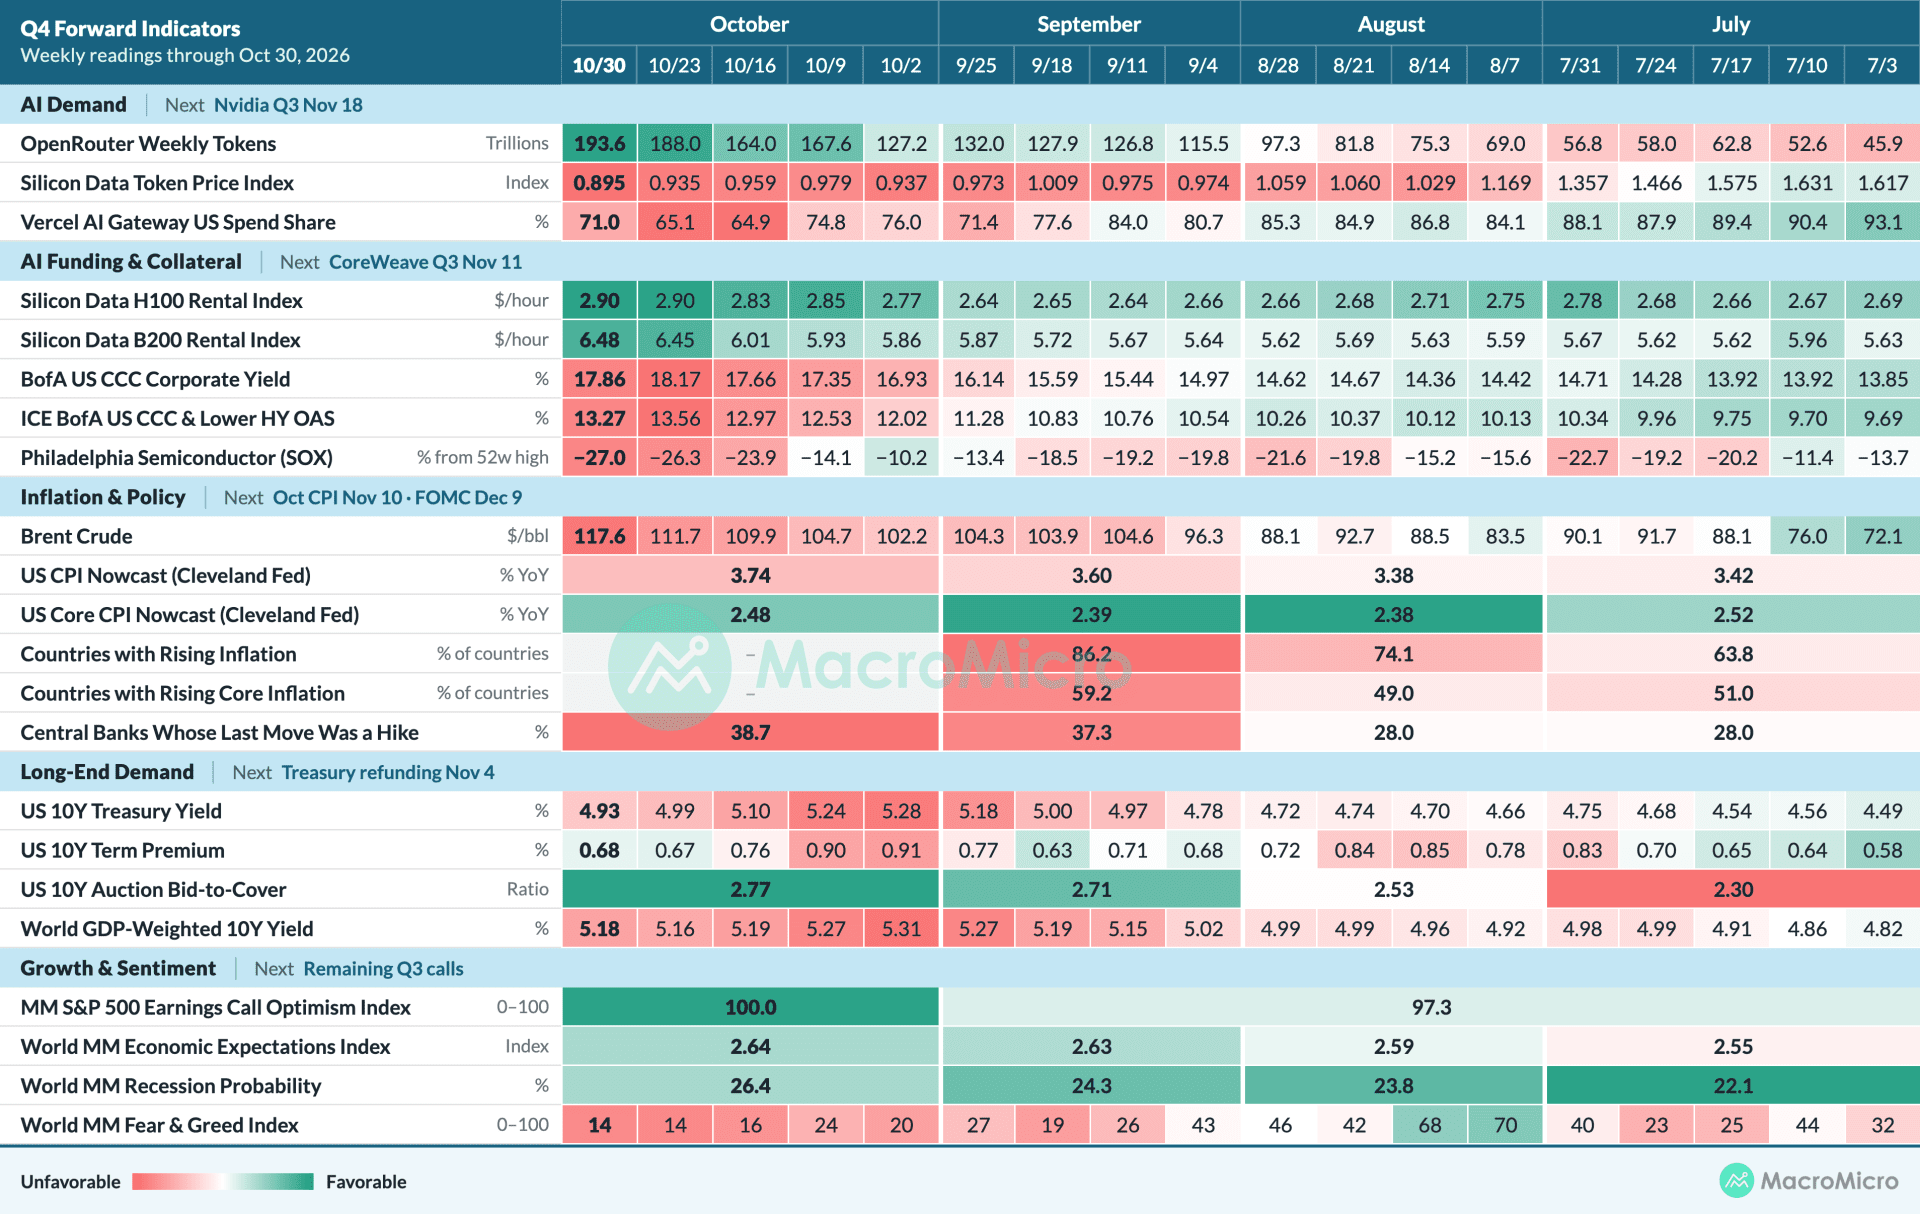
Our view is that October repriced how the AI buildout is financed while expectations for what it will sell held steady. That case rests on three links, each building on the last, and each carries indicators that will confirm or break it before year-end. The first is AI demand: usage is still compounding, so the question for the quarter is whether volume keeps outgrowing the fall in per-token prices, and whether GPU rents keep supporting the borrowers who carry the buildout. The second is the long end, where yields rose on inflation, supply and France and fell once buyers returned at 5%; auction demand, the term premium and the next two CPI prints will decide whether that level holds as a floor for buyers. The third is the companies paying both the AI bill and the interest bill. Were they preparing for a downturn, their earnings calls would show it, and so far those calls describe a cost problem with steady demand. This month's The Evidentiary connects all these dots.
Key Questions
- AI Demand: Does token volume keep outgrowing the fall in per-token prices, and do GPU rents keep supporting the borrowers?
- The Long End: Do auction demand, the term premium and the next two CPI prints hold 5% as a floor for buyers?
- Corporate Demand: Do earnings calls keep describing a cost problem with steady demand, or start describing a downturn?
01AI Usage Is Still Compounding; the Strain Sits in Pricing & in Leveraged Compute
The two doubts about AI that drove October, one about demand and one about funding, call for different evidence, and the demand side shows up in usage, which is still compounding. What changed in the third quarter was price, as US labs cut token prices to compete with Chinese open-weight models that are nearly as capable and far cheaper. When usage rises while prices fall, profit shifts from the model sellers to the owners of the chips, and the strain lands on the companies that borrowed to rent out compute. Construction delays add to that strain by pushing revenue further behind capex. That is how CoreWeave's credit could crack in October in the same weeks that upstream suppliers posted record margins and hyperscaler cloud revenue accelerated. Gateway token volume and what businesses actually pay per token measure the first problem; GPU rental indices and neocloud credit spreads measure the second.
Token Usage Kept Growing Through the Selloff
Token throughput on developer gateways is the most timely read on AI demand available, and it shows no slowdown. Weekly volume on OpenRouter rose from about 5.6 trillion tokens in early January to 193.6 trillion in the week to November 1, roughly a 35-fold increase in ten months, and it kept climbing through the weeks when the SOX was falling. The large platforms describe the same trend: Alphabet said its first-party model API now handles...
Already a subscriber? Click here to log in.
Full Access to Our Services

Comprehensive data at your service
with key indicators for investment insights

Exclusive flash reports
on key events and data

Create your own charts and analysis
including performance backtesting

Hub of professionals to engage
in meaningful discussions and insights
 Get answers from MM AI.
-
How did October's market selloff reflect shifts in the cost of money versus demand for AI?
💡October's market selloff reflected a repricing of the cost of money rather than a break in demand, occurring in two waves. The first wave hit mid-month after September CPI rose to 3.7% and PPI to 6.4%, with CoreWeave's five-year CDS spread exceeding 1,100bp, and reports of Anthropic's quarterly growth slowing to 45%. The second wave at month-end, following hyperscaler earnings, saw investors reacting to cash flow, as Alphabet's trailing free cash flow fell 73% and Amazon's turned negative by $42.4B, despite strong cloud growth. This indicates a shift in focus to financing costs and cash flow rather than underlying AI demand.
-
How has the US 10-year yield changed since early October, and what factors influenced this movement?
💡The US 10-year yield has fallen more than 40bp from its early-October peak, closing at 4.89% on November 2, its lowest level since 2007. This movement was influenced by demand-side factors, as yields near 5% drew buyers back into the market, the term premium eased from its highs, and money rotated from AI stocks into Treasuries. Earlier in the year, global 10-year yields, including the US, had climbed due to broader inflation pushing central banks to hike rates, heavier government and AI company borrowing amidst central bank balance sheet reductions, and a political premium in France.
-
How is AI demand evolving, considering token volume growth and falling per-token prices?
💡AI demand is evolving with token usage still compounding, even as per-token prices fall due to competition. Weekly token volume on OpenRouter rose 35-fold in ten months, from 5.6 trillion in early January to 193.6 trillion by November 1, showing no slowdown. However, US labs are cutting prices significantly; Anthropic's average price per million tokens fell from $2.45 to $0.47, and OpenAI's to $0.44, mainly due to competition from cheaper, nearly as capable Chinese open-weight models. This dynamic shifts profit from model sellers to chip owners, with revenue now heavily dependent on how much usage comes at lower prices, while overall demand continues to grow.
-
How are Chinese open-weight AI models impacting token prices and competition for US labs like Anthropic and OpenAI?
💡Chinese open-weight AI models are significantly impacting token prices and competition for US labs like Anthropic and OpenAI by driving prices down. Chinese models, such as Moonshot's Kimi K3.1 Pro, are nearly as capable as US frontier models for most workloads but offer API prices 33% below competitors. US labs have responded by cutting prices; Anthropic's average price per million tokens fell from $2.45 to $0.47, and OpenAI's to $0.44. This price war has shifted profit towards chip owners and intensified competition, with customer movement between platforms based on price, although US labs retain revenue from premium workloads where their capability lead still commands higher prices.
-
How do data center construction delays impact hyperscaler free cash flow and revenue timelines?
💡Data center construction delays significantly impact hyperscaler free cash flow and revenue timelines by pushing revenue further behind capital expenditure. Microsoft's capex, for instance, came in below consensus due to late delivery of third-party capacity, expecting only 30% of its cloud backlog to become revenue within 12 months. Contract terms have also worsened for builders, with late delivery penalties rising to over $5M a day. This timing mismatch, coupled with spending over $200B on capex this year, caused Alphabet's trailing free cash flow to fall 73% and Amazon's to turn negative by $42.4B, despite strong cloud growth, leading investors to mark down their stock values.
-
What role do rising GPU rental rates play in containing credit stress for neocloud companies like CoreWeave?
💡Rising GPU rental rates play a crucial role in containing credit stress for neocloud companies like CoreWeave because the chips serve as collateral. The H100 rental index rose from $2.20 an hour to $2.89, and the B200 index from $4.40 to $6.60, with A100 rents also increasing. As long as rents continue to rise, borrowers who face construction delays can re-lease capacity at higher rates, and lenders can value the chips above book. This helps to maintain collateral values and lease income, preventing stress from spreading from specific leveraged borrowers, like CoreWeave with its CDS above 1,100bp, to the entire AI credit market.
-
How widespread is inflation globally, and what actions have central banks taken in response?
💡Inflation is currently widespread globally, with MacroMicro's measure indicating that both headline and core inflation are running above their 12-month averages in 86% of countries in September, up from 64% in July. OECD core inflation has climbed to 3.6%. In response, almost all major central banks have taken action to ease, with the Fed holding rates at 3.75%-4.00% after a September hike, the ECB taking its deposit rate to 2.50%, the BOJ raising its policy rate to 1.25%, and the Bank of Canada hiking rates on October 28, reflecting a broad return to tightening cycles.
-
Why did France's 10-year OAT yield rise above Italy's, and what was the impact of Moody's rating decision?
💡France's 10-year OAT yield rose above Italy's, despite France's higher credit rating, due to a domestic crisis including strikes and protests against a €54B austerity package, which pulled October's composite PMI down to 48.4. This widened its spread over Bunds to about 170bp, the most since 2011. Moody's decision on October 23 to keep France at Aa3 with a negative outlook brought the spread back toward 155bp. This indicates investors were pricing in political paralysis and the upcoming 2027 presidential election, though the premium has largely remained confined to France.
-
What does strong auction demand for 10-year US Treasuries at 5% indicate about investor sentiment?
💡Strong auction demand for 10-year US Treasuries at 5% indicates that investors decided this yield level was attractive, stopping the rise in yields. The October 10-year Treasury auction drew a bid-to-cover of 2.77, the strongest since 2014, and demand held across other maturities as well. This suggests that the worst of the selling has passed and buyers are re-entering the market at these yields, with private investors now acting as the main marginal buyers, willing to purchase when yields are at 5% and when equities weaken.
-
What do Q3 earnings calls reveal about management concerns regarding costs versus demand?
💡Q3 earnings calls reveal that managements are primarily concerned about costs rather than demand. Inflation mentions rose to 2.8 per company from 1.9 in Q2, and interest-rate mentions more than tripled to 1.4, indicating companies are treating higher costs and rates as a planning problem, though their concern is less than half the 2022 peak. In contrast, demand-related words like recession and layoff mentions remain near their lows, aligning with macro data showing 3.4% GDP growth in Q3. This suggests an economy facing a cost problem with steady demand, favoring equities over long bonds.
