Global equities were mixed last week as AI financing worries and an oil spike drove a volatile tape. The S&P 500 fell 0.5% and the Nasdaq 0.7%, while the Dow gained 0.4% for a third straight weekly advance. The Philadelphia Semiconductor Index (SOX) fell eight straight sessions, its longest streak since 2008, and sank more than 15% from its October 6 high at one point. The 10-year Treasury yield eased back toward 5.00% as safe-haven flows emerged, Brent climbed about 6% to above $116 on Middle East supply risks, and gold fell roughly 4% to test $4,000. Three concerns compounded the tech sell-off: hot September inflation prints, CoreWeave's funding stress, and a slowdown in Anthropic's revenue growth.
This week's WEFC covers three topics: why the AI credit scare looks company-specific while upstream fundamentals hold, how TSMC's capacity shortages and margin dilution shape the next bottleneck, and what Meta's and Tesla's earnings say about who is monetizing AI now and who is betting on 2027 and beyond.
This Week's WEFC Preview
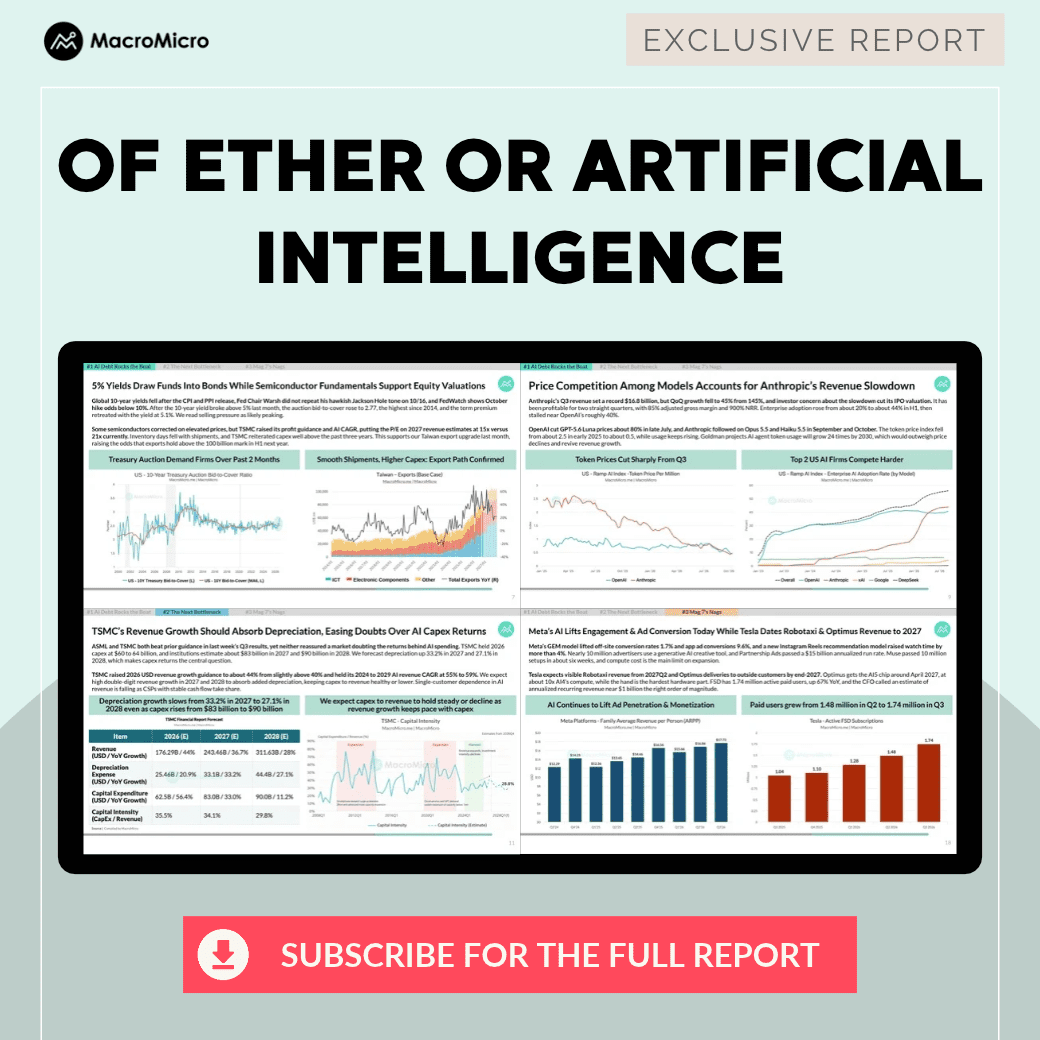
AI's Market Shakeout: Credit Stress Rises, but Fundamentals Hold
- Three shocks triggered the semiconductor sell-off. September CPI and PPI rose to 3.7% and 6.4% YoY, CoreWeave's CDS implied a default probability above 60%, and Anthropic's QoQ revenue growth slowed to 45% from 145%. The SOX is now at its quarterly moving average, and we see the longer-term AI trend as unchanged.
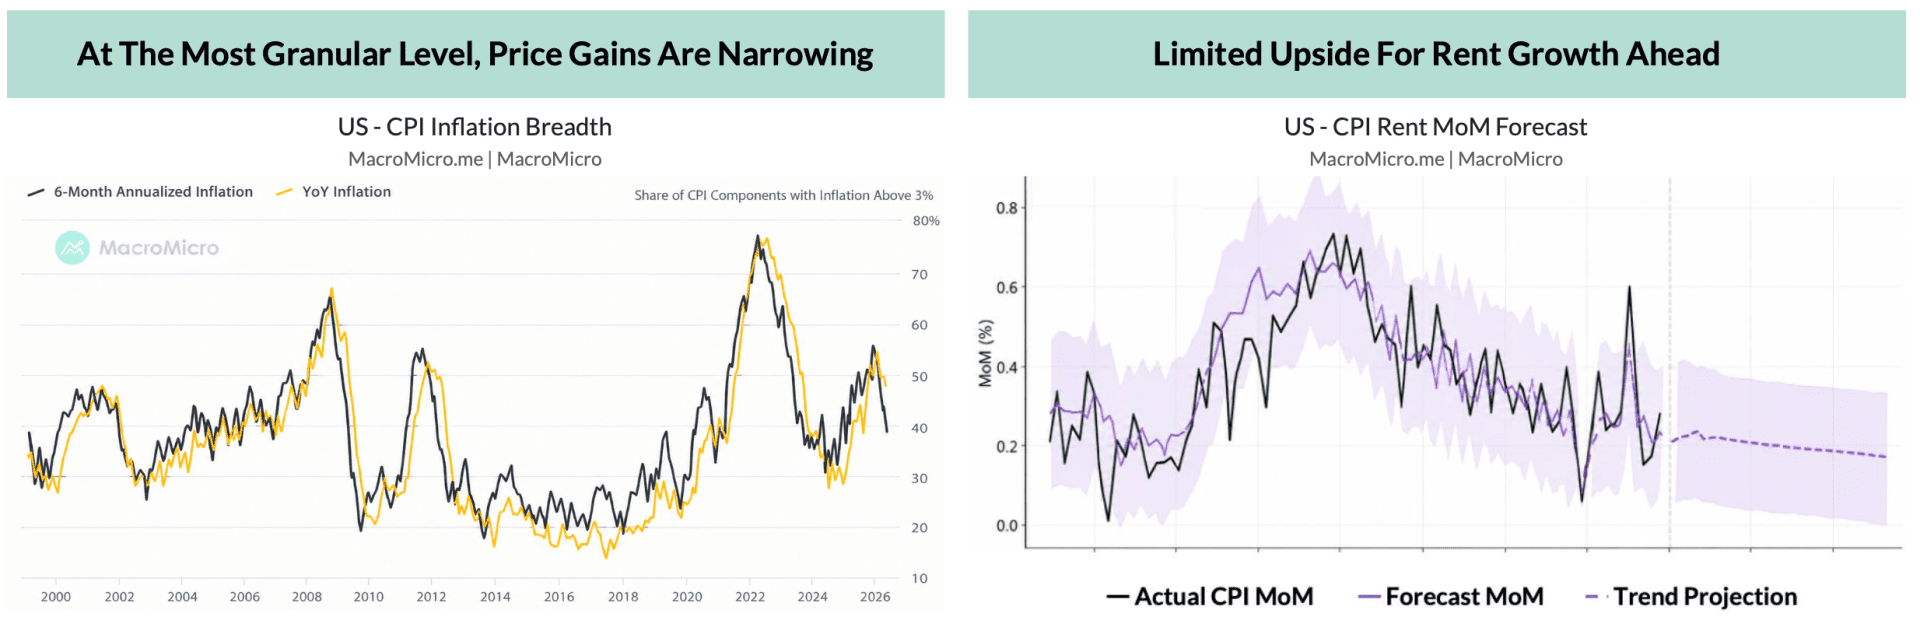
- Inflation breadth is cooling, so we keep Q4 as the peak. The share of CPI items with YoY gains above 3% fell to 48% from 51%. Rent drove September's core overshoot, but rising vacancies and restrained home prices limit follow-through.
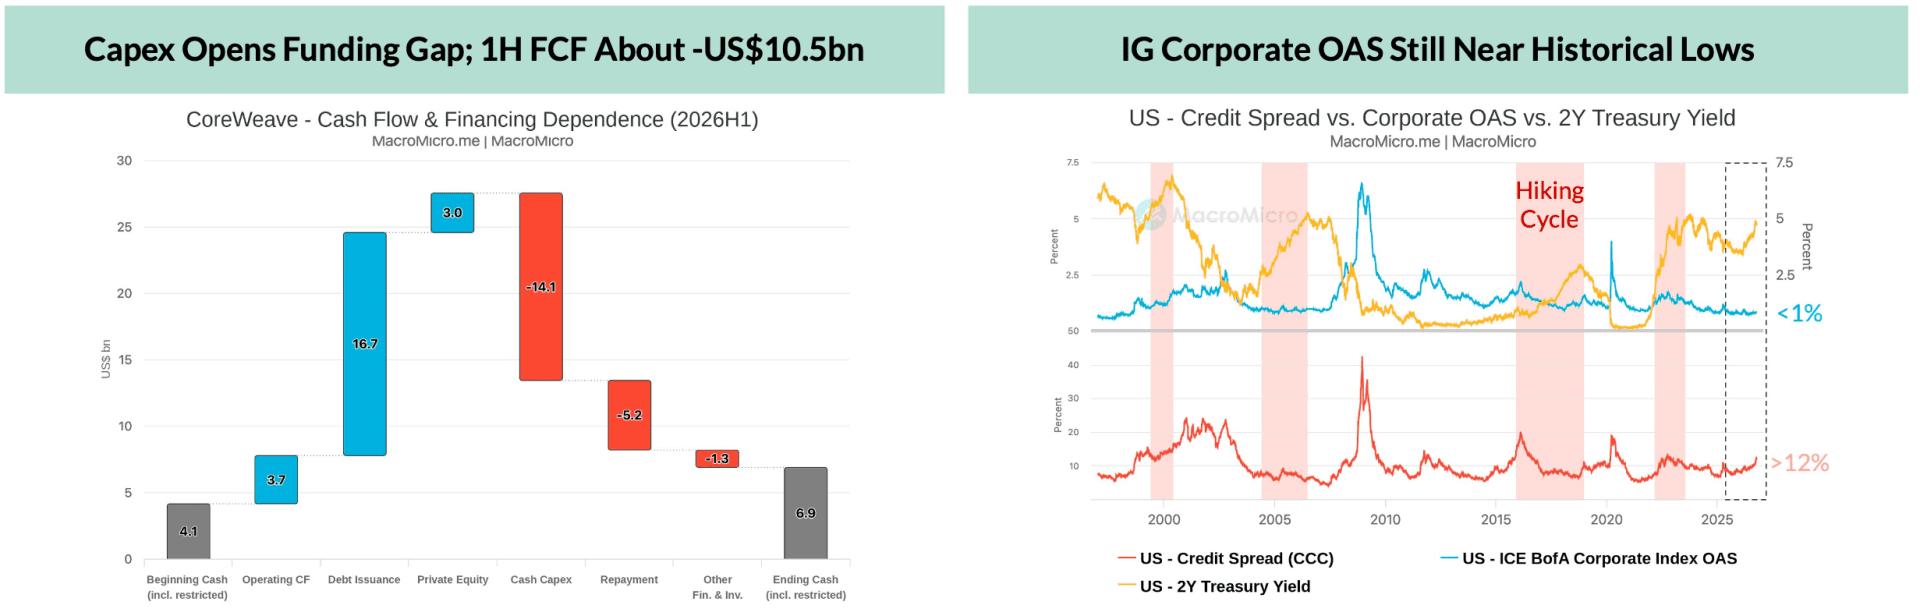
- CoreWeave's stress looks company-specific. H1 operating cash flow of $3.66 billion against $14.1 billion of capex required $11.53 billion of net borrowing. Spreads on the 24 US high-yield data center bonds outside CoreWeave are stable, and the investment-grade OAS stays near 0.8%.
- Anthropic's slowdown reflects price competition, not weaker demand. Q3 revenue set a record $16.8 billion, and the token price index fell from about 2.5 to about 0.5. Strong 10-year auction demand, with bid-to-cover at 2.77, the highest since 2014, suggests bond selling pressure is peaking.
▌Related Charts & Articles: Global - MSCI Stock USD Indices Weekly Performance · US - PHLX Semiconductor Sector Index (SOX) · US - Cleveland Fed Inflation CPI · US - CPI Rent vs. Zillow Rent (YoY) · US - 10Y Treasury Bid-to-Cover Ratio · US - Credit Spread · US - Ramp AI Index - Token Price Per Million · US - Ramp AI Index - Enterprise AI Adoption Rate (by Model) · AI Supply Chain - Industry Intelligence Hub
AI's Next Bottleneck: Rising Capex, Constrained Supply & Expanding Earnings
- TSMC's revenue growth should absorb rising depreciation. TSMC raised its 2026 USD revenue growth guidance to about 44% and held its 2024 to 2029 AI revenue CAGR at 55% to 59%. We forecast depreciation up 33.2% in 2027 and 27.1% in 2028, while capital intensity falls from 35.5% to 29.8% by 2028.
- N2/N3 and advanced packaging shortages spread orders. TSMC is adding a fourth N3 fab in Tainan and converting its second Kumamoto fab to 3nm. Implied CoWoS utilization runs at 94% to 95%, and we forecast earnings growth of...
Already a subscriber? Click here to log in.
Full Access to Our Services

Comprehensive data at your service
with key indicators for investment insights

Exclusive flash reports
on key events and data

Create your own charts and analysis
including performance backtesting

Hub of professionals to engage
in meaningful discussions and insights

