Executive Summary:
Today, Ed and Elias take a deep dive into core inflation, i.e., minus volatile food and energy prices. The Fed’s preferred measure, the core PCED, justifies tightening monetary policy—both the recent September rate hike and presumably future ones provided that underlying inflation remains elevated. … The alternative measure, the core CPI, is structured differently, causing it to diverge from the core PCED in response to price changes in AI-related spending, financial services, and shelter. … The US economy should remain resilient during this tightening cycle, as GDP growth has become increasingly desensitized to interest rates. That’s one reason the recession widely expected in 2022 and 2023 never happened. … Also: Check out our chart collection.
Inflation I: Why the Core PCED Matters
The Fed’s 2.0% y/y inflation target is defined in terms of the headline PCED, while the core PCED is its preferred gauge of underlying inflation. Since it strips out volatile food and energy prices, the core PCED is especially useful for assessing whether underlying price pressures are persistent enough to require tighter monetary policy.
New York Fed President John Williams has offered a useful rule of thumb: Core PCED inflation averaging no more than 0.2% m/m would suggest that the federal funds rate (FFR) is “well positioned.” Sustained readings above that pace would imply more persistent inflation and strengthen the case for additional hikes.
That framework played a role in Fed officials’ thinking when the FOMC hiked the FFR by 25bps in September. Although August’s PCED report was not yet available, the components of the August Consumer Price Index (CPI) and Producer Price Index (PPI), which feed into core PCED inflation, pointed to a monthly increase above Williams’ 0.2% threshold. The Cleveland Fed had estimated that the core PCED rose 0.27% m/m in August, or 3.4% y/y—strong enough to support the rate hike and to suggest the likelihood of further tightening if monthly readings stay persistently above roughly 0.2%.
Inflation II: Underlying Inflation Measures Aren’t Built Alike
While components of the core CPI feed into the core PCED, the two don’t tell the same stories about underlying inflation. Indeed, the core PCED is now running well above the core CPI, producing the most negative spread between the two measures since the early 1980s.
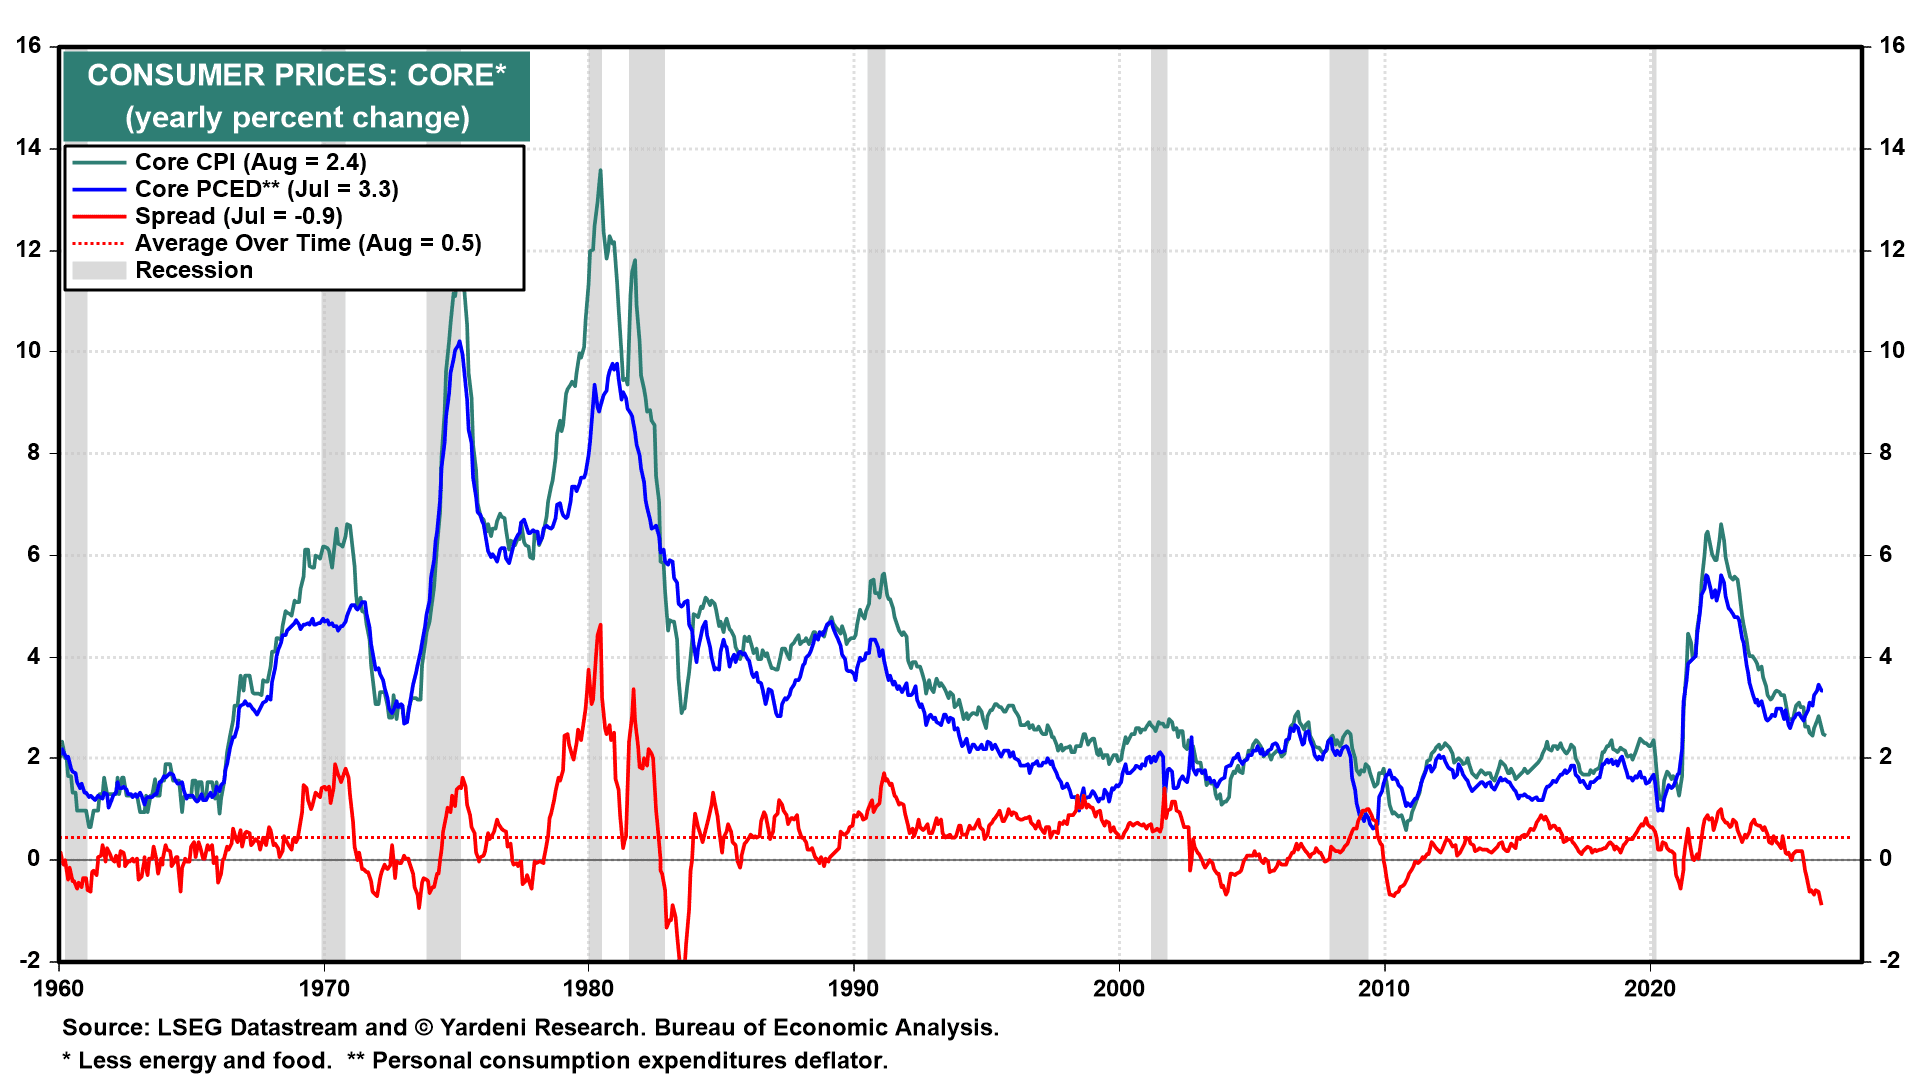 ▌View Related Live Charts: US - PCE Price Index (Annualized Percent Change)
Historically, the opposite has been true—they moved in lockstep, and the core CPI was the higher of the two.
Why the change all of a sudden? It’s partly due to three longstanding differences in...
Already a subscriber? Click here to log in.
Full Access to Our Services

Comprehensive data at your service
with key indicators for investment insights

Exclusive flash reports
on key events and data

Create your own charts and analysis
including performance backtesting

Hub of professionals to engage
in meaningful discussions and insights
 Get answers from MM AI.
-
Why does the Federal Reserve prefer the core PCED over the core CPI for assessing underlying inflation?
💡The Federal Reserve prefers the core PCED for assessing underlying inflation because it encompasses a broader range of household consumption and more quickly captures consumer substitution to lower-priced alternatives. Unlike the core CPI, which primarily measures consumers' out-of-pocket purchases, the core PCED also includes goods and services bought on behalf of households by employers and government programs. This broader scope and its chain-weighted Fisher-Ideal index calculation method make it a more comprehensive and responsive gauge of persistent price pressures, informing the Fed's monetary policy decisions, such as the September rate hike.
-
What core PCED inflation rate suggests the federal funds rate is 'well positioned' according to the New York Fed?
💡A core PCED inflation rate averaging no more than 0.2% month-over-month (m/m) suggests the federal funds rate (FFR) is 'well positioned,' according to New York Fed President John Williams. Sustained readings above this threshold imply more persistent inflation and strengthen the case for additional rate hikes. For instance, the Cleveland Fed estimated the core PCED rose 0.27% m/m in August, or 3.4% year-over-year (y/y), which supported the September 25bps FFR hike and indicated a likelihood of further tightening if monthly readings remain above roughly 0.2%.
-
What key differences exist in the construction of the core CPI and core PCED inflation measures?
💡Key differences in the construction of core CPI and core PCED inflation measures include varying weights for categories, scope of spending, and calculation methods. Shelter, for example, accounts for approximately 36% of the CPI but only about 16% of the PCED, while the PCED places more weight on healthcare and financial services. The PCED also includes goods and services purchased by employers and government programs on behalf of households, unlike the CPI's focus on out-of-pocket consumer purchases. Furthermore, the CPI uses a modified Laspeyres index, whereas the PCED employs a chain-weighted Fisher-Ideal index that captures consumer substitution faster.
-
Why has the spread between core CPI and core PCED inflation widened significantly recently?
💡The spread between core CPI and core PCED inflation has widened significantly recently, resulting in the most negative spread since the early 1980s, primarily due to AI-related spending, financial services costs, and shelter dynamics. Software and related technology, which surged 25.4% year-over-year in August, carry more weight in the PCED. Financial services, including portfolio-management fees, also have a greater impact on the PCED due to rising equity prices. Conversely, shelter's heavier weighting in the CPI means cooling rent inflation has pulled the core CPI down more sharply than the core PCED.
-
How does AI-related spending influence the divergence between core PCED and core CPI inflation?
💡AI-related spending significantly influences the divergence between core PCED and core CPI inflation because software and related technology categories hold substantially more weight in the core PCED. In August, software inflation surged by 25.4% year-over-year, driven by strong demand linked to AI, cloud computing, and technology investments. This pronounced increase in a heavily weighted PCED category lifts the core PCED much more than the core CPI, contributing to the widening gap between the two inflation measures and indicating persistent upward pressure on the PCED.
-
What methodological changes by the BEA will impact future core PCED inflation calculations?
💡The Bureau of Economic Analysis (BEA) plans several methodological changes impacting future core PCED inflation calculations, beginning with the August PCED report due September 30. These revisions are expected to reduce recent year-over-year core PCED inflation by approximately 0.1-0.3 percentage points. Specifically, they will dampen portfolio-management inflation, reduce software and IT-services inflation, and replace volatile CPI-based estimates for legal services with more stable Producer Price Index (PPI) measures. While these changes should narrow the CPI–PCED gap, they are not anticipated to fundamentally alter the overall inflation narrative, with core PCED inflation likely to remain above 3.0% year-over-year.
-
How resilient is the US economy to interest rate hikes, according to recent data?
💡The US economy demonstrates remarkable resilience to interest rate hikes, as evidenced by recent data indicating robust growth and investment. The Atlanta Fed's GDPNow model estimates 5.0% real GDP growth (saar) in Q3, with real final sales to private domestic purchasers expected to rise 4.8%. Consumer spending is projected to increase 4.2%, and business investment is on track for its strongest three-quarter stretch since 2021. This resilience is partly attributed to the economy becoming increasingly desensitized to interest rates, a factor that prevented the widely anticipated recession in 2022 and 2023.
-
How is the AI buildout contributing to the US economy's capital spending and GDP growth?
💡The AI buildout significantly contributes to the US economy's capital spending and GDP growth, driving record real private nonresidential fixed investment in Q2. High-tech capital spending, encompassing information-technology equipment, software, and R&D, surged 16.7% year-over-year in Q2, now accounting for a record 55.1% of total nominal capital spending. Real investment in information-processing equipment reached approximately $752 billion, software nearly $1 trillion, and R&D about $724 billion in Q2. This boom extends to power and communication structures, accelerating due to increased demand from data centers, further stimulating manufacturing and construction activities and bolstering overall GDP.
-
Why is the US economy considered less interest-rate sensitive than in previous tightening cycles?
💡The US economy is considered less interest-rate sensitive than in previous tightening cycles for several reasons. Firstly, it is now more services-heavy, with services accounting for 61.3% of nominal GDP, making it less reliant on capital-intensive, credit-financed purchases. Secondly, Baby Boomers, who hold substantial net worth ($97.4 trillion in Q2-2026) and relatively little debt, benefit from higher rates on their $9.6 trillion in deposits. Thirdly, many households and corporations have locked in low rates on existing debt. Lastly, strong fiscal deficits (projected 5.8% of GDP in 2026) and the AI investment boom provide substantial counteracting stimulus to monetary restraint.
-
How might a higher neutral interest rate affect the Federal Reserve's monetary policy effectiveness?
💡A higher neutral interest rate would affect the Federal Reserve's monetary policy effectiveness by implying that a given federal funds rate (FFR) is less restrictive than it would have been historically. Strong demand for capital, driven by AI, reshoring, infrastructure spending, and heavy corporate issuance, coupled with structural headwinds to national saving as Baby Boomers retire and immigration slows, may be pushing the economy's neutral rate higher. Consequently, the Fed might need to set the FFR at a higher nominal level to achieve the same degree of monetary tightening and exert the desired impact on inflation and economic activity.

