Executive Summary:
When inflation is driven by supply shocks, there’s less the Fed can do about it. But today’s inflation is not caused totally by supply shocks, won’t simply snap back to the Fed’s target rate when the shocks dispel, and can be influenced by monetary policy. Today, Elias and Ed share their belief that the inflationary environment changed structurally in the years after the pandemic, in ways that make it more difficult for the Fed to achieve its inflation target. Without being able to influence structurally higher goods inflation as much, the Fed will have to lower services inflation by raising the federal funds rate. We think 50 more basis points will do it. Lower oil prices should help to moderate inflation in the near term; productivity should do so in the long run. … Check out our chart collection.
Inflation I: Two Misconceptions
Two widely held misconceptions about the current state of inflation persist: The first misconception is that today’s inflation problem is driven almost entirely by temporary inflation shocks; because monetary policy has no control over these shocks, it can do little to alleviate inflation. The second misconception is that inflation will naturally return to the Federal Reserve’s 2.0% y/y target once these temporary shocks fade. We don’t think inflation will return to target without more Fed rate hikes, though lower oil prices would help in the short run and productivity growth should do so over the long run.
The recently released Consumer Price Index (CPI) and Producer Price Index (PPI) reports for October provide a timely opportunity to challenge both assumptions. Let’s start our discussion with the latest inflation data:
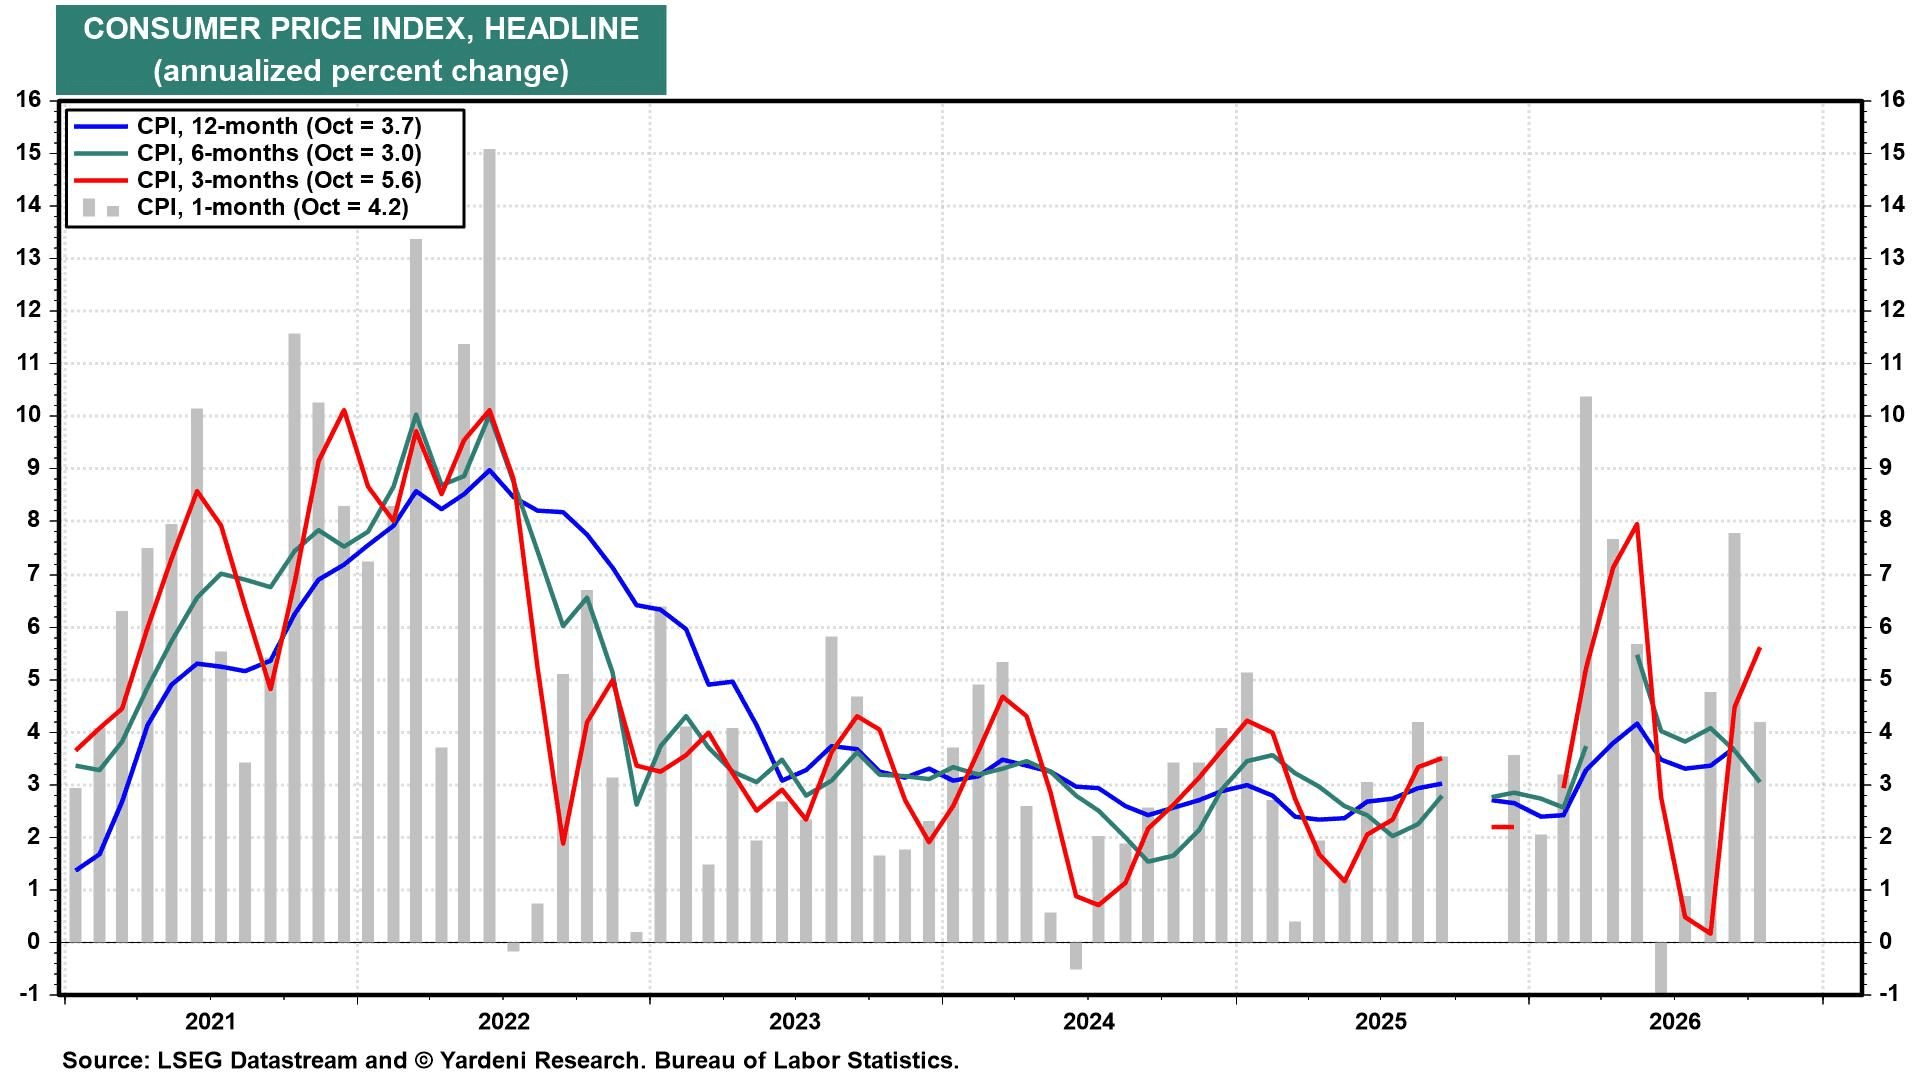
(1) October CPI. The headline CPI rose 0.4% m/m in October, following a 0.6% increase in September.
 ▌View Related Live Charts: US - Consumer Price Index (CPI)
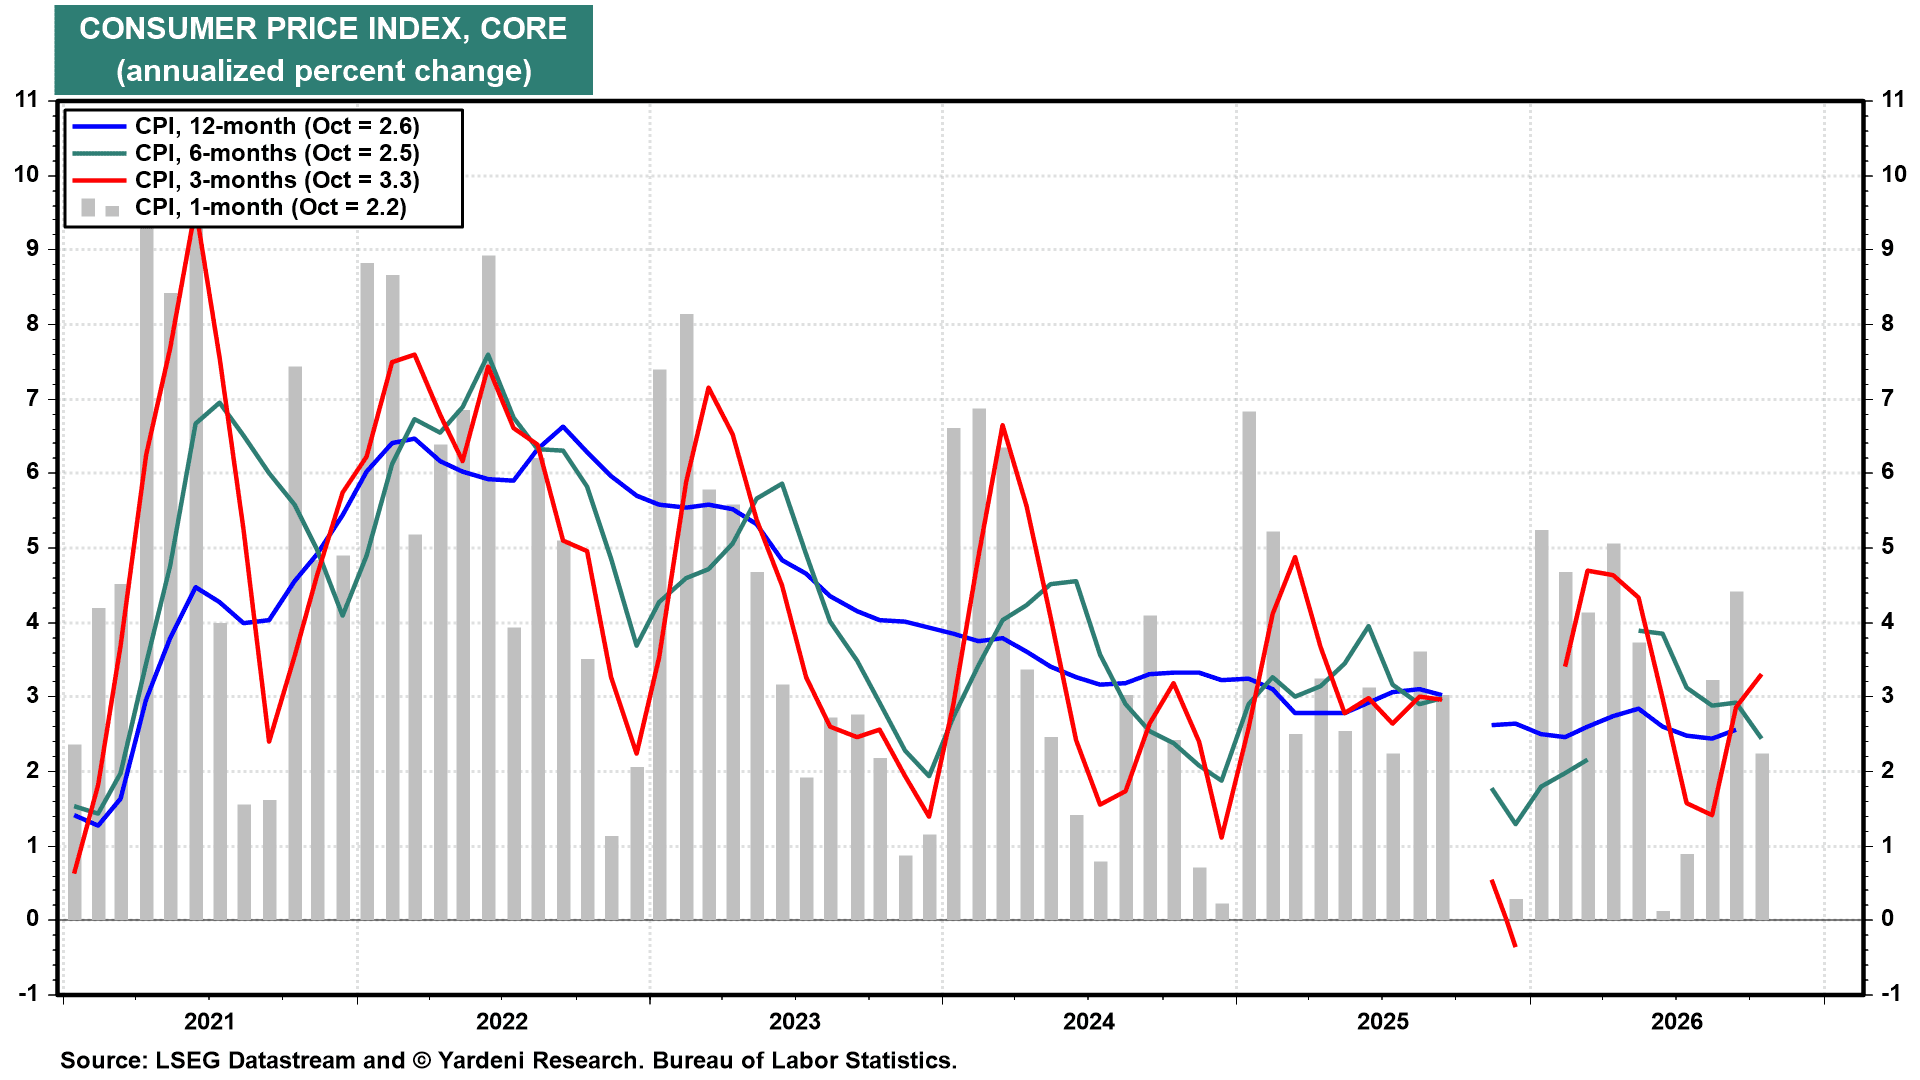
The core CPI, which excludes the volatile food and energy prices, rose by 0.3% m/m for the third consecutive month. That translates into an annualized pace of roughly 3.3% over the past three months, suggesting that underlying inflation remains stubbornly elevated.
 ▌View Related Live Charts: US - CPI (Annualized Percent Change)
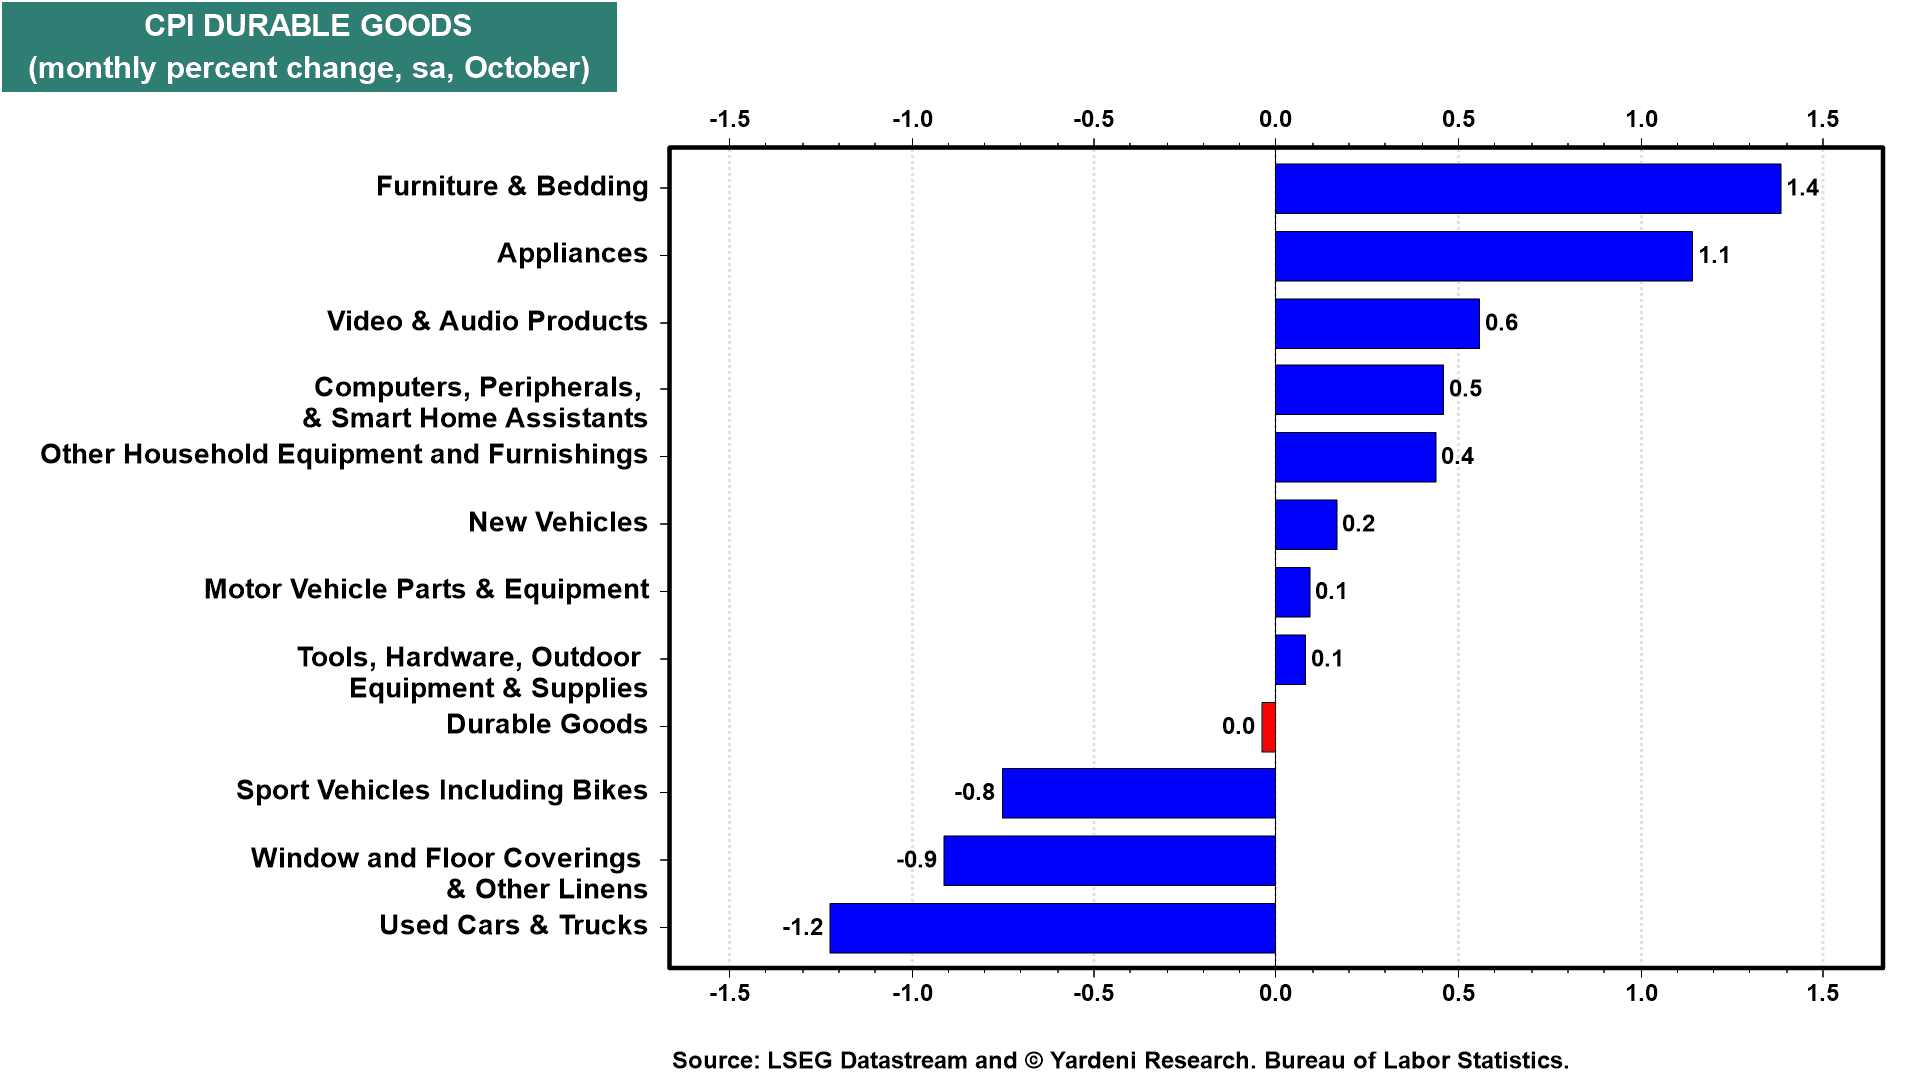
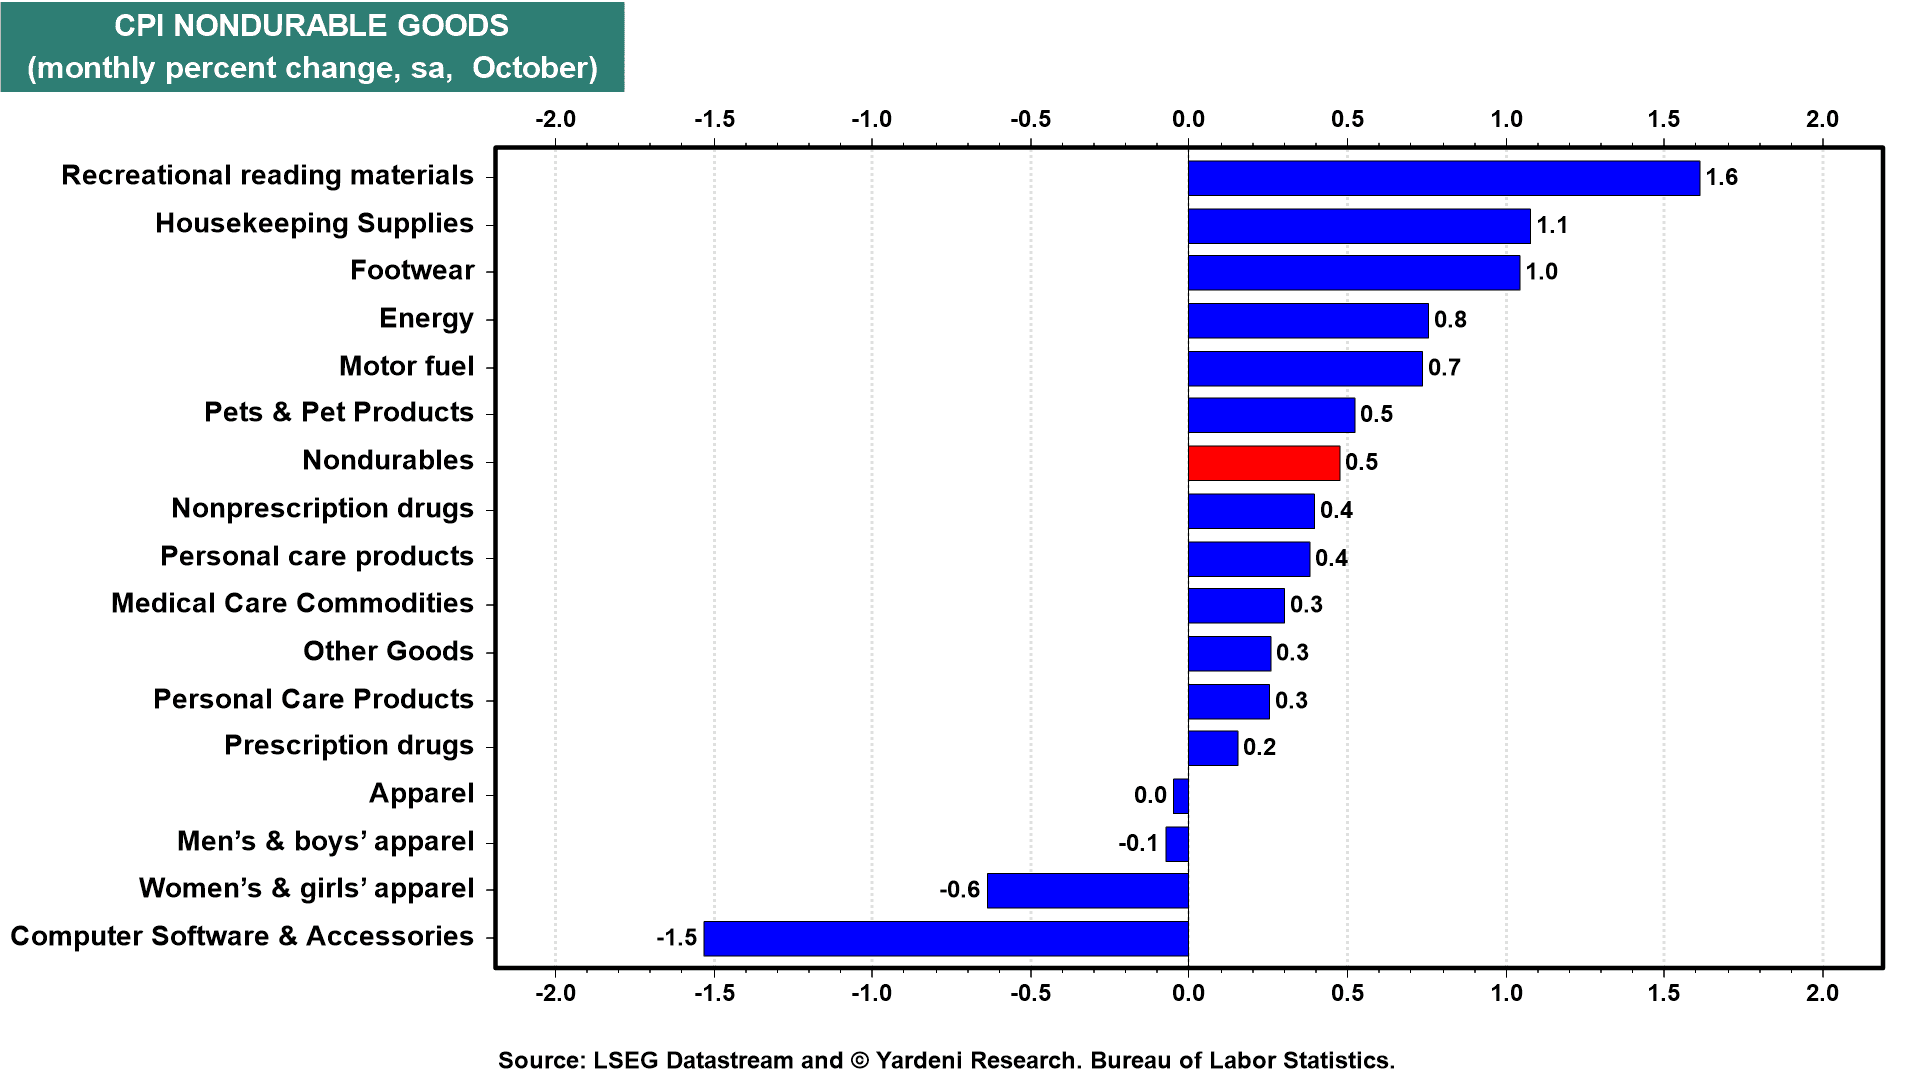
Goods inflation was mixed, with durable goods prices essentially unchanged and nondurable goods prices (including energy) rising 0.5% m/m.
 ▌View Related Live Charts: US - CPI Items (YoY)
 ▌View Related Live Charts: US - CPI Items (YoY)
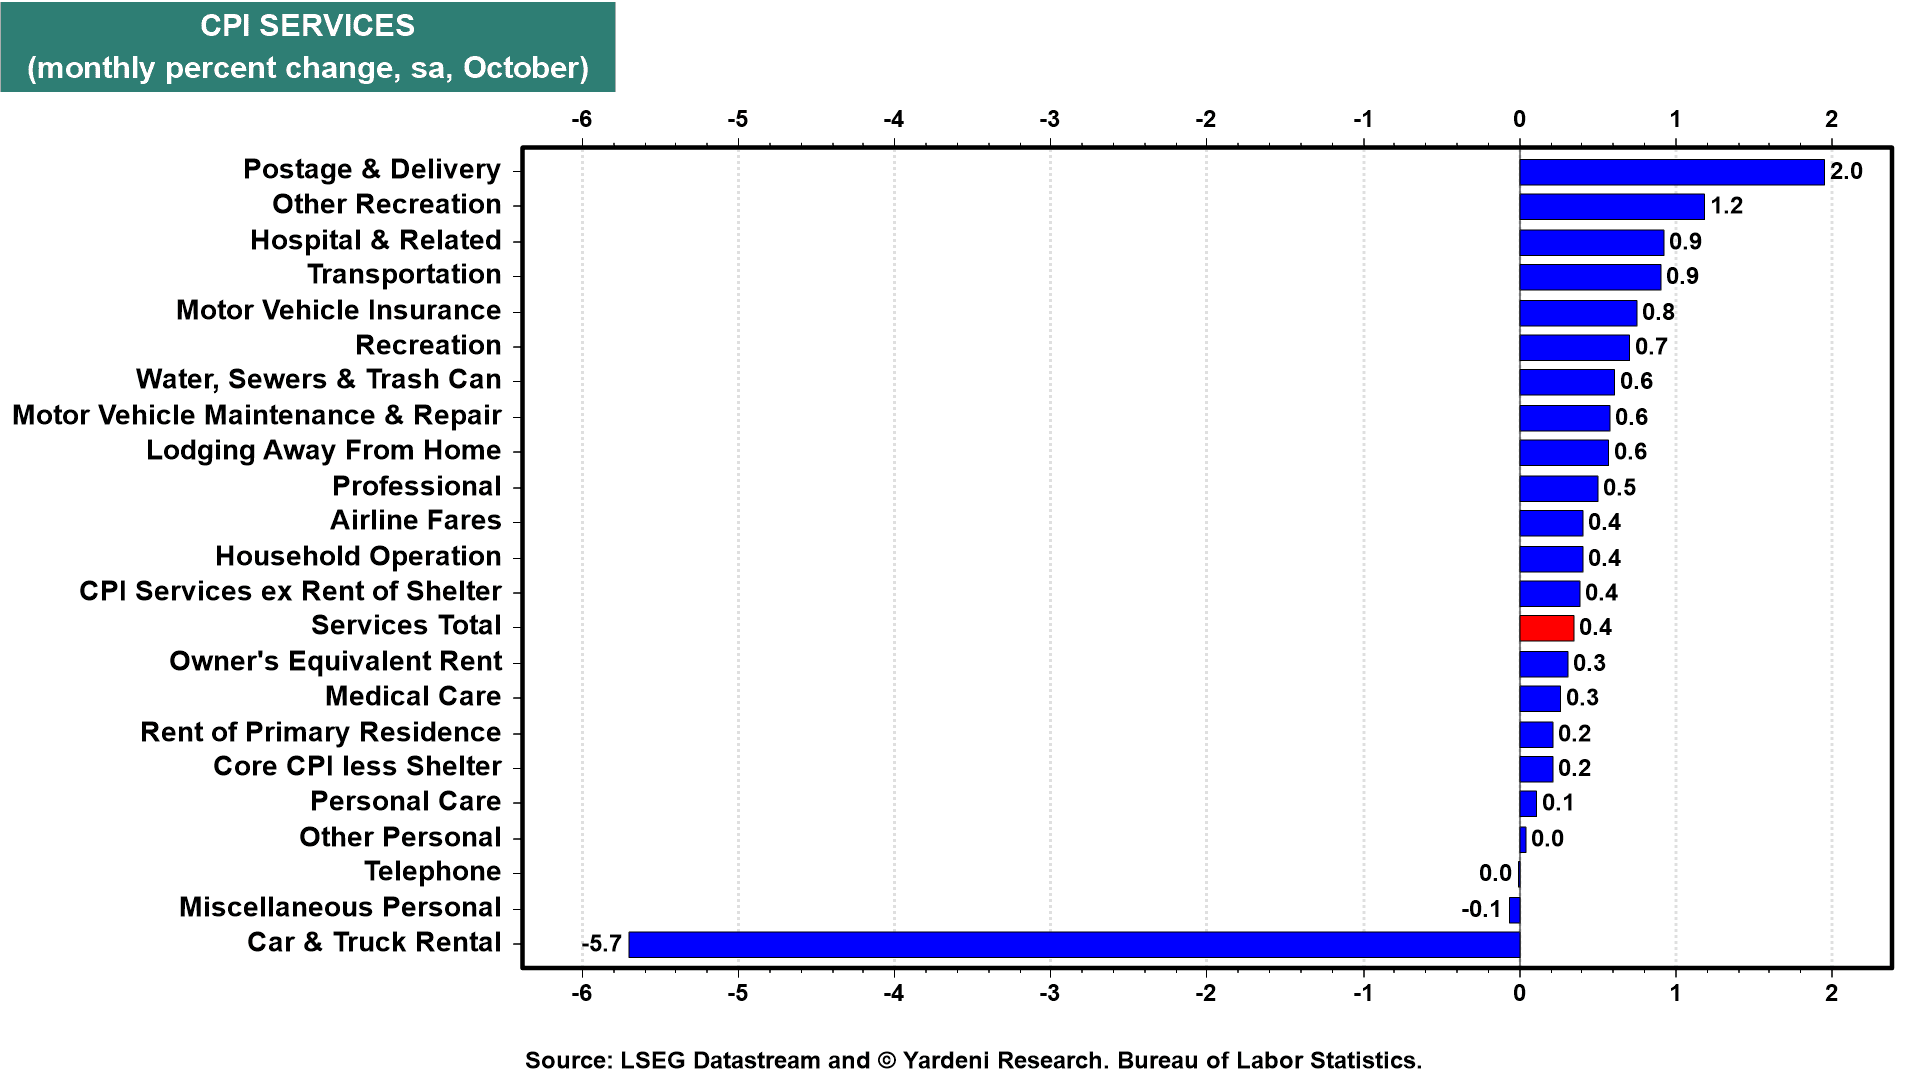
Several categories recorded significant m/m increases: Furniture and bedding prices jumped 1.4%, appliances rose 1.1%, and computers and related equipment advanced 0.5%. Energy prices also climbed by 0.8%, including a 0.7% rise in gasoline prices. Used car and truck prices provided some relief, falling 1.2%. Services inflation rose at a strong 0.4% m/m clip.
 ▌View Related Live Charts: US - CPI Items (YoY)
Transportation services prices increased 0.9% m/m, while shelter inflation rose 0.3%. Other notable increases included...
Already a subscriber? Click here to log in.
Full Access to Our Services

Comprehensive data at your service
with key indicators for investment insights

Exclusive flash reports
on key events and data

Create your own charts and analysis
including performance backtesting

Hub of professionals to engage
in meaningful discussions and insights
 Get answers from MM AI.
-
How do recent CPI and PPI reports challenge current inflation misconceptions for the US market?
💡The October CPI and PPI reports challenge two common inflation misconceptions: first, that current inflation is solely due to temporary supply shocks beyond the Fed's influence, and second, that inflation will naturally revert to the Fed's 2.0% y/y target. These reports indicate persistent price pressures in both goods and services, suggesting underlying demand strength and structural shifts that monetary policy can and must address, especially regarding services inflation, which requires further Fed rate hikes.
-
How do US tariffs and the AI infrastructure buildout contribute to current goods inflation?
💡US tariffs and the AI infrastructure buildout significantly contribute to current goods inflation. The New York Fed estimated tariffs added 2.9 percentage points to annual consumer goods inflation by February 2026. This impact is visible in October's data, with furniture and bedding prices up 1.4% m/m and appliances up 1.1%. The AI buildout has led to a fivefold increase in DRAM prices, causing consumer electronics prices to rise by as much as 20%, with the PPI for electronic components surging 31.8% y/y and CPI for computer software rising 28.4% y/y.
-
Which geopolitical conflicts are currently fueling higher energy prices and goods inflation?
💡The conflicts in the Middle East and Ukraine are currently fueling higher energy prices and goods inflation. These geopolitical events reduce refined product supply, maintain a risk premium in oil prices, and disrupt shipping routes. Consequently, consumer energy prices surged 20.4% y/y in October, including a 37.4% increase in gasoline prices, which directly impacts goods production and transportation costs.
-
How is deglobalization impacting production costs and long-term goods inflation trends?
💡Deglobalization is impacting production costs and long-term goods inflation trends by reversing decades of cost efficiencies. Reshoring, trade restrictions, and national security priorities encourage businesses to shift production away from the lowest-cost suppliers. While these changes enhance supply-chain resilience, they also raise manufacturing expenses, potentially keeping goods inflation elevated even after temporary shocks dissipate and making it more challenging for overall inflation to return to pre-pandemic levels.
-
How does resilient aggregate demand allow businesses to pass on higher costs?
💡Resilient aggregate demand allows businesses to pass on higher costs to customers, maintaining inflationary pressures. Real consumer spending grew 3.8% at a seasonally adjusted annual rate in both Q2 and Q3, significantly above the 2.3% pre-pandemic average. Real final sales to private domestic purchasers, a measure of underlying domestic demand, increased 4.9% in Q3—its strongest pace since Q4-2017. This robust demand provides businesses with strong pricing power, enabling them to absorb and transfer increased expenses.
-
Why is the tight US labor market contributing to sticky services inflation?
💡The tight US labor market is contributing to sticky services inflation due to an acceleration in labor demand coupled with constrained labor supply, keeping labor costs elevated. Payrolls increased by an average of 137,000 per month over the past three months, and job openings rose to 7.5 million in September. Simultaneously, the labor force declined by 0.6% y/y in October, resulting in average hourly earnings rising 3.1% y/y and strengthening the pricing power of labor-intensive service industries.
-
How do elevated energy prices feed into services inflation, particularly transportation costs?
💡Elevated energy prices feed into services inflation, particularly transportation costs, by increasing operating expenses for various service providers. Diesel spot prices remain high due to constrained refining capacity, with the Energy Information Administration expecting these pressures to persist through 2027. This directly impacts airlines, freight carriers, and other transportation services. In October, transportation services rose 0.9% m/m in CPI data, and transportation and warehousing services prices increased 18.5% y/y in PPI data.
-
How has the relationship between goods and services inflation changed post-pandemic?
💡The relationship between goods and services inflation has structurally changed post-pandemic, making it harder to achieve the Fed's 2.0% y/y target. Pre-pandemic (2002-2019), goods inflation averaged 0.4% annually due to globalization, offsetting services inflation which averaged 2.5%, keeping overall PCED inflation at 1.8%. Post-pandemic (2026 data through September), goods PCED inflation averaged 3.2% y/y and services 3.4%, dramatically narrowing the gap and removing the disinflationary offset from goods, requiring services inflation to rise more slowly than before.
-
What role does faster productivity growth play in moderating services inflation?
💡Faster productivity growth, particularly driven by technological innovation like AI, plays a crucial role in moderating services inflation. It allows businesses to increase output without a proportional rise in labor costs, which is especially important for labor-intensive service industries. In Q3, nonfarm business productivity rose 3.5% (saar), leading to a 0.7% decrease in unit labor costs, demonstrating its potential to lower services inflation and help overall PCED inflation return to the Fed's 2.0% target.
-
How will lower oil prices impact near-term inflation and Federal Reserve tightening?
💡Lower oil prices are expected to moderate near-term inflation by reducing energy costs, thereby potentially alleviating some inflationary pressures. This moderation could reduce the necessity for the Federal Reserve to implement additional tightening beyond the anticipated 50 basis points of rate increases. While helpful in the short run, this effect alone is unlikely to fully address the structural inflationary shifts.
[Black Friday Is LIVE] Max AI Annual: 12 months + 2 bonus months. Save 30%+ with full MM AI access, unlimited charts, and 8+ exclusive 2027 outlook reports. Get the Offer