Executive Summary:
The risks to the Fed’s dual mandate are constantly changing. Its attempt to hit its inflation target is complicated by price pressures beyond the control of interest rates, and its attempt to hit on a federal funds rate that neither over-stimulates nor over-restricts economic growth is complicated by the elusive nature of this neutral rate. Today, Elias and Ed examine the forces with bearing on the Fed’s rate decisions since 2022. They also explain why they believe that the neutral federal funds rate has risen over recent years and the implications for monetary policy looking ahead. … Check out our chart collection.
The Fed I: The Search for Neutral
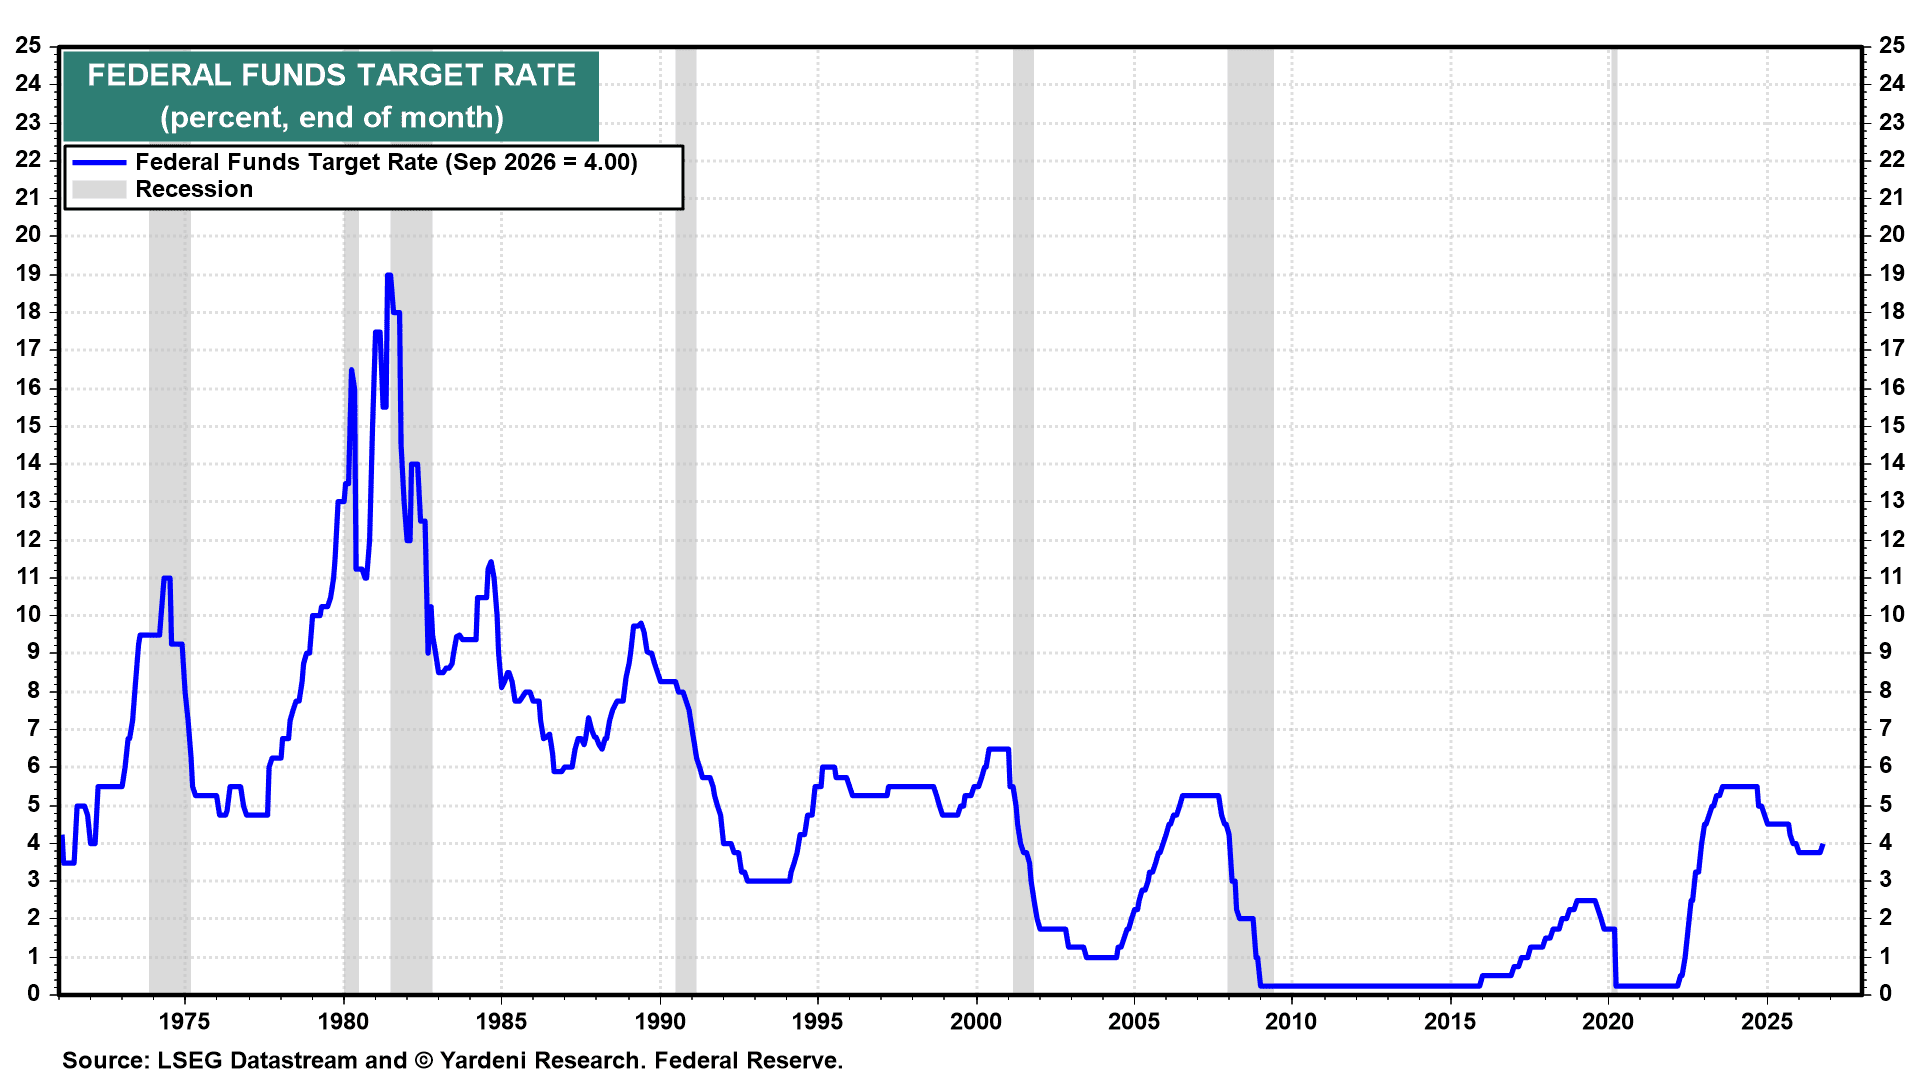
Did the Fed get lost on its way back to neutral? Since early 2022, policymakers have repeatedly adjusted interest rates, first raising them aggressively to bring inflation under control, then holding them steady to assess the economy’s response. As inflation moderated and the labor market cooled, the Fed reversed course, gradually lowering rates in an effort to return monetary policy toward neutral, where interest rates neither stimulate nor restrain economic growth. After pausing again to assess the effects of easing, policymakers now have started raising rates once more.
All this zigzagging reflects the Fed’s attempt to balance its dual mandate of price stability and maximum employment amid changing economic conditions. Complicating matters is that the neutral federal funds rate is elusive. Policymakers cannot observe it directly and can only estimate where it lies by assessing the economy’s response to monetary policy. Moreover, neutral itself can change as economic conditions evolve. Did the Fed ease too much over the past two years because policymakers underestimated how much the neutral rate had risen?
Let’s retrace the Fed’s steps and examine how the balance of risks to its dual mandate evolved during each of its three policy pauses:
(1) Hike and pause. Between March 2022 and July 2023, the Fed raised the federal funds rate (FFR) by 525bps to 5.25%–5.50%, then held it steady for nearly 14 months to assess the impact.
 ▌View Related Live Charts: US - Federal Fund Interest Rates
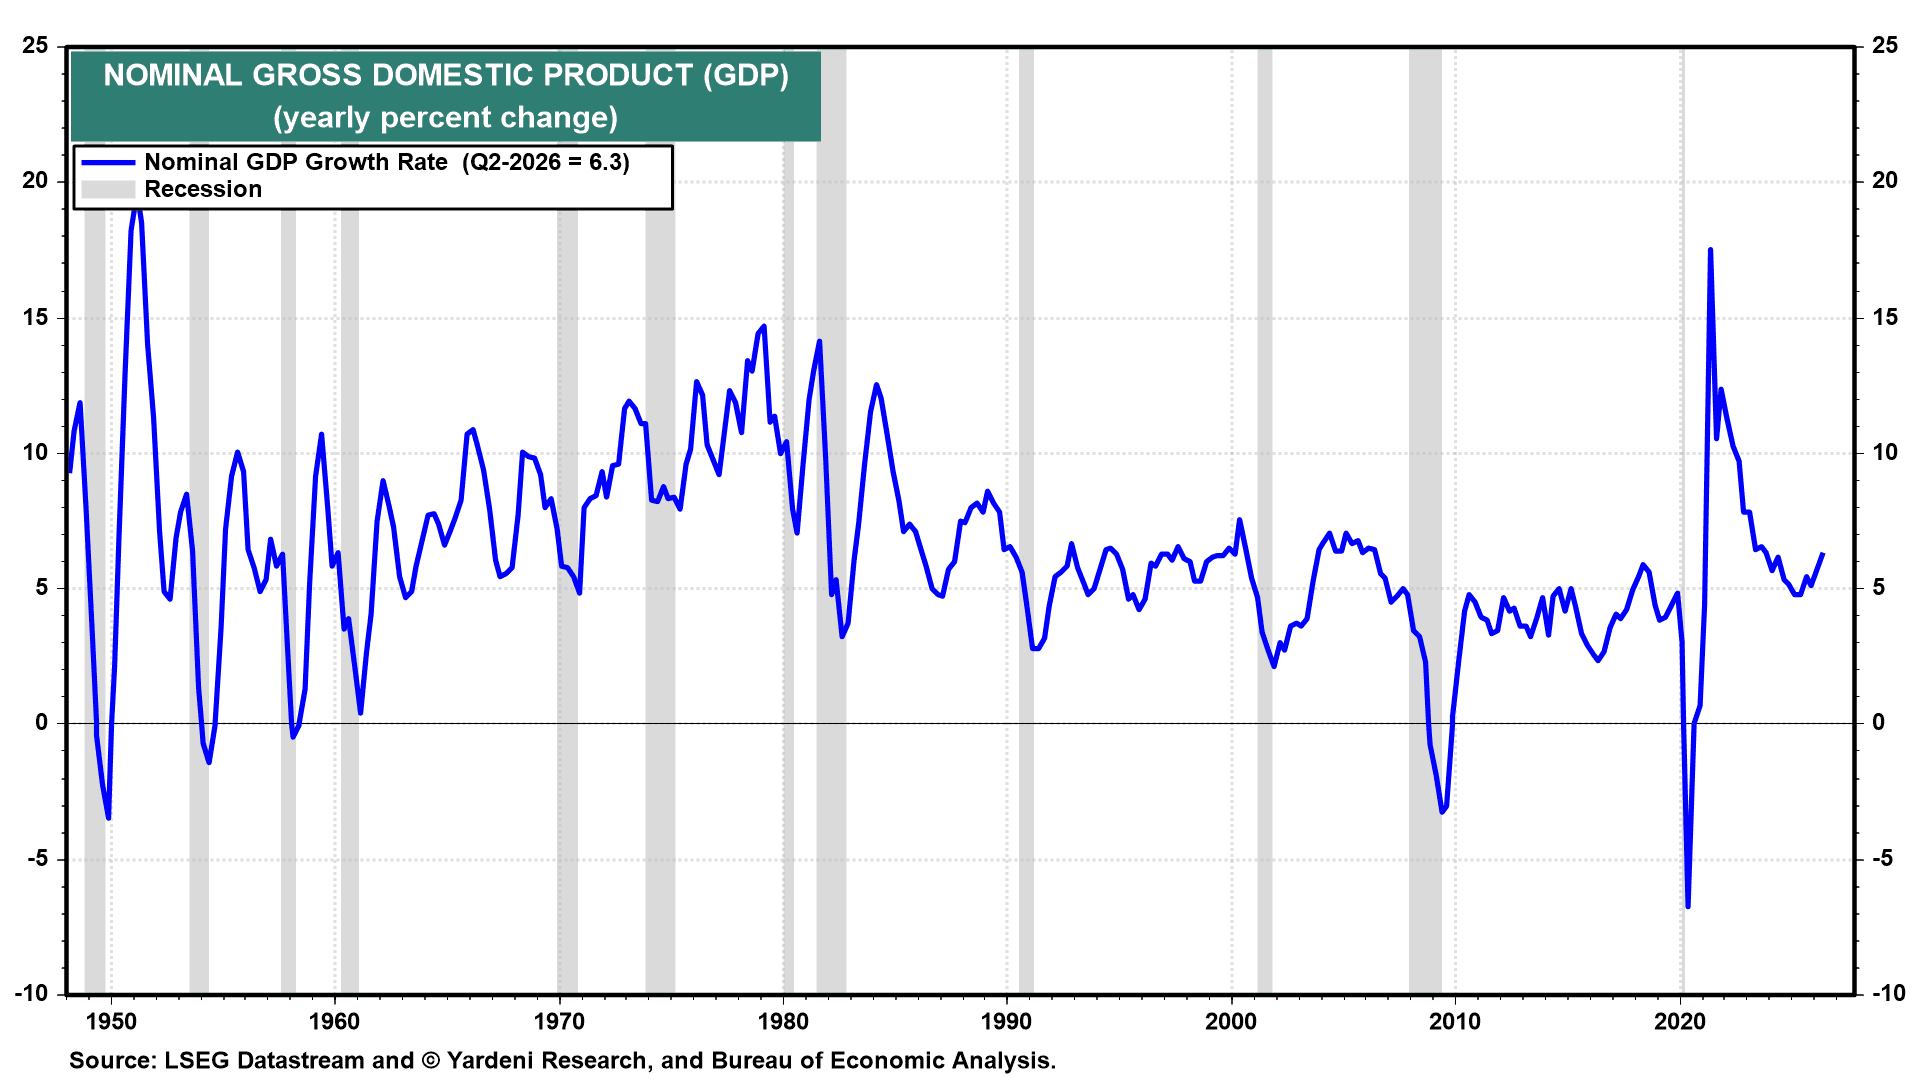
During that period, nominal GDP growth moderated from 6.4% y/y in Q2-2023 to 5.4% in Q3-2024.
 ▌View Related Live Charts: US - Nominal GDP (SAAR, YoY)
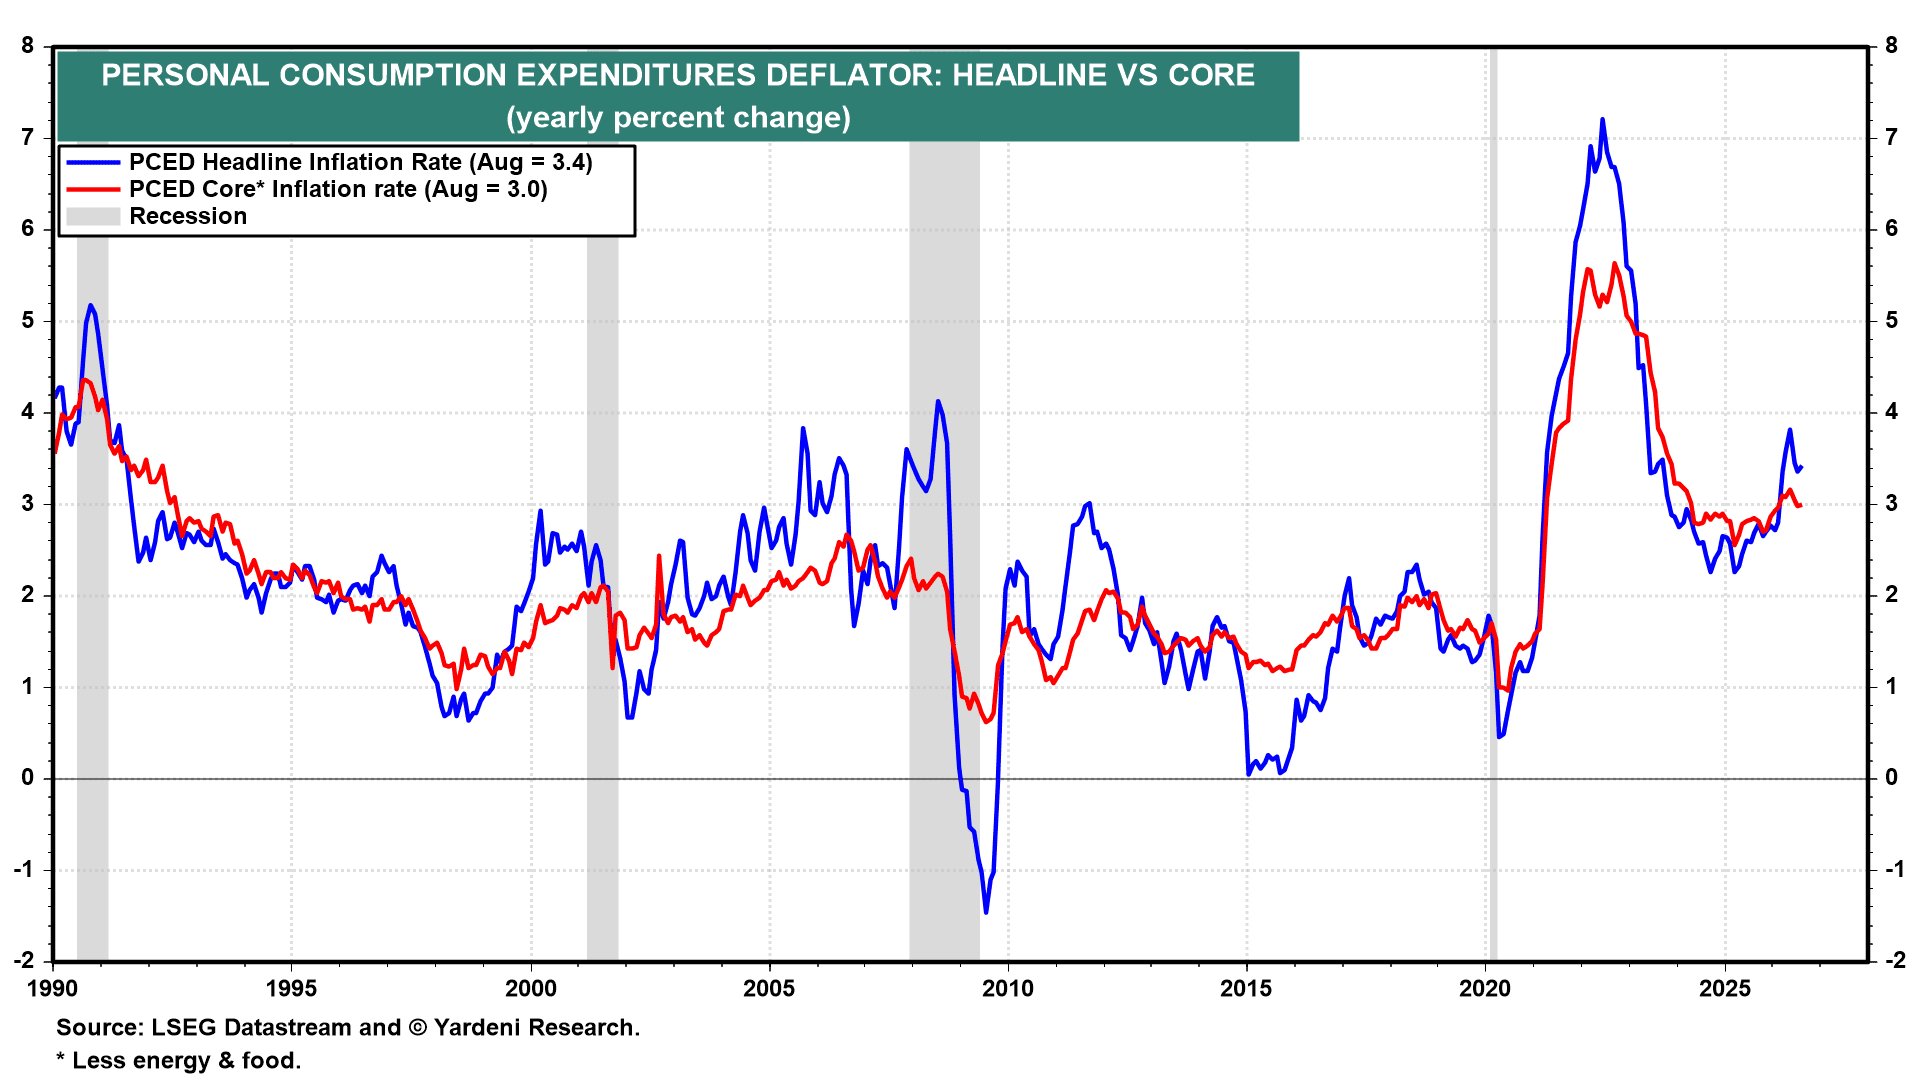
Headline PCED inflation declined from 3.4% y/y in July 2023 to 2.3% in September 2024, while core PCED inflation fell from 4.2% to 2.8%.
 ▌View Related Live Charts: US - PCE Price Index (Annualized Percent Change)
Meanwhile, the labor market cooled. The unemployment rate rose from 3.5% to 4.1%, three-month average payroll growth slowed from...
Already a subscriber? Click here to log in.
Full Access to Our Services

Comprehensive data at your service
with key indicators for investment insights

Exclusive flash reports
on key events and data

Create your own charts and analysis
including performance backtesting

Hub of professionals to engage
in meaningful discussions and insights
 Get answers from MM AI.
-
How did the Federal Reserve's policy decisions evolve from 2022 to 2026?
💡From 2022 to 2026, the Federal Reserve's policy decisions involved significant adjustments, beginning with an aggressive rate-hiking cycle from March 2022 to July 2023, raising the federal funds rate (FFR) by 525bps to 5.25%–5.50%. This was followed by a 14-month pause. The Fed then initiated rate cuts, reducing the FFR by 50bps in September 2024 and another 50bps by December 2024. A nine-month pause ensued. Subsequently, the Fed cut rates by another 75bps from September to December 2025, reaching 3.50%–3.75%, followed by another nine-month pause. Finally, in September 2026, the Fed reversed course again, hiking the FFR by 25bps to 3.75%–4.00%, with expectations of further tightening.
-
What factors complicated the Federal Reserve's effort to determine the neutral federal funds rate?
💡The Federal Reserve's effort to determine the neutral federal funds rate is complicated by its elusive nature, as policymakers cannot observe it directly but must estimate its position by assessing the economy's response to monetary policy. Furthermore, the neutral rate itself is dynamic, changing as economic conditions evolve. This uncertainty is highlighted by the possibility that the Fed might have eased too much over the past two years due to underestimating how much the neutral rate had risen, contributing to the zigzagging in policy decisions.
-
How did nominal GDP growth and inflation rates change during the Federal Reserve's first policy pause?
💡During the Federal Reserve's first policy pause, from July 2023 to September 2024, nominal GDP growth moderated from 6.4% y/y in Q2-2023 to 5.4% in Q3-2024. Headline PCED inflation declined significantly from 3.4% y/y in July 2023 to 2.3% in September 2024, while core PCED inflation also fell from 4.2% to 2.8%. These trends indicated a reduction in inflation risks and supported the Fed's decision to begin easing monetary policy.
-
What were the key labor market indicators observed during the Federal Reserve's initial rate hike and pause?
💡During the Federal Reserve's initial rate hike and pause between March 2022 and July 2023, key labor market indicators showed a cooling trend: the unemployment rate rose from 3.5% to 4.1%, the three-month average payroll growth slowed considerably from 223,000 to 72,000, and the hiring rate declined from 3.6% to 3.4%. Additionally, the ratio of job openings to unemployed workers dropped from 1.46 to 1.01. These indicators collectively suggested an increase in employment risks, which, alongside moderating inflation, supported the decision to ease monetary policy.
-
Did the Federal Reserve misinterpret labor market dynamics, specifically nonfarm payroll growth, in 2025?
💡Yes, the Federal Reserve may have misinterpreted labor market dynamics, specifically nonfarm payroll growth, in 2025. Policymakers viewed the sharp slowdown in nonfarm payroll growth as a sign of weakening labor demand and deteriorating conditions, leading to further rate cuts. However, much of this slowdown actually reflected a shrinking supply of workers, driven by factors like accelerating Baby Boomer retirements and tighter immigration policies, rather than a decline in labor demand. This misinterpretation suggests that the Fed may have overestimated the downside risks to employment.
-
What evidence suggested that the labor market was more resilient than headline payroll numbers indicated?
💡Evidence suggesting the labor market was more resilient than headline payroll numbers indicated included the modest increase in unemployment insurance claims during the second pause, with the four-week average of initial claims rising only from 223,000 in December 2024 to 234,000 in September 2025, and continuing claims from 1.86 million to 1.92 million. These figures did not suggest widespread layoffs. Furthermore, during the third pause, initial unemployment claims actually declined from 219,000 to 201,000, and continuing claims fell from 1.89 million to 1.71 million, reinforcing the assessment of a resilient labor market without an emerging layoff cycle, despite slower payroll growth.
-
How does the US economy's transition from secular stagnation to secular growth impact the neutral FFR?
💡The US economy's transition from secular stagnation (2010–2019) to secular growth (2023–2026) significantly impacts the neutral federal funds rate (FFR) by pushing it higher. Secular stagnation was characterized by sluggish nominal GDP growth (4.1% y/y), low inflation (1.5% headline PCED), and a savings glut, which collectively depressed interest rates. In contrast, secular growth features stronger nominal GDP growth (5.8% y/y), persistent inflation (3.1% headline PCED), and a growing shortage of saving relative to investment demand, creating upward pressure on the neutral FFR. This shift implies that the equilibrium interest rate required to neither stimulate nor restrain the economy is now higher.
-
How did the composition of inflation, particularly goods and services inflation, change since 2023?
💡Since 2023, the composition of inflation has changed notably compared to the secular stagnation period. During secular stagnation, goods inflation averaged just 0.2% and often experienced deflationary periods, which helped offset services inflation that averaged 2.2%. However, since 2023, goods inflation has averaged 1.0%, while services inflation has significantly increased to an average of 4.1%. By August 2026, both goods and services inflation stood above 3.0%, indicating a broader and more persistent inflationary environment, with goods no longer providing a disinflationary tailwind.
-
How do AI investment, federal deficits, and labor force dynamics influence the neutral real interest rate (R*)?
💡AI investment, federal deficits, and labor force dynamics significantly influence the neutral real interest rate (R*) by affecting the balance between desired saving and desired investment. The AI investment boom fuels demand for capital in areas like data centers and semiconductors, increasing overall investment demand. Large federal deficits absorb national savings, further reducing the supply of available capital. Simultaneously, the accelerating retirement of Baby Boomers and tighter immigration policies constrain labor force growth, which in turn reduces the supply of national savings. When saving declines relative to investment demand, as these factors collectively cause, the neutral real interest rate (R*) rises to equilibrate the market.
-
Why is the Federal Reserve raising rates despite inflation being partly driven by supply shocks?
💡The Federal Reserve is raising rates despite inflation being partly driven by supply shocks because it needs to return the federal funds rate (FFR) to a neutral level, estimated to be between 4.25%–4.50%. Policymakers previously overestimated employment risks and cut the FFR below this neutral stance, creating an accommodative environment. While supply shocks like the AI buildout and elevated energy prices are beyond the Fed's direct control, raising rates is necessary to remove this accommodation and ensure that these shocks do not generate persistent second-round inflation effects, especially given that inflation has remained above the 2.0% y/y target for over five years and economic growth is robust.

