Since taking office, Trump has rolled out reciprocal tariffs, industry-specific levies, the arrest of Venezuela’s president, and tariff pressure on Europe tied to Greenland—moves that look bold, chaotic, even unpredictable.
But they aren’t random. Behind the headlines lies a clear strategic playbook. In this 50+ page report, we break down Trump’s underlying strategy—and, more importantly, what it means for investors. Learn how to read the signals, anticipate policy moves, and position your portfolio ahead of the market.
The pivotal moment of 2025 came on April 2nd with the announcement of reciprocal tariffs. Our early analysis identified three internal contradictions in the US tariff strategy that suggested the measures would lose strength over time—a forecast that proved accurate as tariffs settled within the 10-20% range for most countries by year-end, well below initial fears.
What emerged instead was a more sophisticated three-pronged approach from the Trump administration: tariffs as a fiscal tool, energy price suppression to contain inflation, and rate cuts to restore affordability. This framework delivered a strong year across asset classes, with global equities rallying from the April bottom and both bonds and gold posting significant gains.

Three Critical Questions for 2026
Our 2026 outlook addresses three essential questions that will determine investment outcomes:
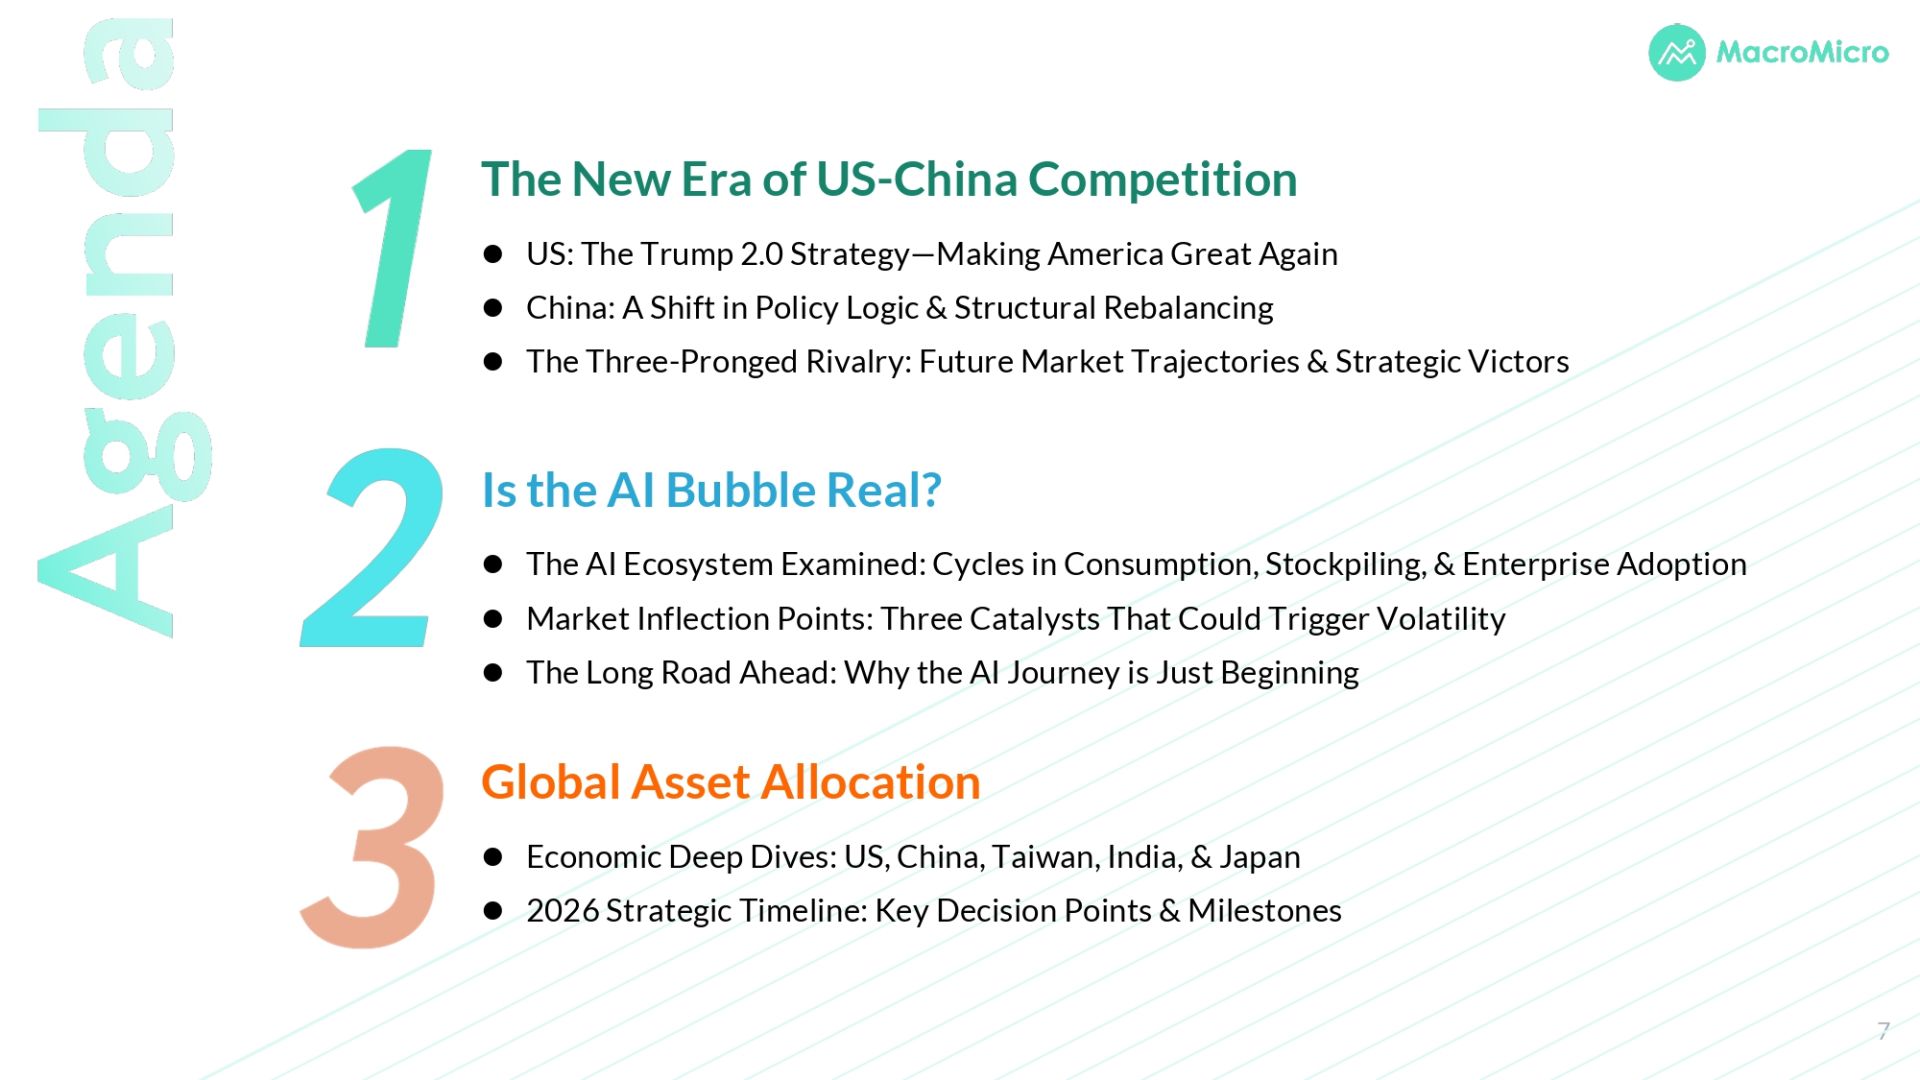
1. Who's Winning the US-China Contest?
Under the new administration, the strategic framework has evolved into what we describe as three interconnected “arrows”: tariffs as a tool for fiscal and geopolitical leverage, deliberate suppression of energy prices to contain imported inflation, and a push for lower interest rates once inflation is stabilized. These elements are not isolated policies but part of a broader effort to address long-term challenges—declining relative hegemony, rising debt, and technological competition.
Meanwhile, China has demonstrated greater resilience and policy adaptability than in previous cycles. Structural shifts in technology, fiscal support, and trade positioning have altered the balance of leverage. We examine how these dynamics are playing out and what they imply for long-term sectoral winners.
2. Is AI in Bubble Territory?
AI remains one of the most significant drivers of productivity and investment in this cycle. Demand fundamentals are solid, semiconductor inventories remain manageable in key segments, and corporate revenue streams are beginning to migrate downstream. Yet valuations have reached elevated levels, and we're entering what we call the Validation Phase—where investors are no longer satisfied with potential but are demanding real-world enterprise adoption and tangible returns on CapEx.
Physical constraints, particularly energy, are becoming visible but may paradoxically help prevent runaway speculation. The more pressing concern is timing: base effects will intensify through the year, creating specific risk windows. We identify specific risk windows, particularly around Taiwan's critical $70 billion monthly export threshold and base effects in Q2 2026.
3. How Should Portfolios Be Positioned?
2026 is shaping up to be a year of fiscal expansion across major economies, moderated monetary easing, and a more balanced (though still differentiated) growth recovery. We present our forecasts for key economies, including the United States, Taiwan, China, India, and Japan, along with implications for equities, bonds, currencies, and commodities. We pay particular attention to the transition from AI infrastructure plays to application-layer opportunities.
A Measured Approach to Risk
Rather than predicting crashes or euphoria, our framework focuses on identifying inflection points. We've developed quantitative tools—including our MM Bull-Bear Index and Market Correction Probability Model—to help navigate what we expect to be a year of divergent performance across sectors and geographies.
The multi-point recovery that began in late 2025 should continue, but with AI stocks facing elevated expectations, diversification becomes increasingly important. We detail which fundamental indicators to monitor and when liquidity conditions may shift from cautious (H1) to supportive (H2).
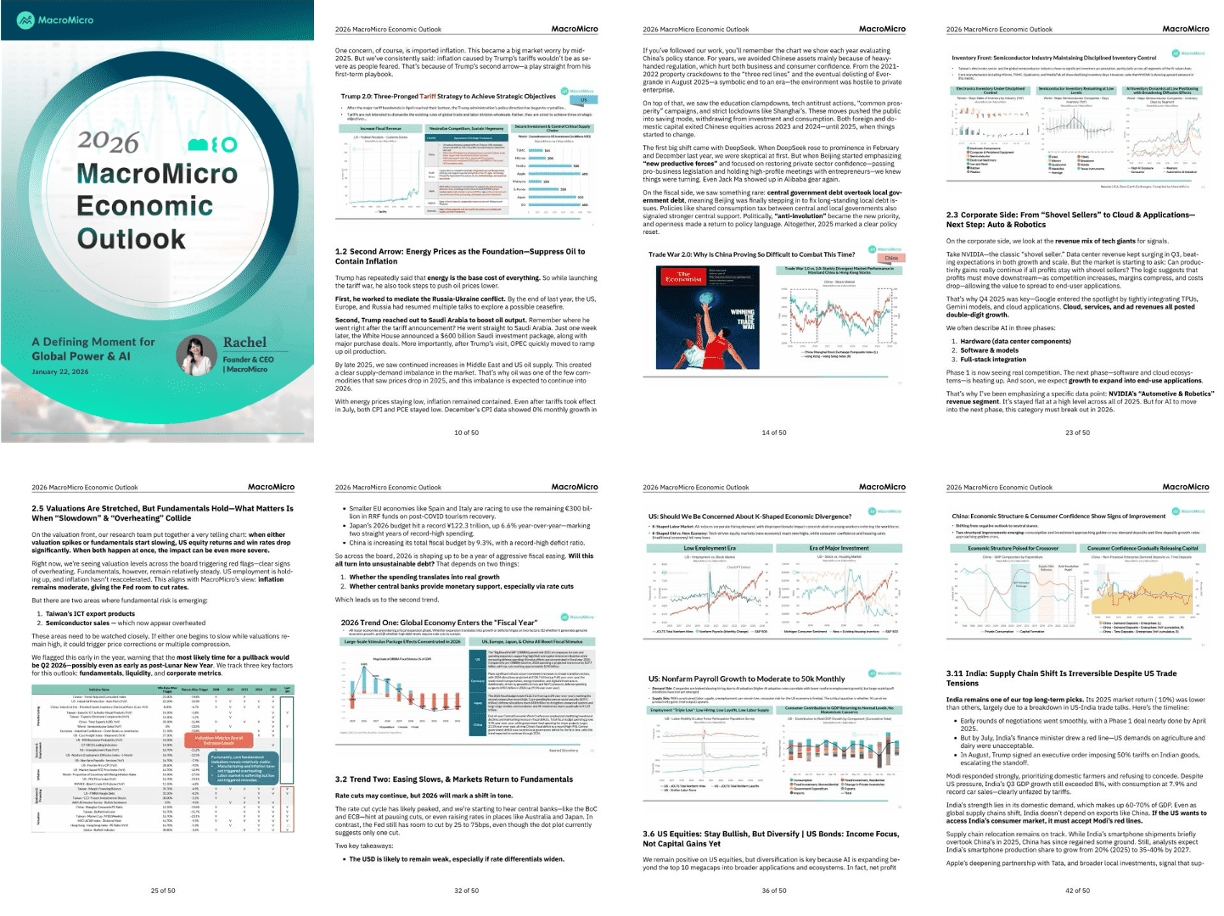
Our full 2026 MacroMicro Economic Outlook includes comprehensive regional analysis, sector-specific forecasts, detailed asset allocation recommendations, and proprietary data insights from our partnerships with industry intelligence firms. The full report and slide deck are available exclusively to our MM Max Subscribers. Subscribe today and enjoy full access.
Already a subscriber? Click here to log in.
Full Access to Our Services

Comprehensive data at your service
with key indicators for investment insights

Exclusive flash reports
on key events and data

Create your own charts and analysis
including performance backtesting

Hub of professionals to engage
in meaningful discussions and insights

