Trump's tariff playbook shifted again. The US–Iran conflict sent oil past $100. And AI is quietly rewriting the rules of hiring, spending, and growth — all at once.
None of it is random. In this 20+ page slide deck, we breaks down what's actually driving markets in 2026. Learn how to read the signals, assess what's priced in, and position your portfolio before the next move.
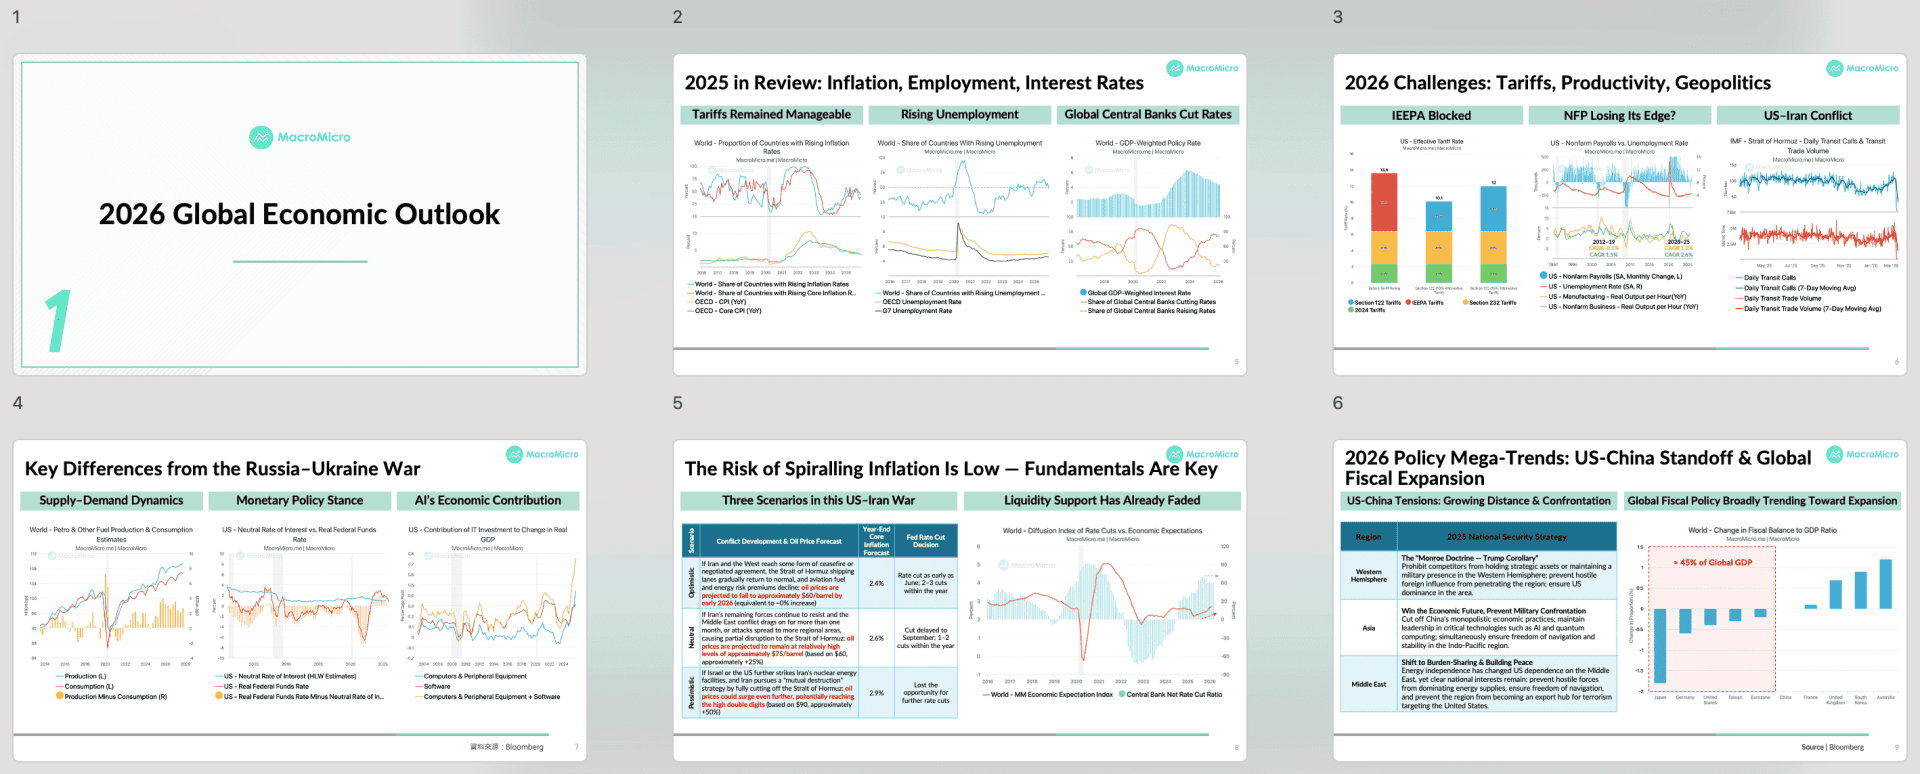
2025 ended better than feared. Tariffs stayed manageable, rate cuts spread across 80%+ of global economies, and AI-driven productivity gains quietly reshaped the labor market. It wasn't the hard landing many predicted — it was a year of structural transition. Now 2026 is asking harder questions. The Supreme Court blocked Trump's reciprocal tariffs. Nonfarm payrolls have nearly stalled. And the US–Iran conflict has become the market's biggest wildcard, with oil briefly topping $100 before pulling back.
3 Questions This Session Answers
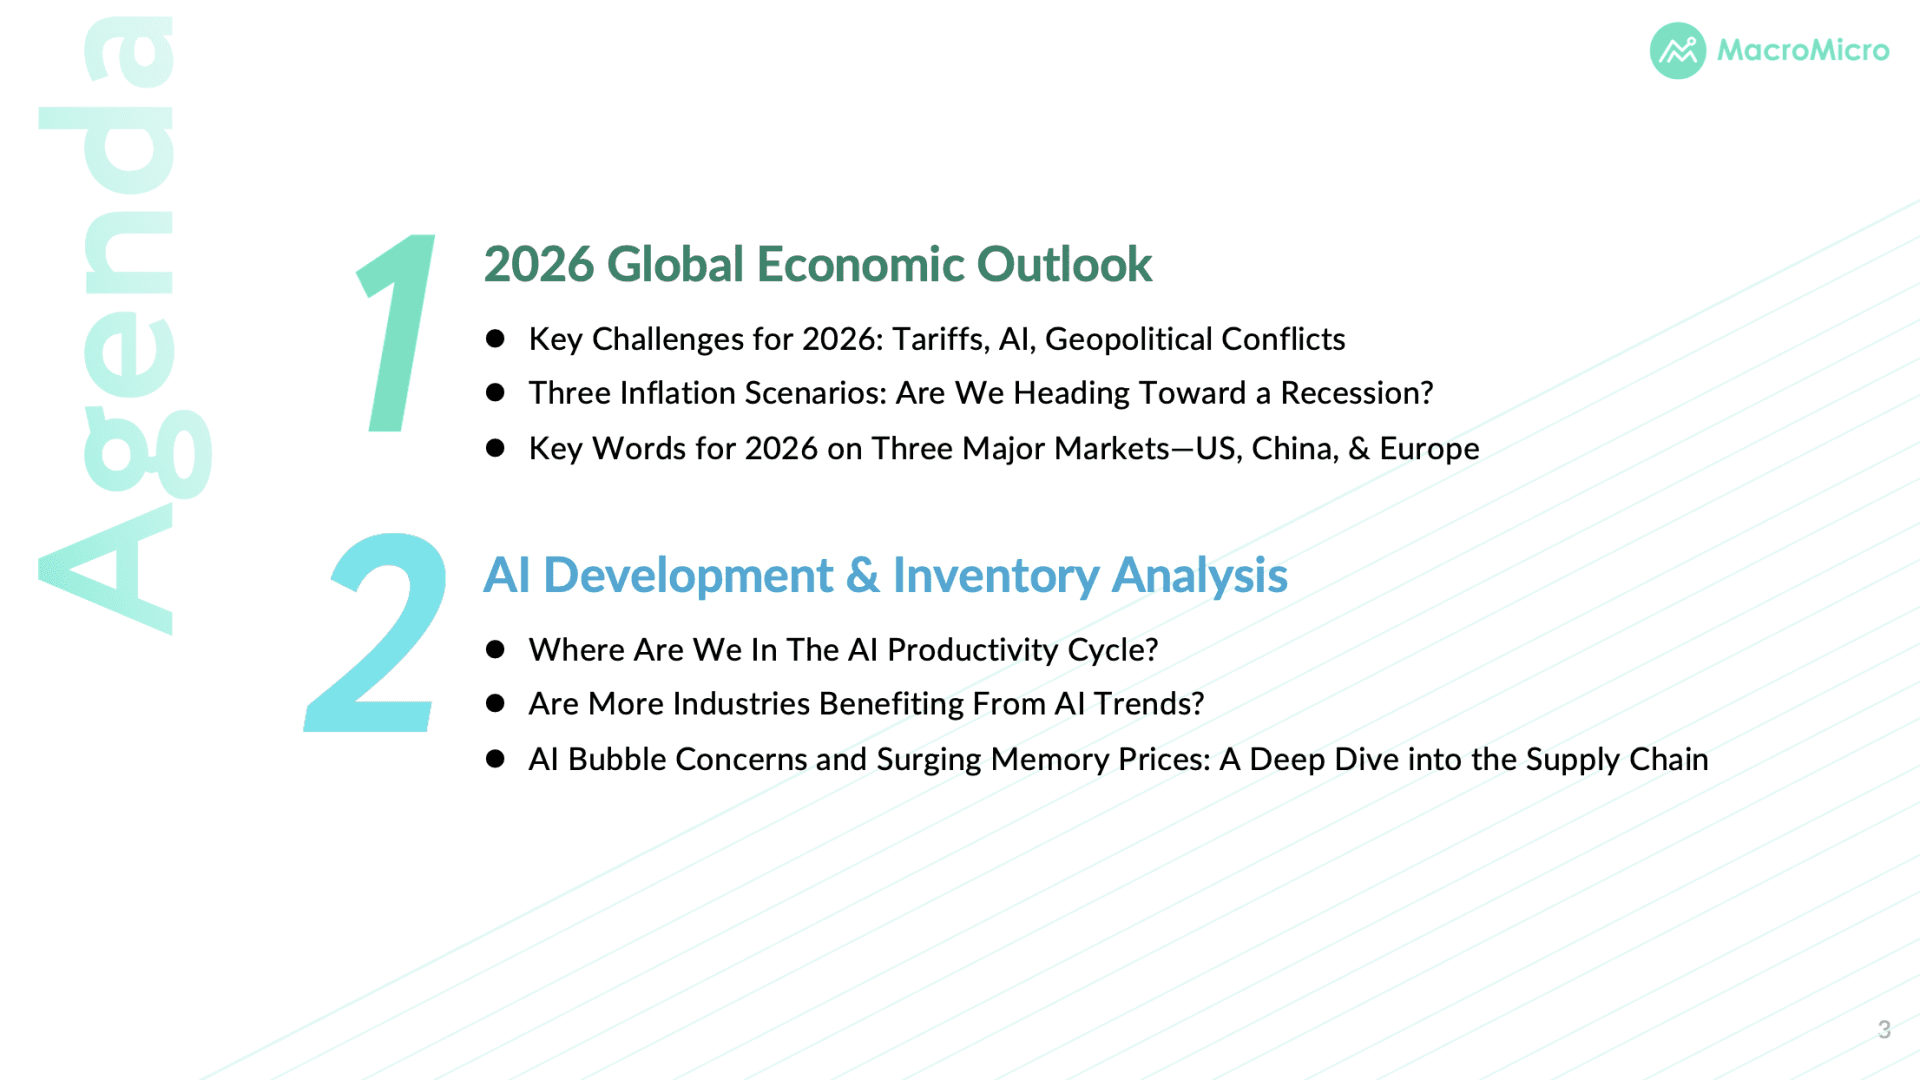
1.Stagflation Actually Coming?
The short answer: probably not. But the reasoning matters. Compared to the Russia–Ukraine shock in 2022, today's oil market is in surplus, real rates are still restrictive, and AI demand is providing a genuine offset to energy price pressure. We walk through three US–Iran scenarios — optimistic, neutral, and pessimistic — and what each means for core inflation, Fed timing, and your portfolio.
2. Where Are We in the AI Productivity Cycle?
AI isn't just a theme anymore, it's showing up in the data. Output per hour continues to rise even as payrolls stall, and the downstream revenue migration from infrastructure to applications is accelerating. We examine the semiconductor supply chain through Taiwan's $70B monthly export threshold, memory price dynamics, and which parts of the AI stack are entering a new risk window in Q2.
3. Which Markets Hold Up — and Which Don't?
Three economies are driving the semiconductor supercycle, and each faces a different 2026 setup. The US is shifting from tariff shock to fiscal stimulus. China is quietly gaining leverage through policy adaptability. Europe and Japan are opening the fiscal taps. We map the divergence across equities, rates, currencies, and commodities — and where the highest-conviction opportunities sit heading into H2.
One Framework to Cut Through the Noise
Rather than chasing headlines, this session gives you quantitative anchors, MacroMicro's Bull-Bear Index, our Market Correction Probability Model, and the specific fundamental indicators that signal when liquidity conditions shift. H1 calls for caution. H2 may tell a different story.
This session is part of 2026 MacroMicro Economic Outlook Series — exclusive research built to help subscribers cut through the noise and act with conviction. The full slide deck are available exclusively to our MM Max Subscribers. Subscribe today and enjoy full access.
Already a subscriber? Click here to log in.
Full Access to Our Services

Comprehensive data at your service
with key indicators for investment insights

Exclusive flash reports
on key events and data

Create your own charts and analysis
including performance backtesting

Hub of professionals to engage
in meaningful discussions and insights
