As markets grow less reactive to tariff developments, global equities continue setting new highs amid the ongoing “TACO trade” rally. But have tariffs truly had no material impact on the broader economy or corporate earnings?
Heading into the second half of 2025, key market drivers will include slowing growth, persistent inflation, and evolving rate expectations. Drawing from our wealth of research and user engagement on our platform, we've distilled the 10 most critical charts to guide investors through this dynamic landscape. Organized into key thematic pillars—Trump's tariff strategy, manufacturing dynamics, macroeconomic stability, and the AI/semiconductor boom—these charts weave a narrative of opportunity and caution.
To help you in your analysis, we’ve compiled these 10 charts into a single, dynamic collection. Save them to My Dashboards for real-time tracking and instant access anytime!
I. Trump's Tariffs: Peak Escalation Behind Us
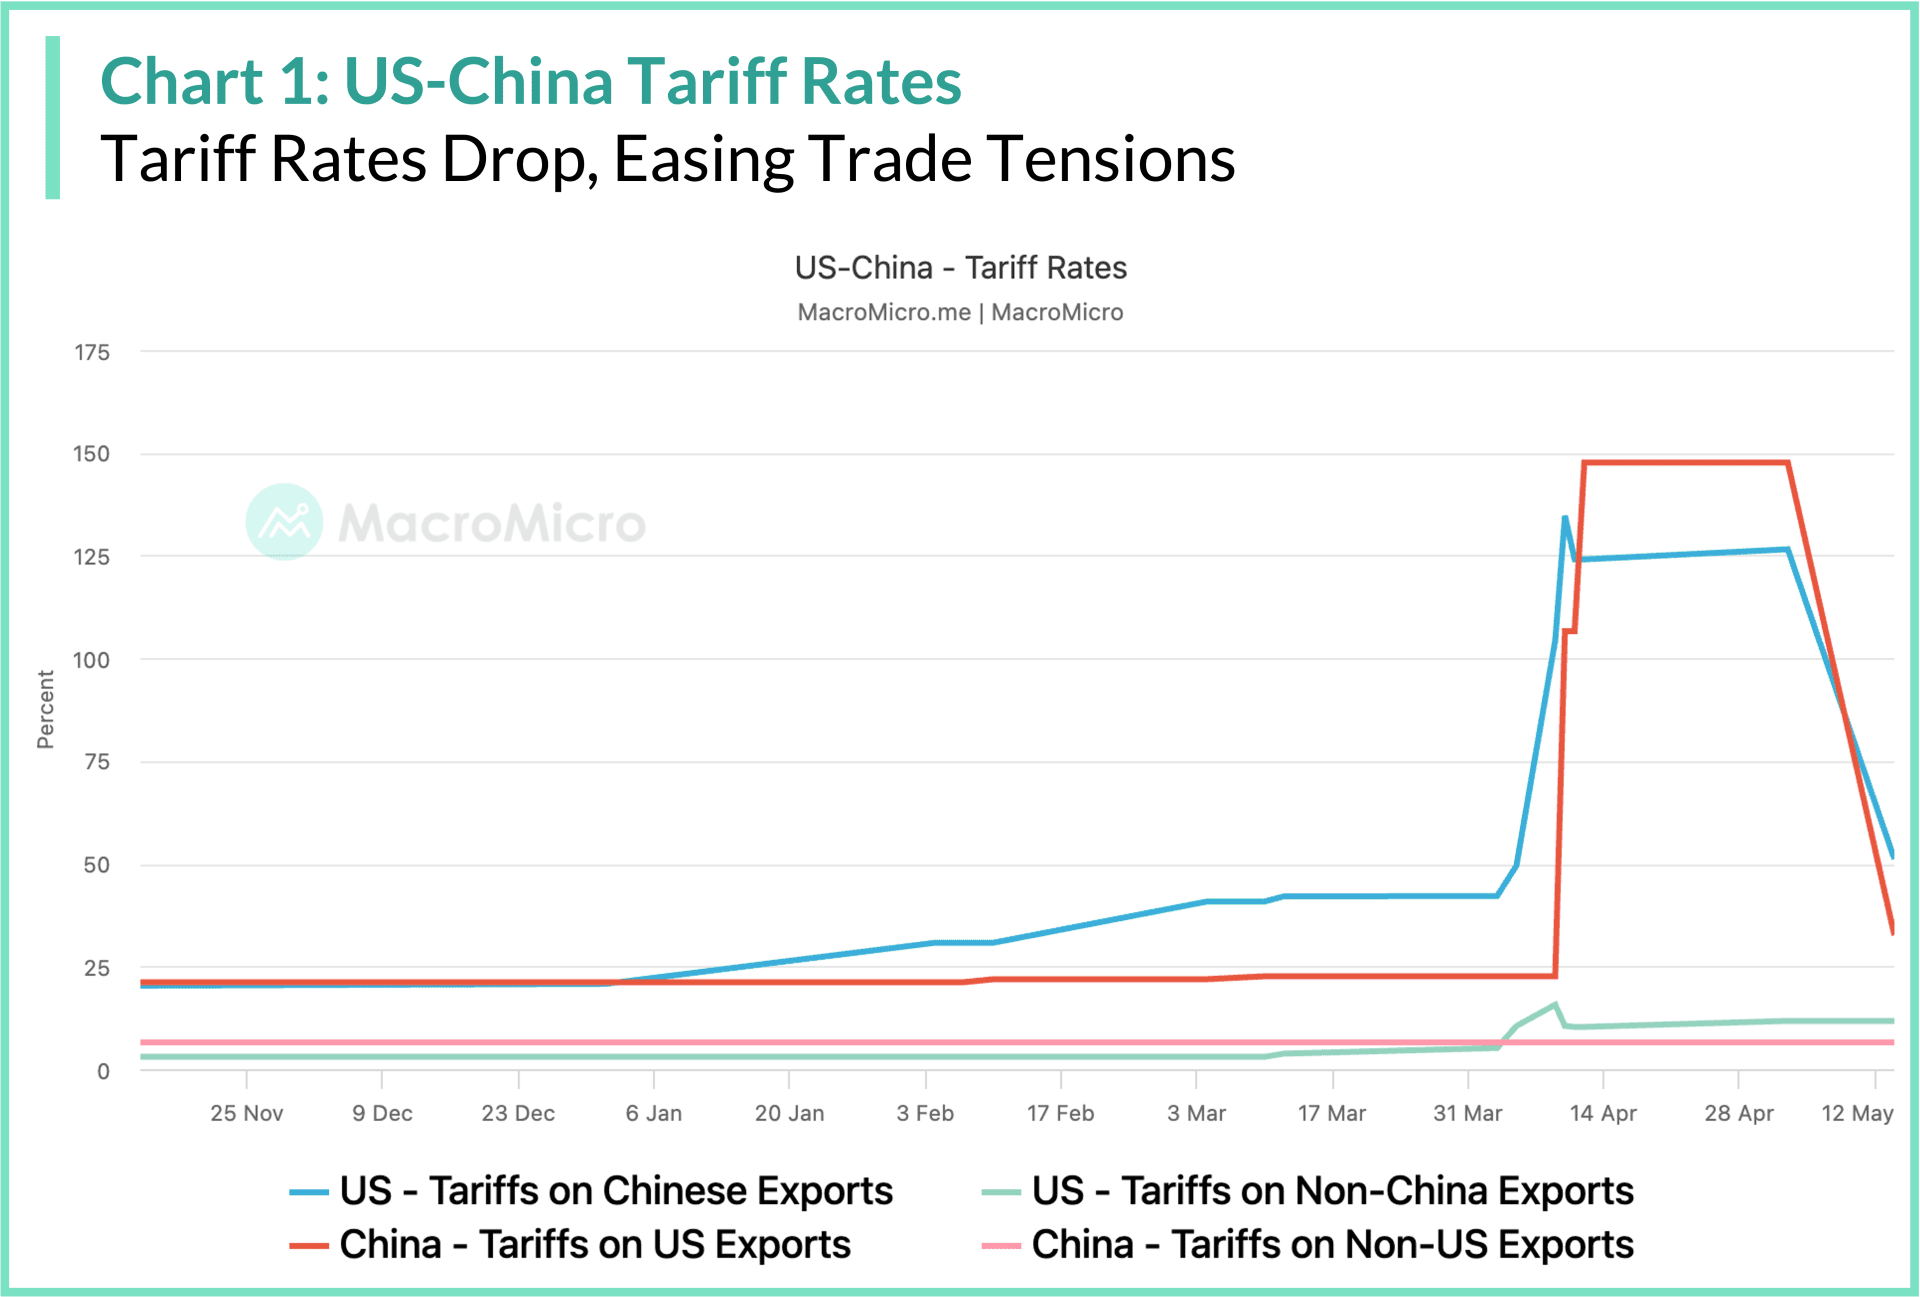
Tariffs remain the defining issue for 2025, but our position has always been that the most extreme measures are behind us. Trump's tariff agenda operates as targeted leverage—primarily aimed at containing China's tech influence, preventing trade rerouting, and strengthening US negotiating position. The 100%+ tariff rates on Chinese goods seen earlier this year represent peak escalation designed to force compliance rather than sustained policy. Going forward, we expect more measured tariff implementation focused on specific sectors and strategic concessions.
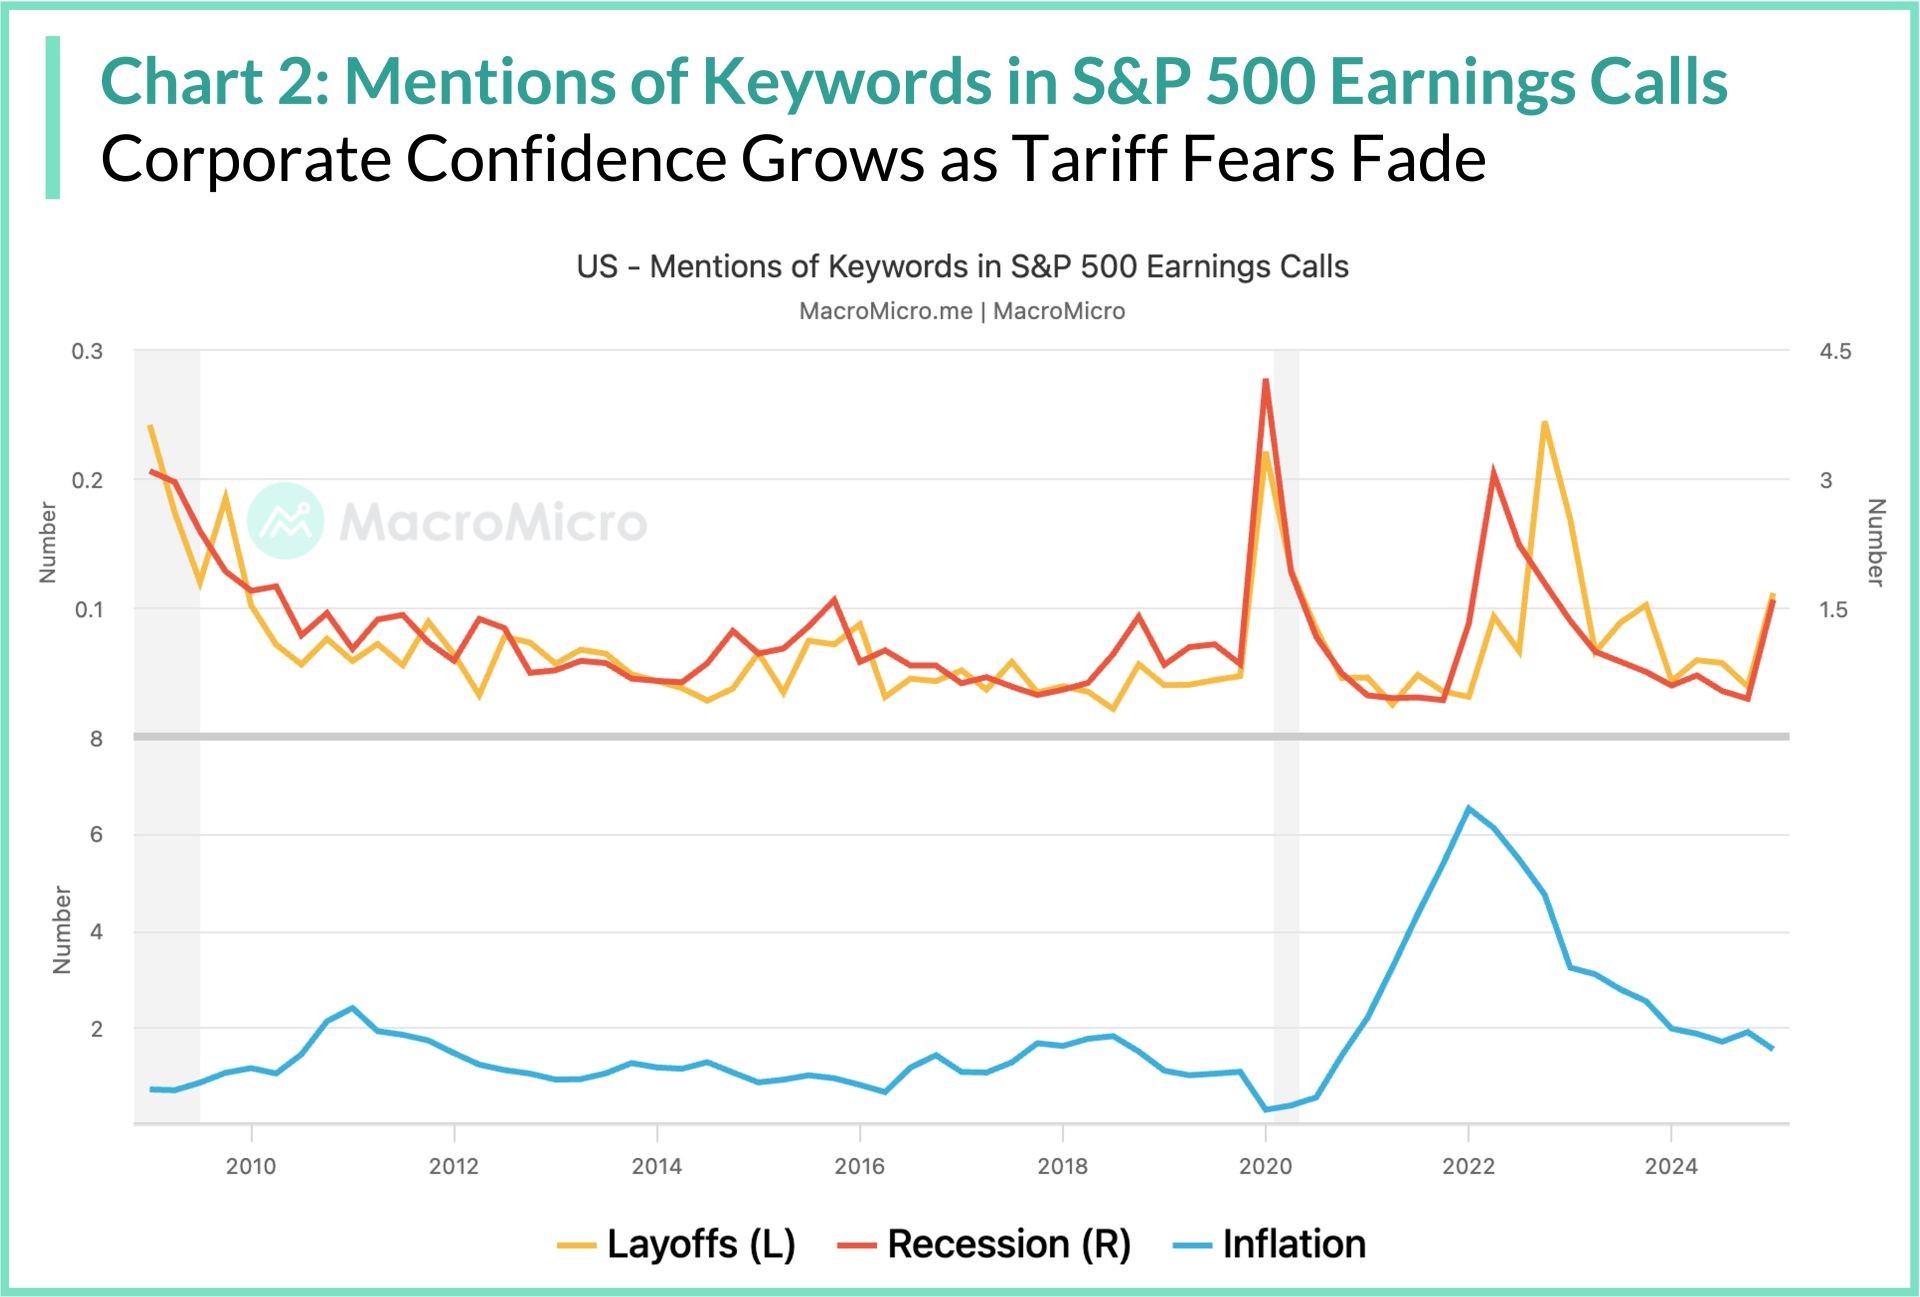
This strategic moderation stems from political and economic realities. Trump's approval ratings show sensitivity to economic disruption, and the 2026 midterms create accountability pressure. Corporate earnings calls reveal businesses adapting to tariff realities without the catastrophic impacts initially feared. Inflation has remained contained despite tariff implementation, validating our view that extreme tariffs were temporary pressure tactics rather than permanent policy.
The investment implication is clear: tariff uncertainty peaks in 1H 2025, with policy clarity and moderation emerging in 2H 2025.
Charts to Watch:
- US-China Tariff Rates - Chinese tariff rates exceeding 100% earlier this year marked peak trade tension. We anticipate stabilization around 60-80% rates as Trump shifts from maximum pressure to negotiated settlements. A flattening or decline in these rates in 2H 2025 would confirm our thesis of strategic moderation.
- US - Mentions of Keywords in S&P 500 Earnings Calls - Corporate America's sentiment, captured through keyword frequency in earnings calls, reveals how businesses are navigating tariff pressures. In 2H 2025, tariff-related mentions are likely to taper as policy clarity emerges, but layoff concerns may linger if manufacturing weakens. A continued drop in inflation mentions would reinforce market confidence, supporting valuations in tech-heavy indices.
II. Manufacturing Cycle: Managing the Downturn
The manufacturing sector confronts a unique challenge: natural cyclical downturn intersecting with tariff-induced supply chain disruption. The sector's performance will ultimately determine whether Trump's trade strategy succeeds without triggering broader economic deterioration. We posit that this convergence is manageable due to disciplined inventory management and AI-driven demand offsetting traditional manufacturing weakness.
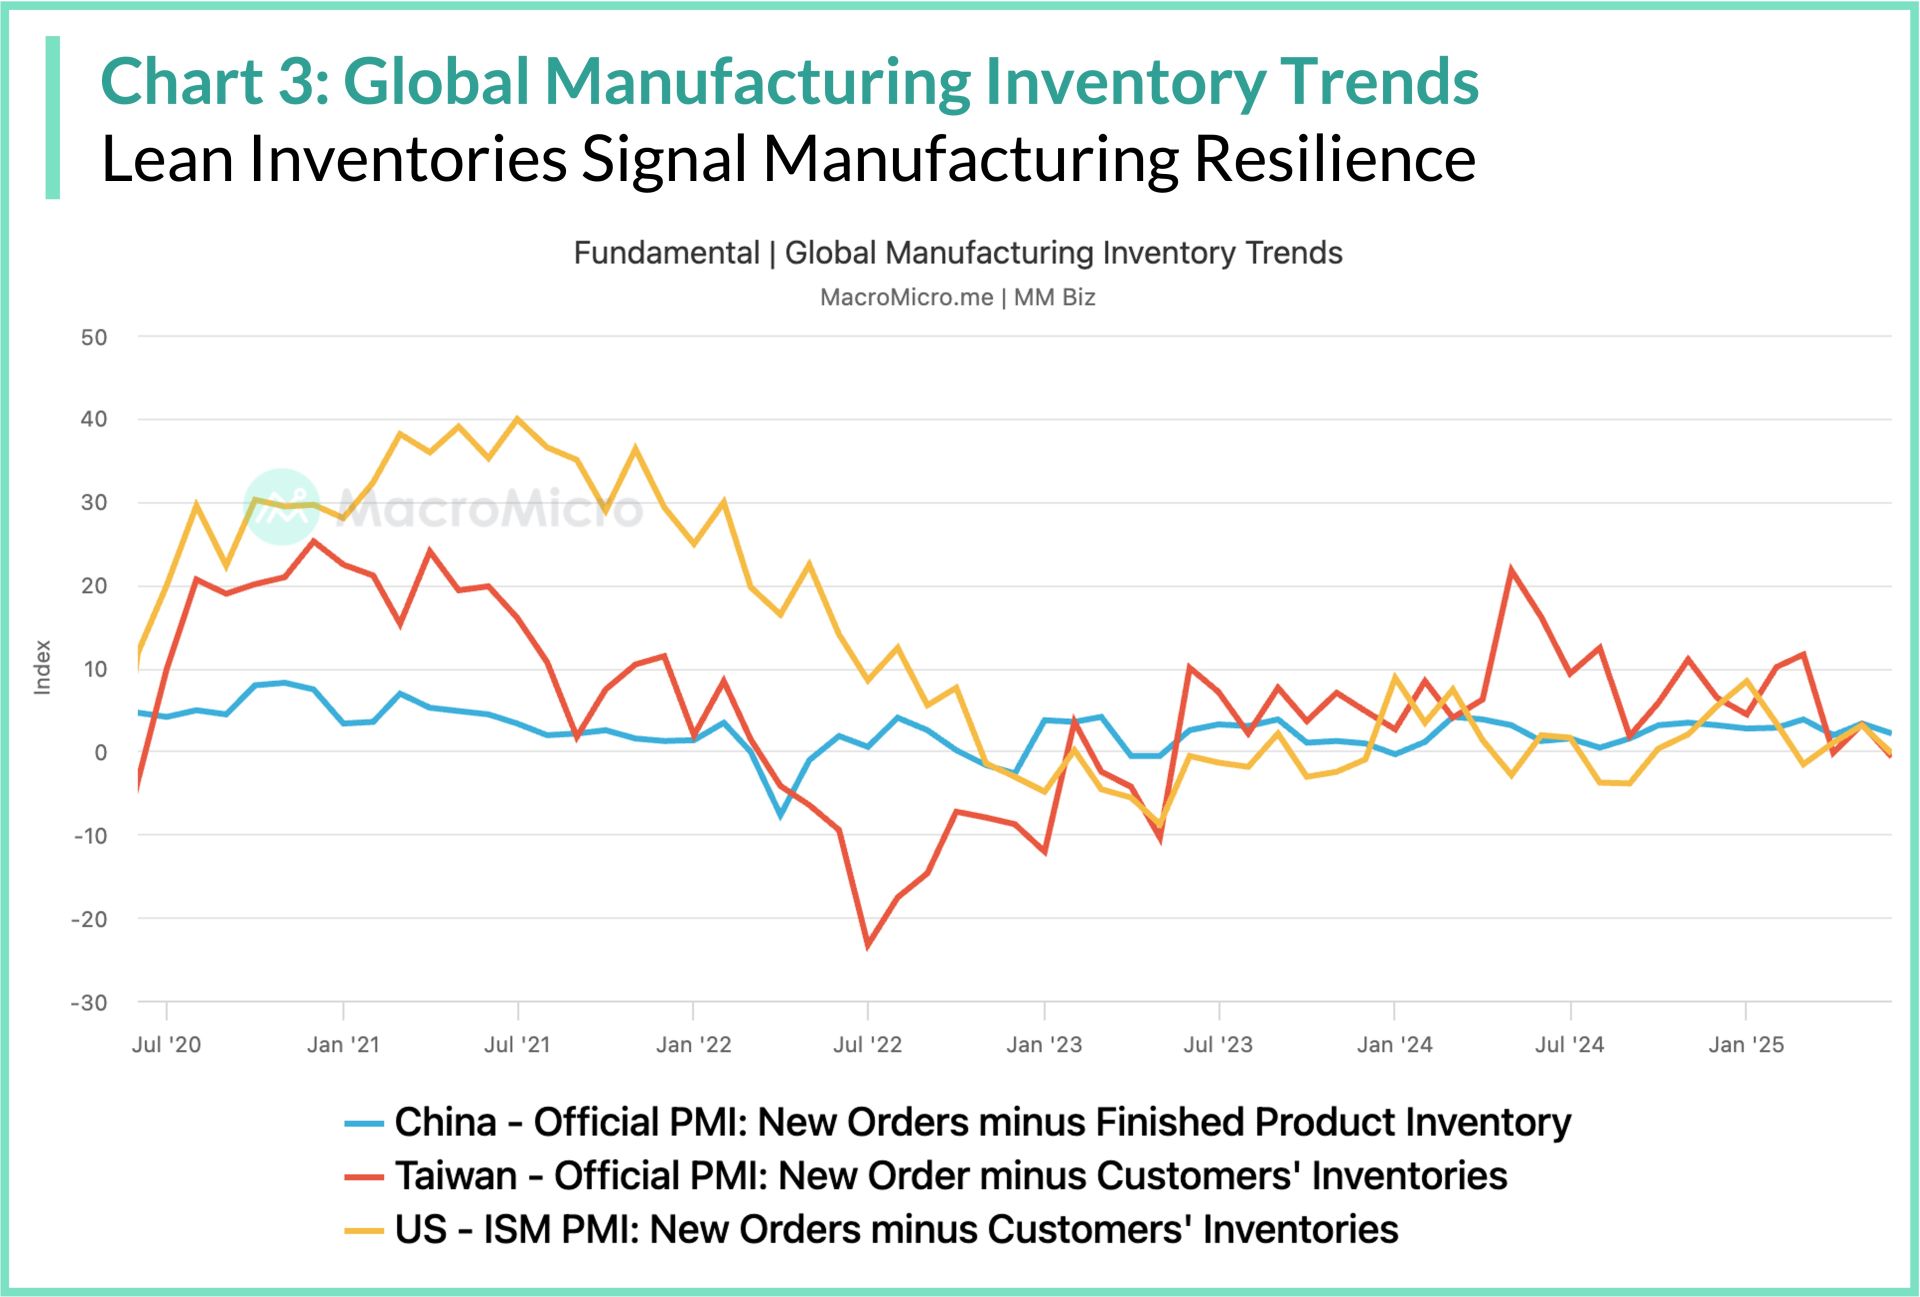
Global trade volumes reveal significant front-loading activity as companies accelerated shipments ahead of tariff implementation. However, current inventory indicators remain controlled. PMI inventory subcomponents and US industry inventory-to-sales ratios show no dangerous buildup, suggesting manufacturers maintained discipline despite trade pressures. This inventory restraint prevents the excess accumulation that typically amplifies manufacturing downturns.
The key dynamic for 2H 2025 is whether consumer demand absorbs the front-loaded inventory without triggering destocking pressure. The sector's ability to navigate this cycle without triggering broader economic stress depends on whether lean inventory management can be maintained as the natural cyclical downturn continues.
Charts to Watch: -Fundamental | Global Manufacturing Inventory Trends - Monitoring the balance between incoming demand and production buildup in key economies is crucial. When new orders exceed inventory accumulation (positive readings), it suggests healthy demand absorption. Current readings indicate manufacturers have avoided dangerous inventory buildups despite front-loading activity. Sustained positive readings in 2H 2025 would confirm that genuine demand is absorbing artificial trade flows, supporting manufacturing stability.
- World - MM Manufacturing Cycle Index - Our proprietary index integrates global manufacturing, retail, and trade data to gauge production cycle health. Currently trending downward, it signals a slowdown exacerbated by tariff-induced trade disruptions. However, the index's fluctuations around zero suggest a resilient downswing rather than collapse. If it stabilizes in 2H 2025, supported by sustained consumer demand, manufacturing could avoid active destocking, bolstering global equities. A sustained drop below zero would signal deeper risks requiring defensive positioning.
Already a subscriber? Click here to log in.
Full Access to Our Services

Comprehensive data at your service
with key indicators for investment insights

Exclusive flash reports
on key events and data

Create your own charts and analysis
including performance backtesting

Hub of professionals to engage
in meaningful discussions and insights
