Q1. The IEA has authorized its largest-ever reserve release, but why has oil remained above $100 per barrel?
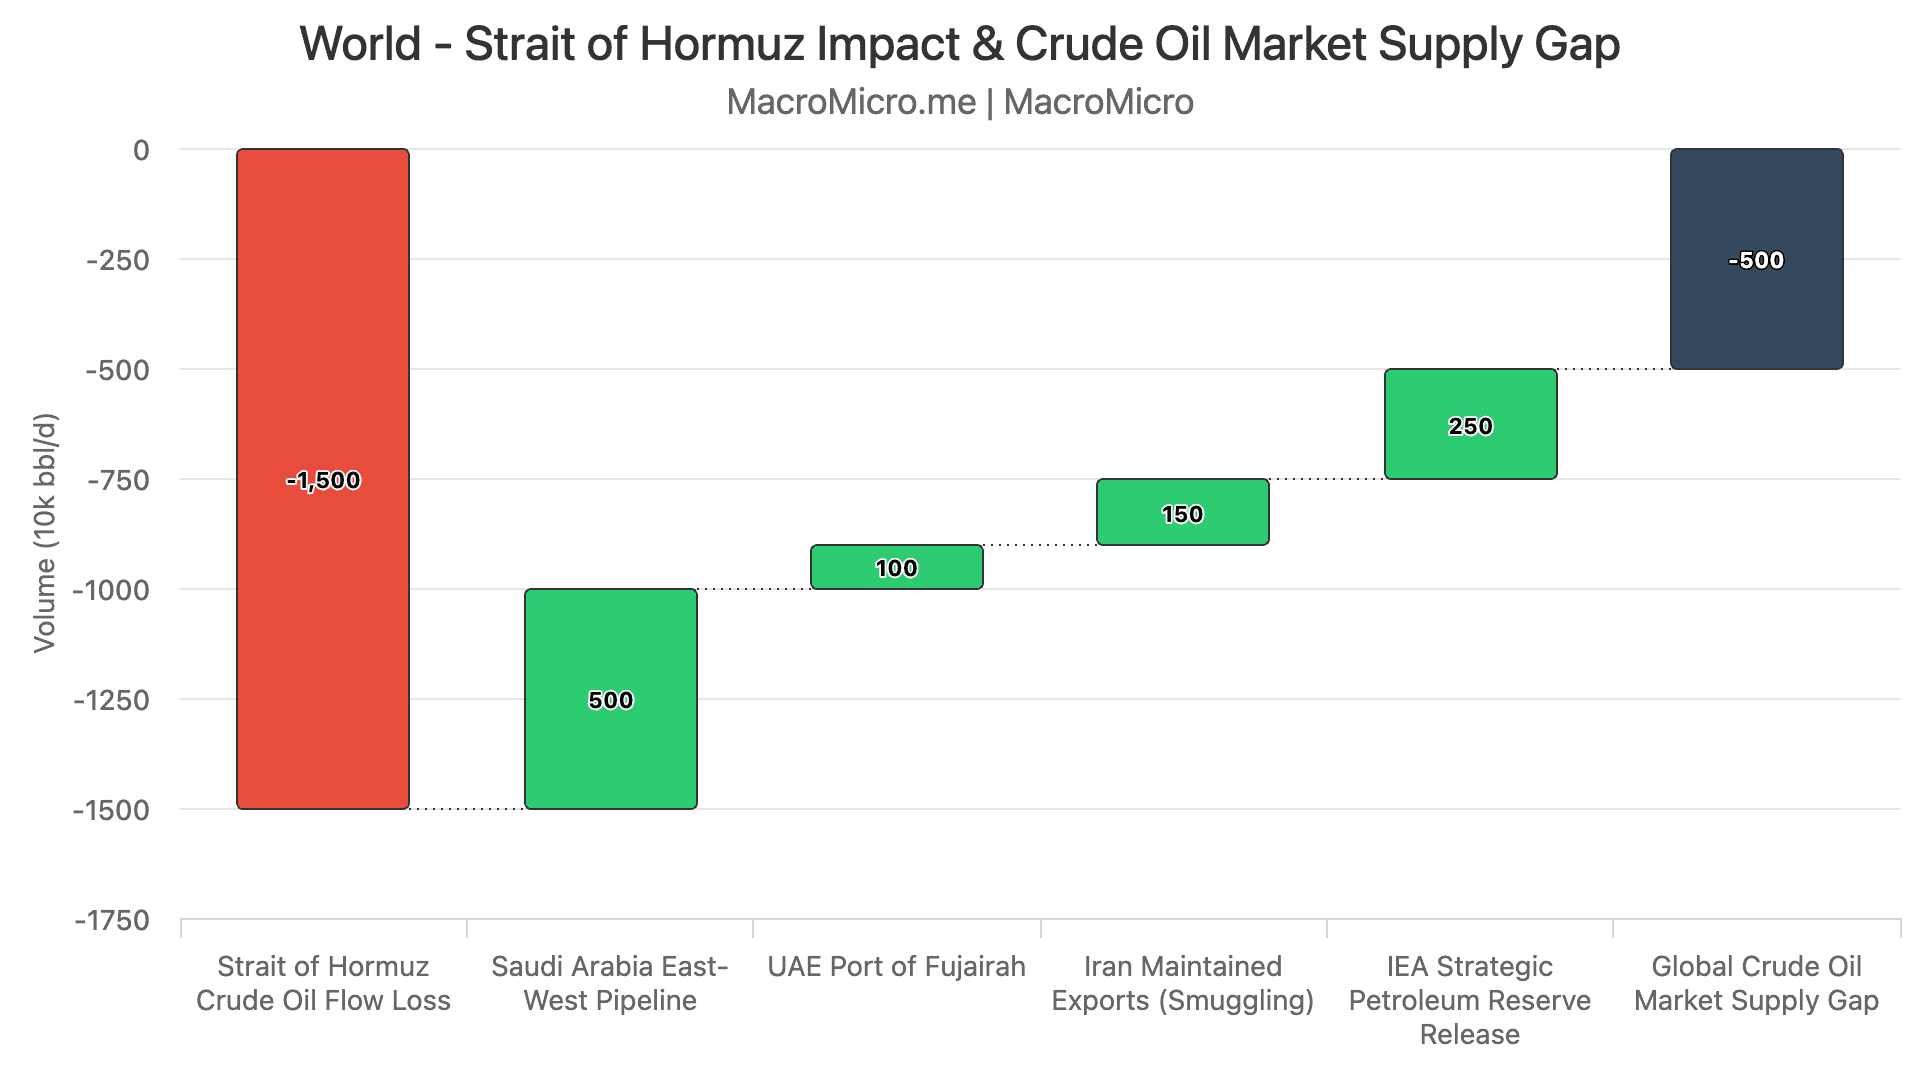
A: The scale of the release is insufficient relative to the size of the disruption. The IEA's 400 million barrel release, announced March 11, is composed of crude oil and refined products across member states. Adjusting for the crude oil share by region, roughly 296 million barrels of that total is crude. Spread over a 120-day release window, that translates to approximately 2.5 million barrels per day of crude supply support. Against a pre-war Hormuz throughput of 15 million barrels per day of crude alone, the buffer is structurally inadequate. Even when combined with Saudi and UAE rerouting capacity through alternative pipelines and ports, estimated at 4 to 6 million barrels per day, and residual Iranian smuggling exports of around 1.5 million barrels per day, a net daily supply deficit of approximately 5 million barrels persists, equal to roughly 5% of global output. The IEA action stabilizes sentiment at the margin but does not close the fundamental gap. A sustained return of oil below $100 requires restored freedom of navigation through the Strait of Hormuz, not reserve drawdowns.
Q2. Beyond crude oil, which commodity markets face the most severe secondary disruption from the Hormuz blockade?
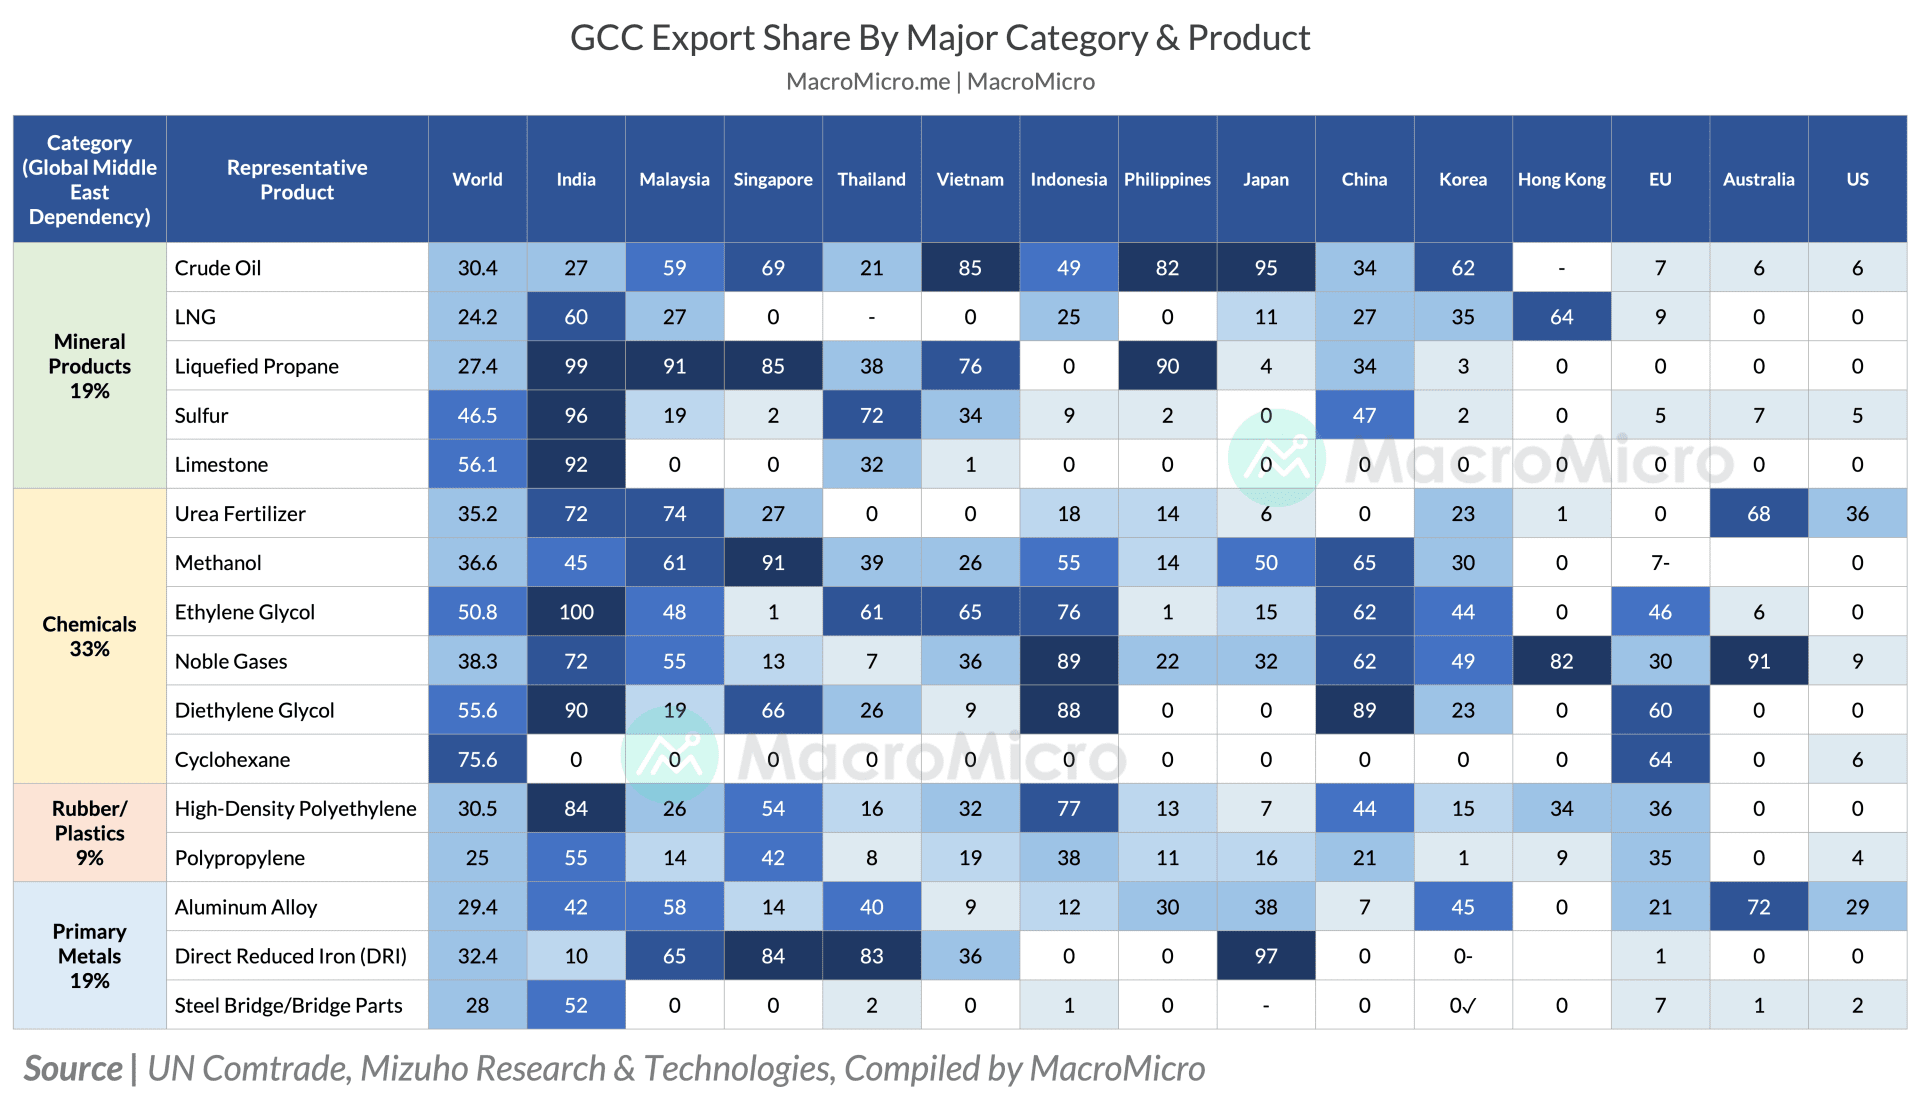
A: The disruption has cascaded into at least four distinct commodity systems, each with limited or no strategic buffer equivalent to the IEA mechanism for oil. In agriculture, GCC producers, comprising Saudi Arabia, the UAE, Bahrain, Oman, Qatar, and Kuwait, account for approximately 35% of global urea export supply; the supply interruption has already triggered price recoveries in soybean, corn, and wheat markets. In semiconductors and medical equipment, GCC countries collectively supply close to 38% of global noble gas exports, including helium essential for chip fabrication cooling and MRI operations. In petrochemicals, Asian refineries dependent on Middle Eastern naphtha and LPG as feedstock have begun announcing shutdowns or capacity reductions, with crack spreads on jet fuel and diesel rising sharply. In metals, GCC producers account for approximately 29% of global aluminum alloy exports, with downstream implications for automotive, aerospace, and construction supply chains. The common thread across these sectors is the absence of coordinated strategic stockpiles, which makes the secondary disruption harder to contain through policy intervention alone.
Q3. How does vulnerability to this energy shock differ across major economies?
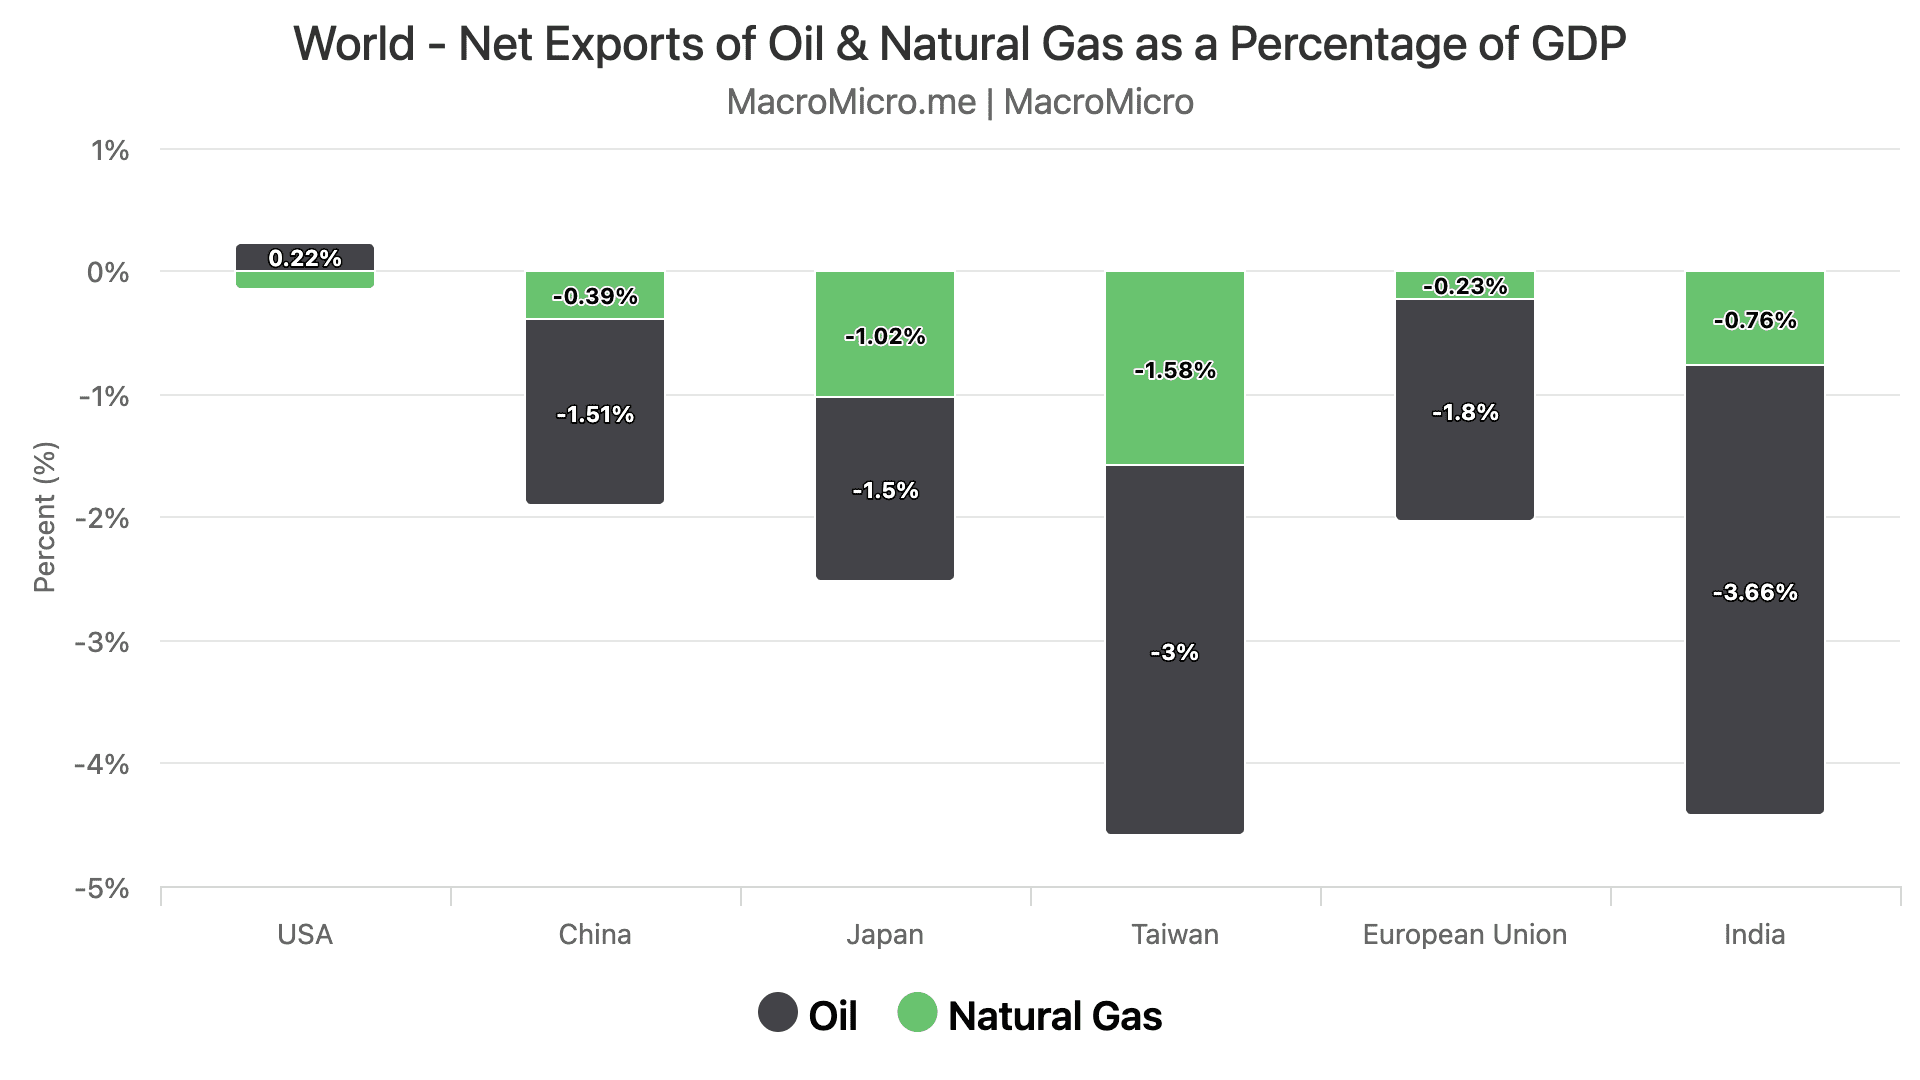
A: The degree of exposure varies considerably based on four factors: net energy import dependence, reliance on Middle Eastern supply, strategic inventory depth, and power generation mix. The United States is the least exposed: it is a net petroleum exporter, its Gulf Coast refineries can substitute Canadian and Venezuelan heavy crude, and the government has activated Jones Act waivers and partial Russian oil sanction relief to manage domestic logistics. Europe and Japan carry net energy import costs of around 2% of GDP but are buffered by substantial inventories, with European crude stocks covering approximately 130 days and Japan's exceeding 200 days. Both economies source less than 20% of their natural gas from the Middle East, with the remainder supplied by Norway, the United States, Australia, and Algeria. China presents a moderate case: roughly...
Track every US–Iran shockwave. Redeem your MM Max trial code to unlock the full report — limited time only.

Already a subscriber? Click here to log in.
Full Access to Our Services

Comprehensive data at your service
with key indicators for investment insights

Exclusive flash reports
on key events and data

Create your own charts and analysis
including performance backtesting

Hub of professionals to engage
in meaningful discussions and insights
 Get answers from MM AI.
-
Why has crude oil remained above $100 per barrel despite the IEA's record reserve release?
💡Crude oil has remained above $100 per barrel despite the IEA's record reserve release because the 400 million barrel release, equating to approximately 2.5 million barrels per day of crude supply, is structurally inadequate against a pre-war Hormuz throughput of 15 million barrels per day of crude. This insufficient buffer, even when combined with Saudi and UAE rerouting capacity and Iranian smuggling exports, results in a persistent net daily supply deficit of approximately 5 million barrels, which is roughly 5% of global output, thereby stabilizing sentiment only at the margin rather than closing the fundamental supply gap.
-
Which commodity markets, besides crude oil, face severe disruption from the Hormuz blockade?
💡Beyond crude oil, the Hormuz blockade has severely disrupted at least four commodity markets: agriculture, semiconductors and medical equipment, petrochemicals, and metals. GCC producers, accounting for about 35% of global urea export supply, have triggered price recoveries in soybean, corn, and wheat. For semiconductors and medical equipment, GCC countries supply nearly 38% of global noble gas exports, including helium. Asian refineries face shutdowns due to interruptions in naphtha and LPG feedstocks, sharply increasing crack spreads on jet fuel and diesel. Finally, GCC producers represent approximately 29% of global aluminum alloy exports, impacting automotive, aerospace, and construction supply chains, with the absence of strategic stockpiles in these sectors exacerbating the disruption.
-
How does exposure to the current energy shock differ among major economies like the US, Europe, and India?
💡Vulnerability to the energy shock differs significantly among major economies based on net energy import dependence, reliance on Middle Eastern supply, strategic inventory depth, and power generation mix. The United States is the least exposed due to its net petroleum exporter status, flexible refinery sourcing, and domestic logistics management. Europe and Japan, while carrying net energy import costs of around 2% of GDP, are buffered by substantial crude inventories covering 130 and over 200 days, respectively, and diversify natural gas sources. China presents a moderate case with 40% of crude imports from the Middle East, but domestic coal and a 1.2-1.3 billion barrel strategic petroleum reserve offer significant buffers. India is the most vulnerable, possessing strategic crude reserves for only 25 to 30 days of domestic consumption.
-
When will the current supply shock transition from impacting equity valuations to affecting earnings estimates?
💡The current supply shock will transition from impacting equity valuations to affecting earnings estimates once the Hormuz blockade extends beyond 90 to 120 days. This duration is critical because strategic reserves will approach depletion, forcing material production curtailment among Middle Eastern producers and removing the daily 150 to 200 thousand barrel per day commercial inventory buffer. Simultaneously, the supply shock will migrate from energy into fertilizer, petrochemicals, and semiconductor inputs, placing pressure on revenue and cost structures across a broader set of sectors, shifting the operative risk framework from multiple compression to earnings estimate reductions if the probability of a ceasefire before the end of June deteriorates from its current 60%.
-
Which high-frequency data streams should investors monitor to track the evolving energy crisis?
💡Investors should monitor five high-frequency data streams to track the evolving energy crisis: Hormuz transit volumes and the Baltic Dirty Tanker Index for early physical signals of maritime bottlenecks; global crude inventory draws to confirm market movement towards a physical shortage; the OVX crude volatility index and the shape of the futures curve, where extreme backwardation indicates stress and flattening towards contango suggests easing physical pressure; rate expectations, particularly whether central banks delay or reverse easing paths due to energy-driven inflation; and Polymarket ceasefire odds for real-time insights on diplomatic traction, with the Xi-Trump summit as a nearest catalyst.
-
Why did the Federal Reserve recently raise its long-run GDP growth and neutral interest rate forecasts?
💡The Federal Reserve recently raised its long-run GDP growth forecast to 2.0% from 1.8% and the neutral rate to 3.125% from 3.0% primarily reflecting observed productivity gains that began four to five years ago, rather than forward-looking AI projections. Powell explicitly stated that generative AI has not yet shown up in the numbers, attributing the gains to firms reorganizing and becoming more efficient in response to early 2020s labor shortages. While AI is expected to extend this trend, the near-term revisions are rooted in past productivity. A higher neutral rate implies a higher equilibrium cost of capital, a structural implication for investors regardless of short-term Fed actions.
