What You Should Know
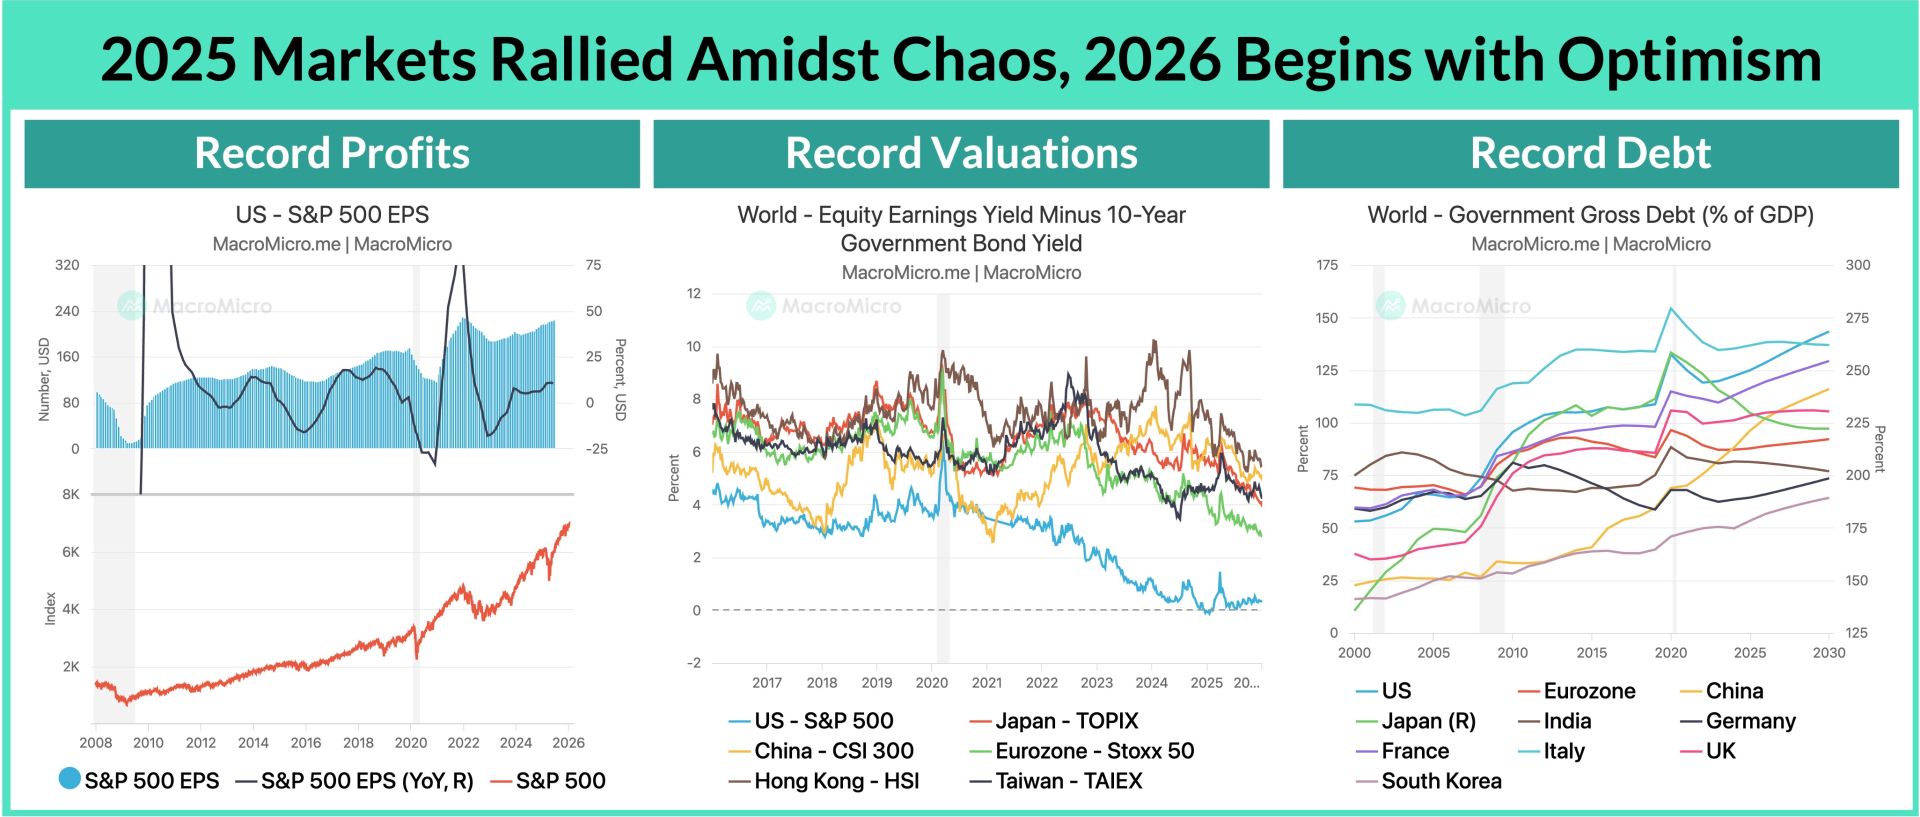
Equity markets climbed through chaos in 2025. By year-end, all three major US equity indices delivered double-digit returns, while Asian equities performed even more impressively. Taiwan equities closed the final trading session at a new all-time high above the 29,000 mark, and South Korea’s equity market surged by more than 70%.
At the same time, economic data and corporate earnings continued to post extraordinary growth, while valuations rose to historical extremes. Yet beneath this relentless upward pressure on the data, structural shifts in the macro environment have only intensified.
As we christen this new year, we present what we see as the ten most critical charts for 2026. We believe 2026 will be a year of “performance validation”, in which markets reassess: growth sustainability, AI commercialization, Federal Reserve independence, liquidity conditions, and long-term structural dynamics.
Key Takeaways:
- As the productivity cycle transitions from Phase II (software takeoff) to Phase III (hardware–software integration), AI technologies will increasingly face real-world commercialization tests. Meanwhile, the exceptionally high base set in 2025 raises the bar for continued growth. We assess growth sustainability and the pace of AI adoption through: 1) Taiwan exports, 2) NVIDIA inventory levels, 3) Large language model penetration, and 4) Edge AI revenue.
- With global debt levels rising, interest rates must remain stable. As the Federal Reserve approaches a leadership transition in 2026, will liquidity tighten again? We examine Fed independence and liquidity conditions via: 5) MM AI Hawk–Dove Index, 6) Inflation data, 7) Bank excess reserves, and 8) the SOFR–IORB spread.
- In 2026, liquidity is expected to fade into the background, acting more as a buffer than a growth driver, while fundamentals reclaim center stage. We assess global end-demand and debt sustainability through: 9) US consumption data and 10) the spread between US economic growth and interest rates.
I. Productivity Enters Phase III — 2026 as the AI Validation Year
Throughout last year, we highlighted Taiwan exports as a leading indicator for the global technology cycle. We noted that total exports needed to hold above USD 40 billion in the first half of 2025, with USD 44 billion as a desirable benchmark in the second half, supported by the seasonal electronics upcycle.
Looking at the final outcome, when Taiwan exports surged to nearly USD 57 billion in July, it became clear that 2025 would be a banner year for the technology sector and tech equities. The eventual figure exceeded USD 60 billion—far above expectations—confirming that the rally was not merely driven by temporary tariff-related front-loading, but by genuine demand tied to the productivity cycle.
The explosive growth of AI in 2024 also pushed the base effect sharply higher for 2025. As the productivity cycle moves from Phase II to Phase III, AI technologies are now facing a critical test on the application side. Meanwhile, concerns about an AI bubble have gradually intensified. Whether supply-chain demand can remain robust and sustain elevated revenue growth will be key to supporting equity valuations.
Looking ahead, we advise investors to closely monitor March, July, and October. If absolute export levels merely hold steady at November’s USD 64 billion, year-on-year growth would decelerate sharply—to 28% in March, 11% in July, and just 2% in October. Conversely, if Taiwan exports climb above USD 70 billion per month in the first half of the year...
This article is exclusive to subscribers. As we celebrate 10 years of MacroMicro, we're giving back. If you're not a subscriber yet, take advantage of this special anniversary gift — join MM Max Annual and gain full access to all our charts, reports, including the 2026 market outlook, and more. Subscribe Now»
Already a subscriber? Click here to log in.
Full Access to Our Services

Comprehensive data at your service
with key indicators for investment insights

Exclusive flash reports
on key events and data

Create your own charts and analysis
including performance backtesting

Hub of professionals to engage
in meaningful discussions and insights

