Bitcoin has had a defining year in 2025. After surging past its previous records to hit an all-time high of over $126,000, the market has since cooled, currently stabilizing in the $90,000 range. The post-2024-halving supply shock and the institutional wave that began with Trump’s pro-crypto stance laid the foundation for this cycle—but today’s price action is increasingly shaped by fresh catalysts: the US Commodity Futures Trading Commission's (CFTC) December 2025 approval of federally regulated spot Bitcoin trading, sustained global liquidity reacceleration, record ETF inflows, and nation-state balance-sheet interest.
With volatility still extreme, recent pullbacks underscore the for rigorous tools that sift through mixed signals. In this article, we present our six essential charts to help you interpret the current market structure. With prices retracing from their highs and sentiment shifting, these indicators offer a data-driven roadmap to distinguish between a healthy correction and a bear market turn.
For newcomers or veterans alike, these charts empower data-driven navigation in a market where sentiment can swing wildly. All charts below and more than a hundred more are available on our newly released Crypto Intelligence Dashboard, designed to give you real-time access to the pulse of the digital asset economy.
I. Detecting Bubbles: Monitoring Liquidity & Valuation Metrics
With Bitcoin trading roughly 28% below its 2025 peak, questions about valuation are paramount. Is the market overextended, or is this a consolidation buying opportunity?
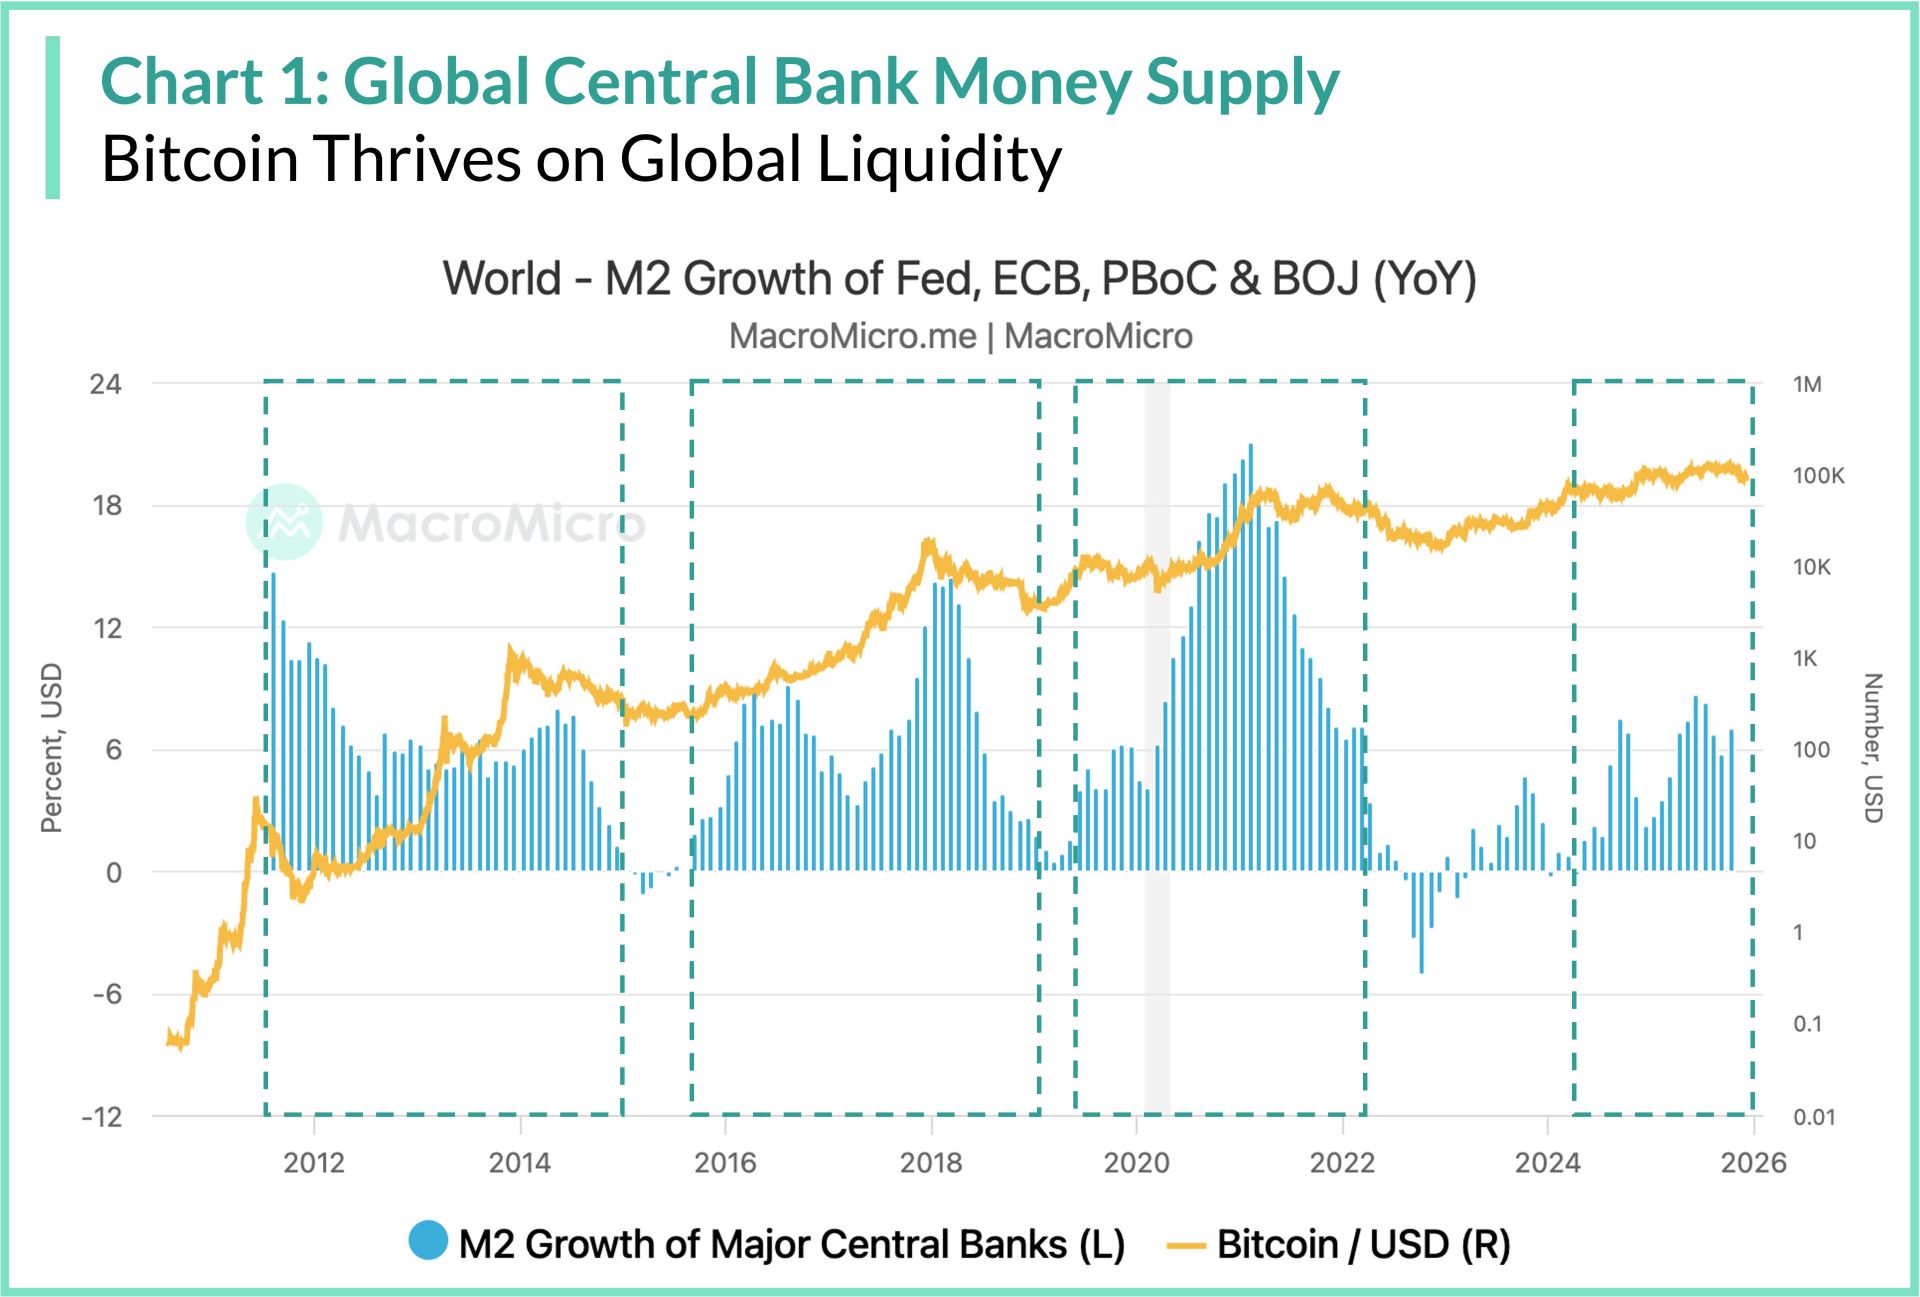
Indicator 1: Global Central Bank Money Supply
Bitcoin thrives in environments of monetary expansion due to its fixed 21 million supply cap, positioning it as a hedge against fiat debasement. Bitcoin continues to act as a liquidity sponge, exhibiting a strong correlation with global M2 money supply. In 2025, we have witnessed a "Liquidity Wave," with global M2 expanding past $113 trillion. Major central banks have maintained pro-growth policies, and the resulting fiat expansion has provided a high floor for scarce assets like Bitcoin. We track this annual M2 growth from major central banks (Fed, ECB, Bank of Japan, People's Bank of China), highlighting periods of correlation since the 2008 crisis.
Unlike the contraction seen in 2022, the current trend is upward. The continued growth in global liquidity suggests that the macro backdrop remains supportive of Bitcoin's long-term appreciation, despite short-term price volatility.
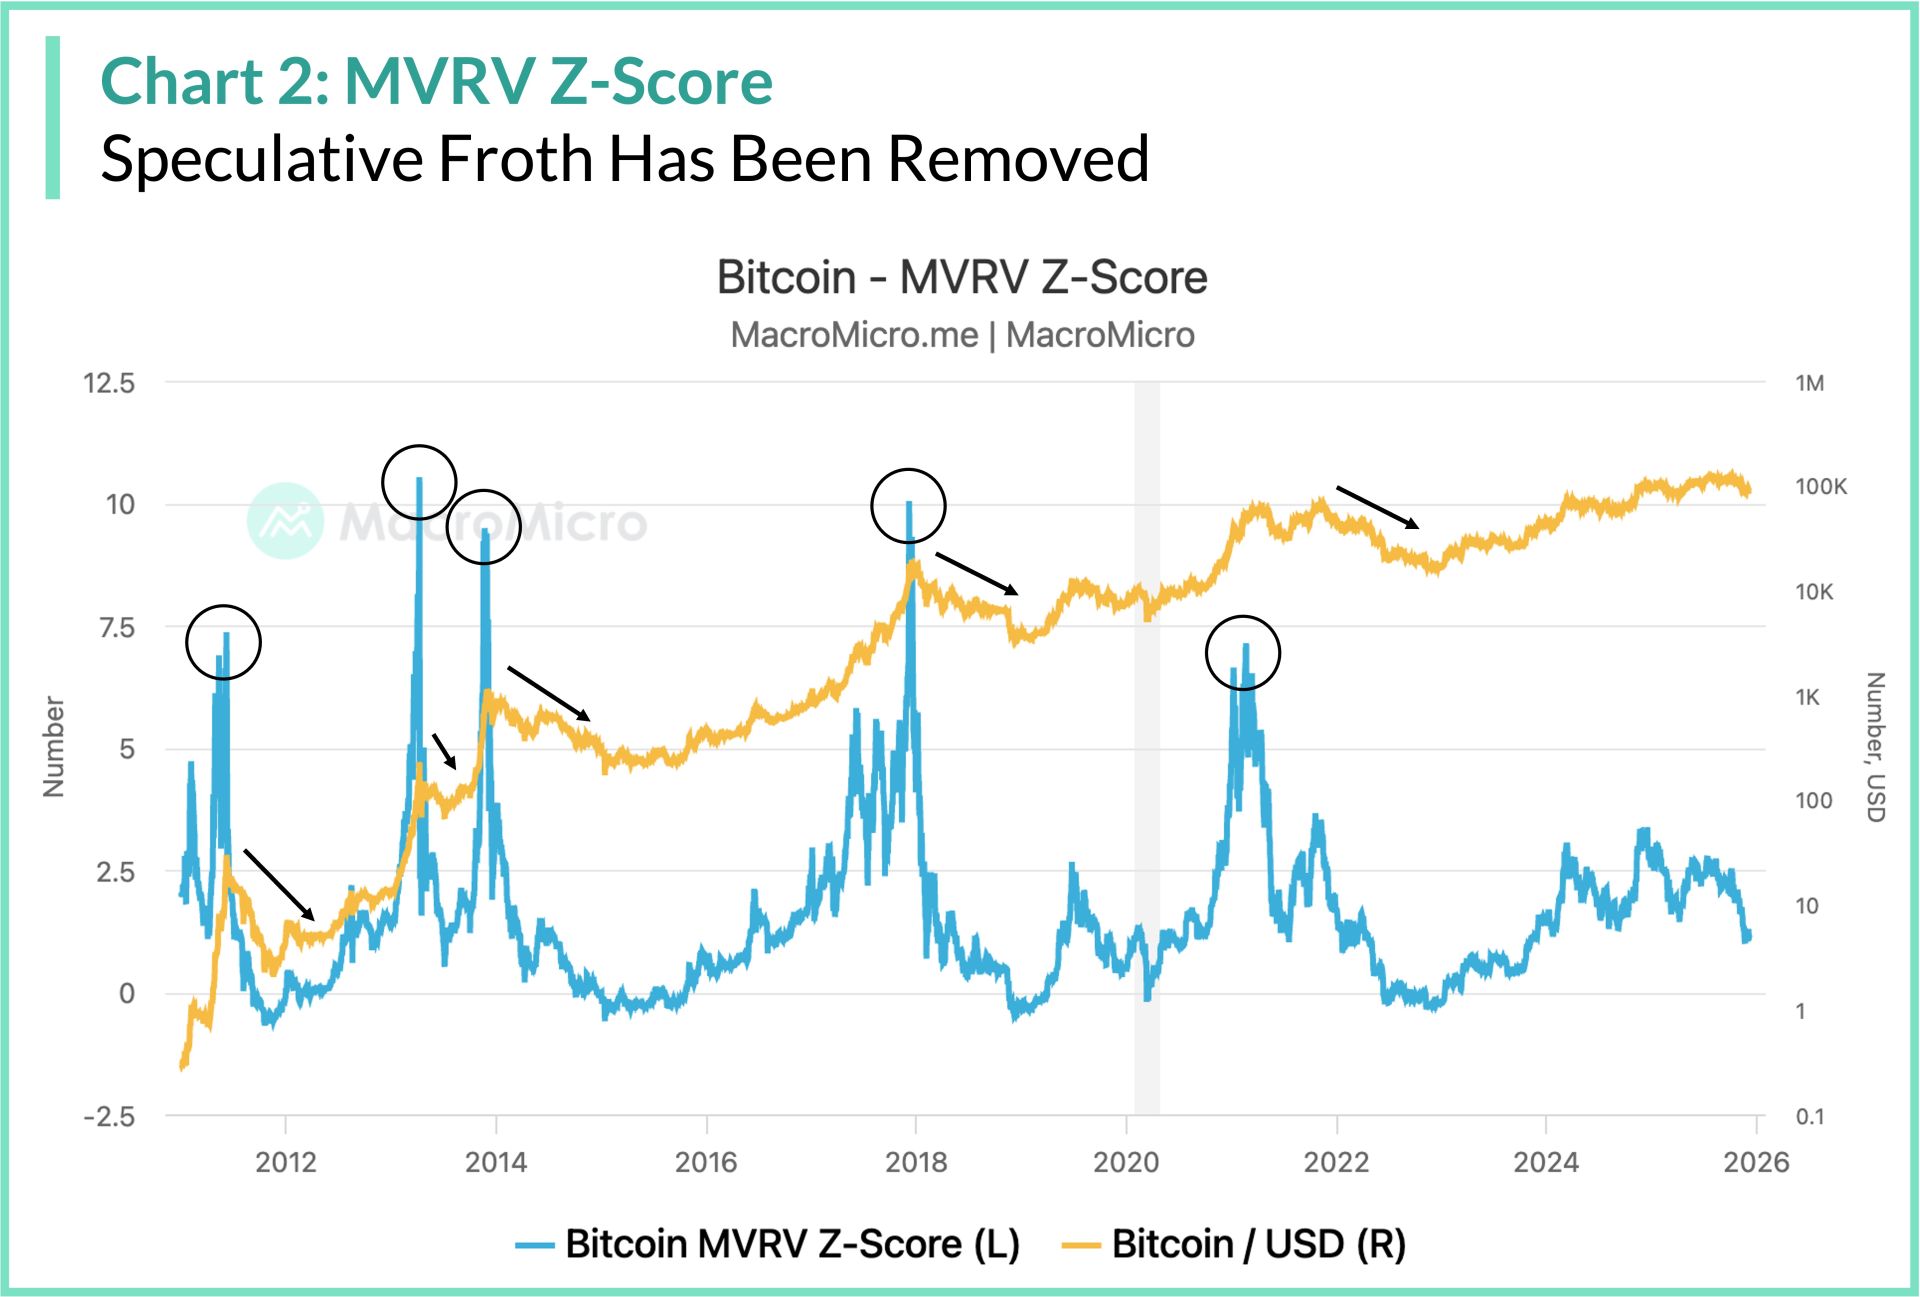
Indicator 2: Bitcoin MVRV Z-Score
The MVRV-Z Score (Market Value to Realized Value) remains one of the most reliable detectors of market tops and bottoms. Calculated as (Market Cap – Realized Cap) / Standard Deviation of Market Cap, the MVRV Z-Score gauges over/undervaluation by comparing current prices to the blockchain-realized value (last-moved UTXO prices). Sharp spikes signal bubble risks, as seen in past tops. A score above 7.0 typically signals a bubble peak, while a score below 0.1 often marks a generational bottom.
Currently, the Z-Score has been steadily decreasing from its year high peak and hovering around 1—very much well below historical peaks (e.g., 7+ in 2021). This is a stark contrast to the overheated readings we saw earlier this year when price discovered new highs. The current low score suggests that speculative froth has been completely flushed out of the market. Historically, buying when the Z-Score is in this neutral-low territory has offered an attractive risk-reward ratio for long-term holders.
II. Timing Entries Through the Miner's Lens
Mining economics set the "hard floor" for Bitcoin's price. When the market price approaches the cost of production, selling pressure from miners tends to evaporate as they refuse to sell at a loss.
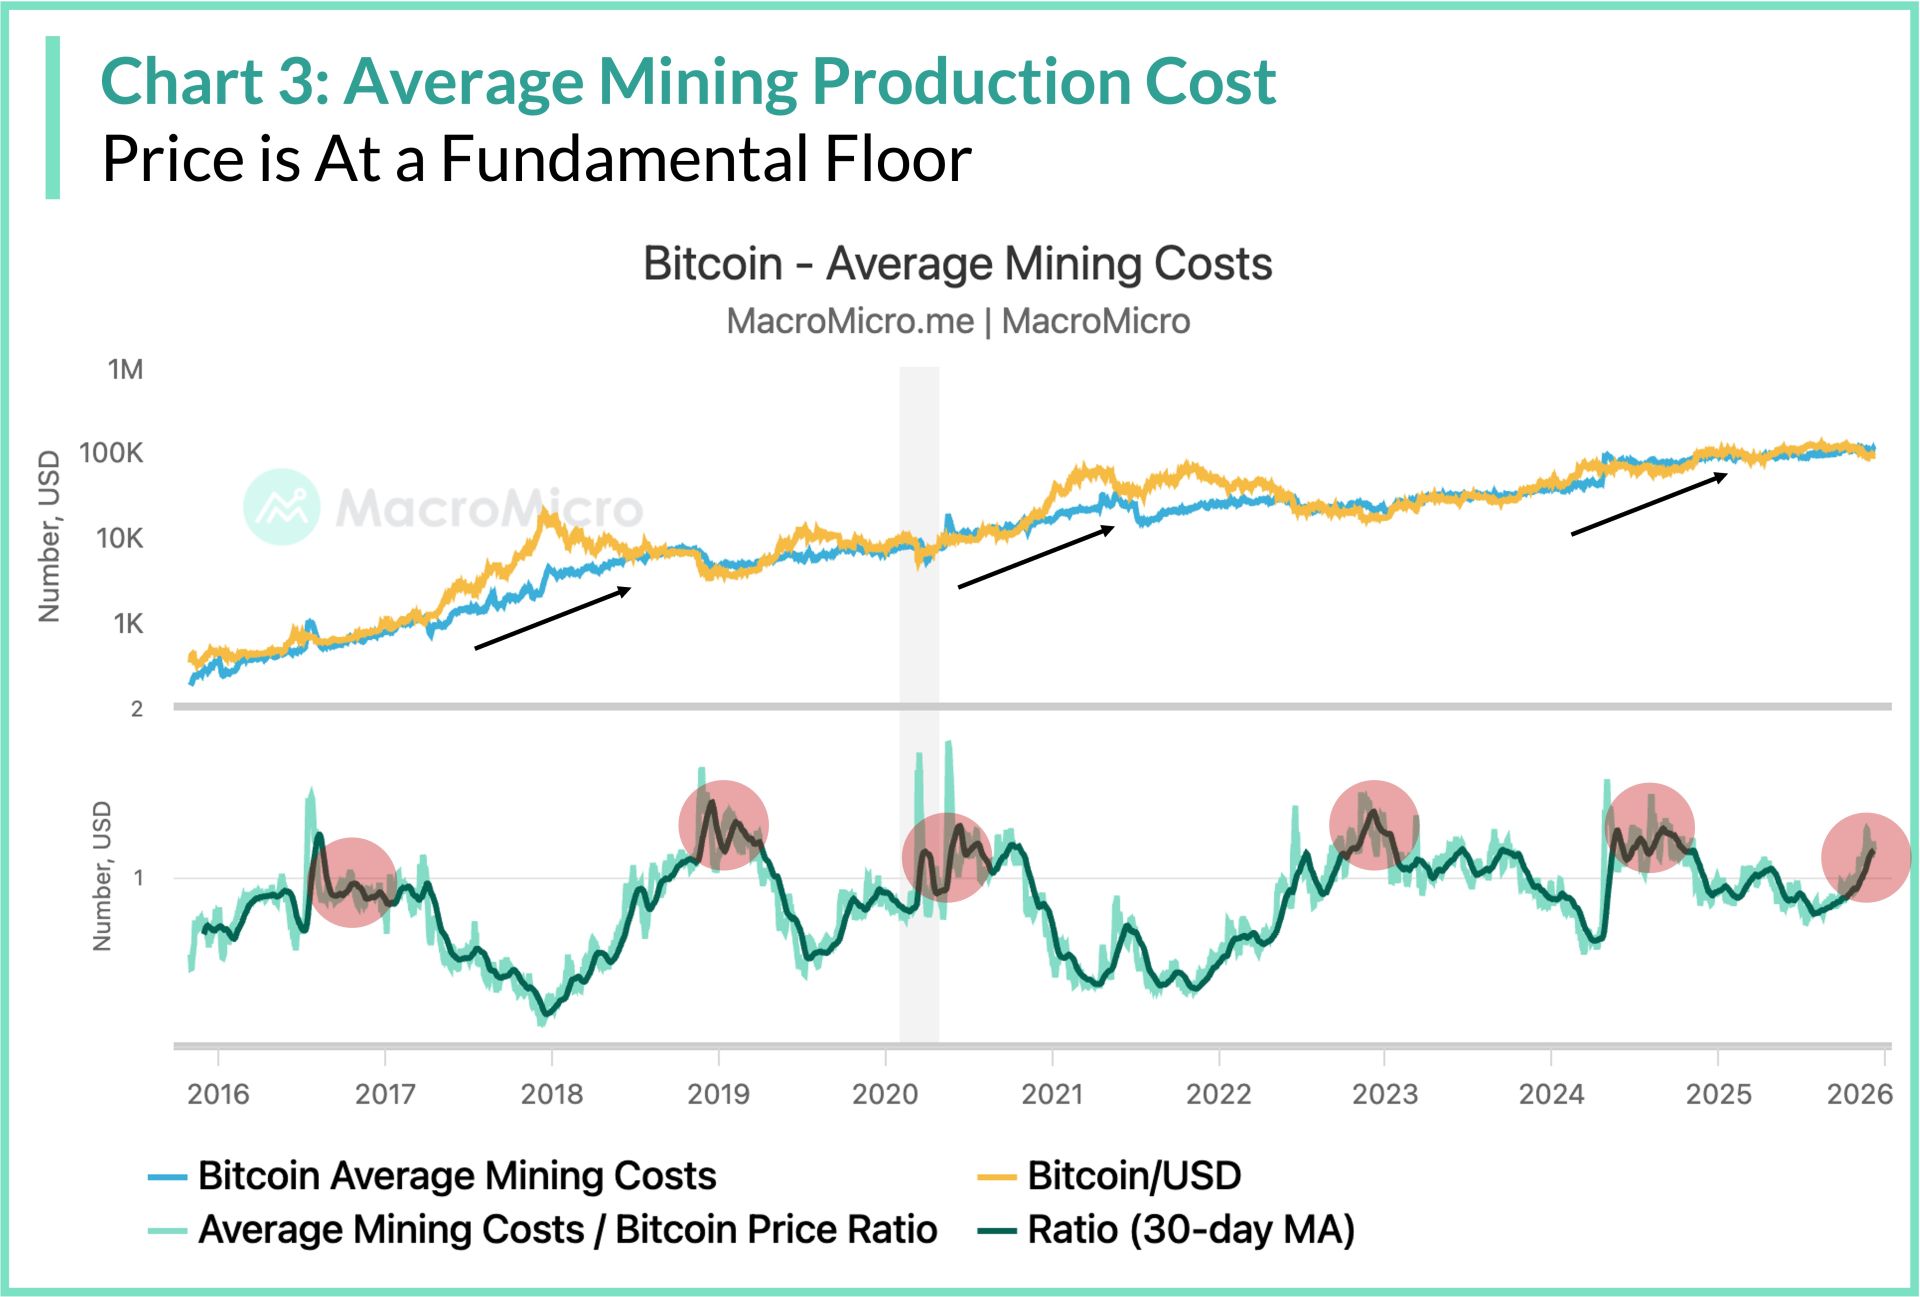
Indicator 3: Average Bitcoin Mining Cost
Drawing from Cambridge University's global electricity consumption and daily issuance data, this metric estimates mining costs. Prices dipping below costs (Mining Costs-to-Price Ratio >1) historically trigger miner capitulation, reducing sell pressure and sparking rebounds.
The cost of mining has risen sharply in 2025, driven by record-high network difficulty and energy prices. This puts the Mining Costs-to-Price Ratio at 1.15, meaning the average miner now loses money on every Bitcoin they produce.
This is a state of "miner capitulation." Historically, when the price falls below the cost of production, less efficient miners are forced to shut down their operations and sell off their holdings to cover costs. This period of forced selling creates downward pressure but also removes future supply from the market, setting the stage for a powerful recovery once the capitulation is complete. This crossover has been one of the most reliable long-term buying signals in Bitcoin's history.
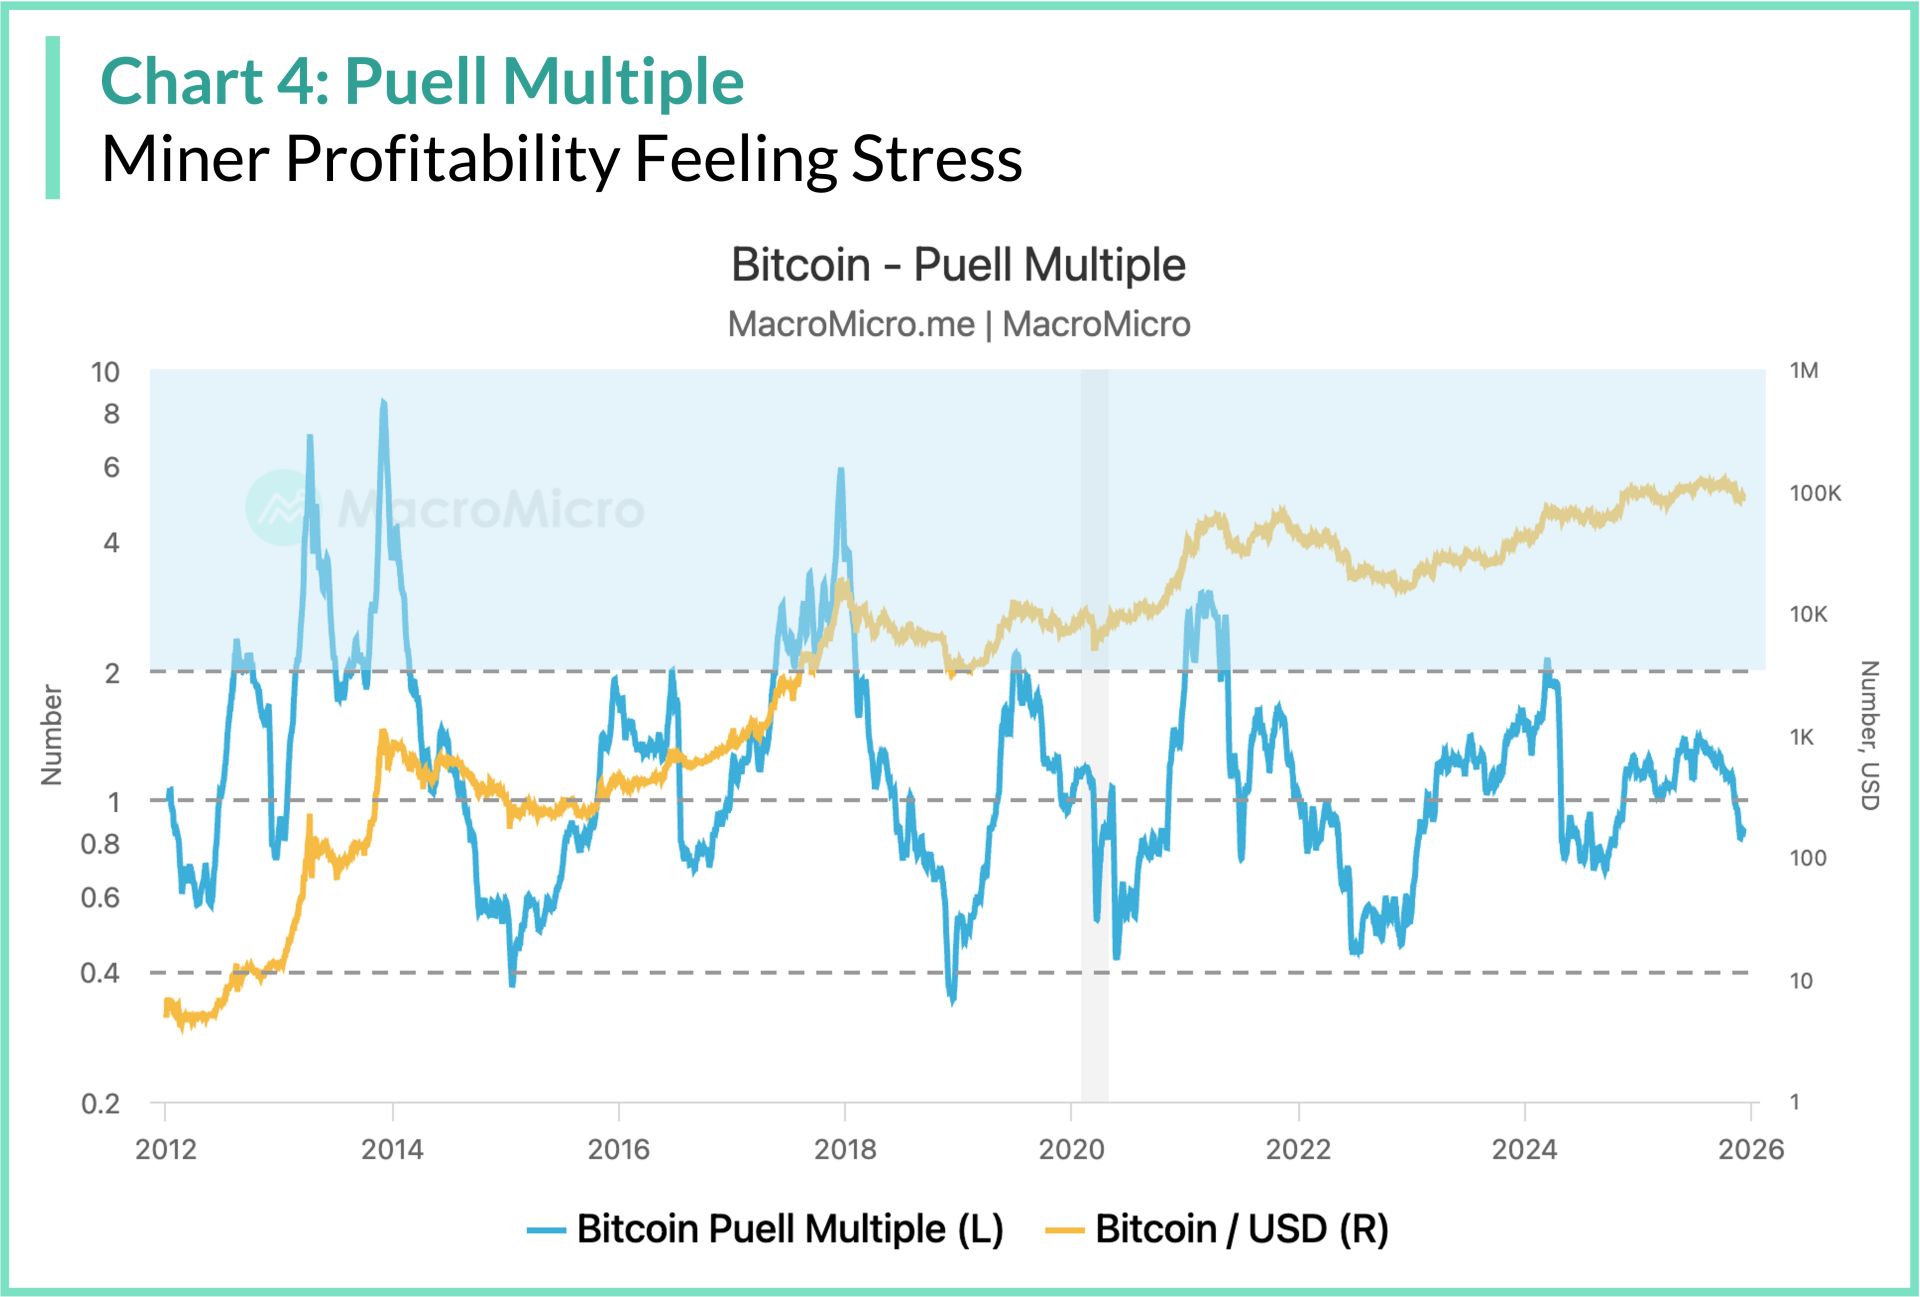
Indicator 4: Puell Multiple
This ratio—calculated as daily USD issuance / 365-day moving average—tracks miner profitability. Values >1 denote above-average revenue; <0.6 signals bear bottoms from miner stress, while >2 flags overvaluation.
The Puell Multiple currently sits below 1.0, reinforcing the signal from the previous production cost metric. While we are not yet in the bottom zone, the current trajectory suggests miners are under significant stress, a key ingredient for forming a definitive market floor.
III. Gauging Sentiment & Flows
Finally, we look at who is buying and how they are feeling—often the best contrarian signals available.
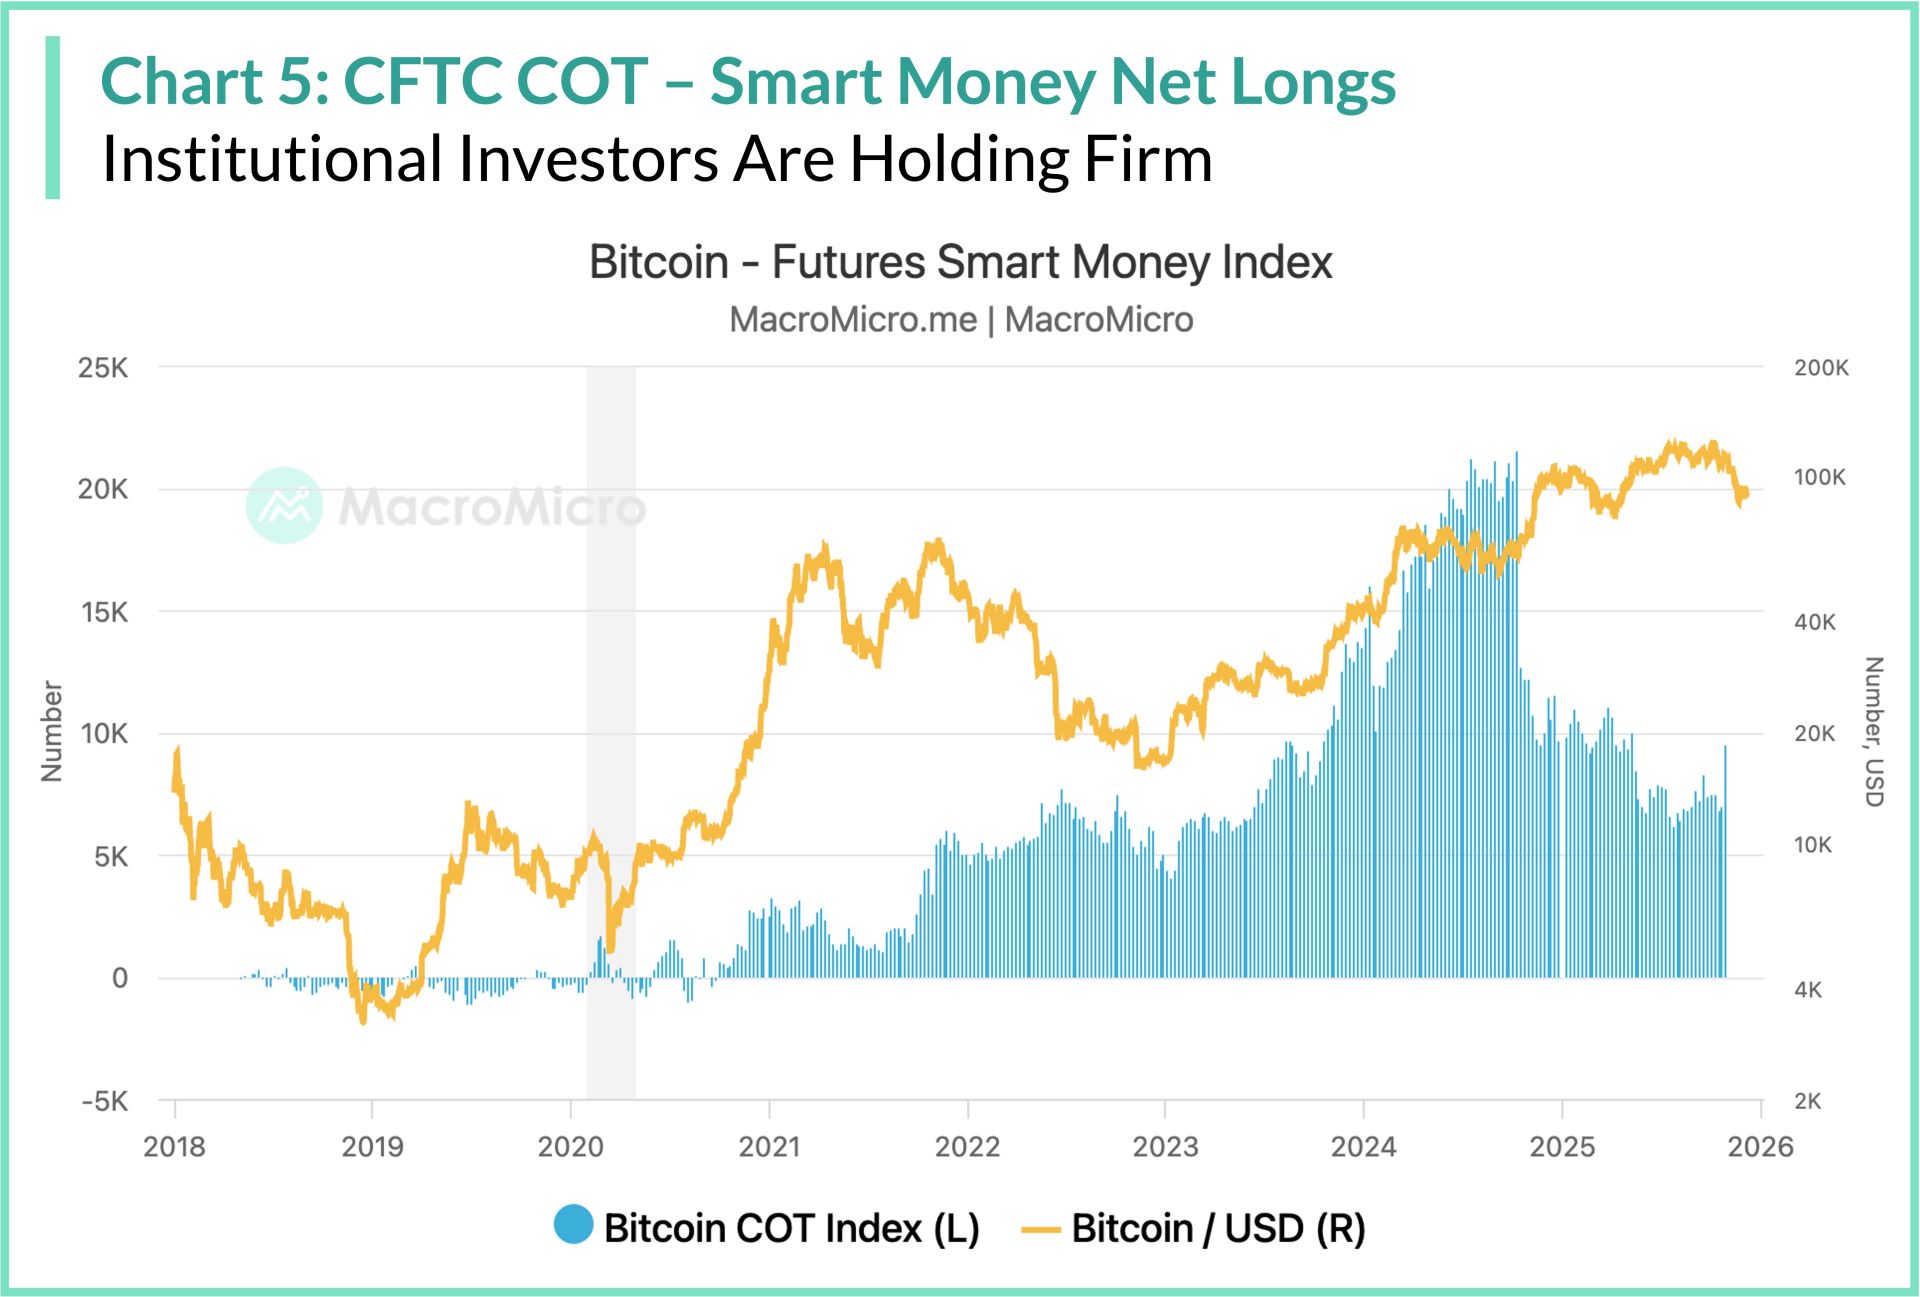
Indicator 5: Smart Money
The weekly COT report dissects Bitcoin futures positions among asset managers and large speculators, spotlighting bullish/bearish tilts. Net longs from "smart money" often precede rallies.
Institutional flows have remained resilient throughout the 2025 correction. The report shows that Asset Managers have largely maintained their net long positions, treating the dip from $126,000 as a re-accumulation event rather than an exit. The "smart money" is not panic selling; they are holding the line.
Indicator 6: Crypto Fear & Greed Index
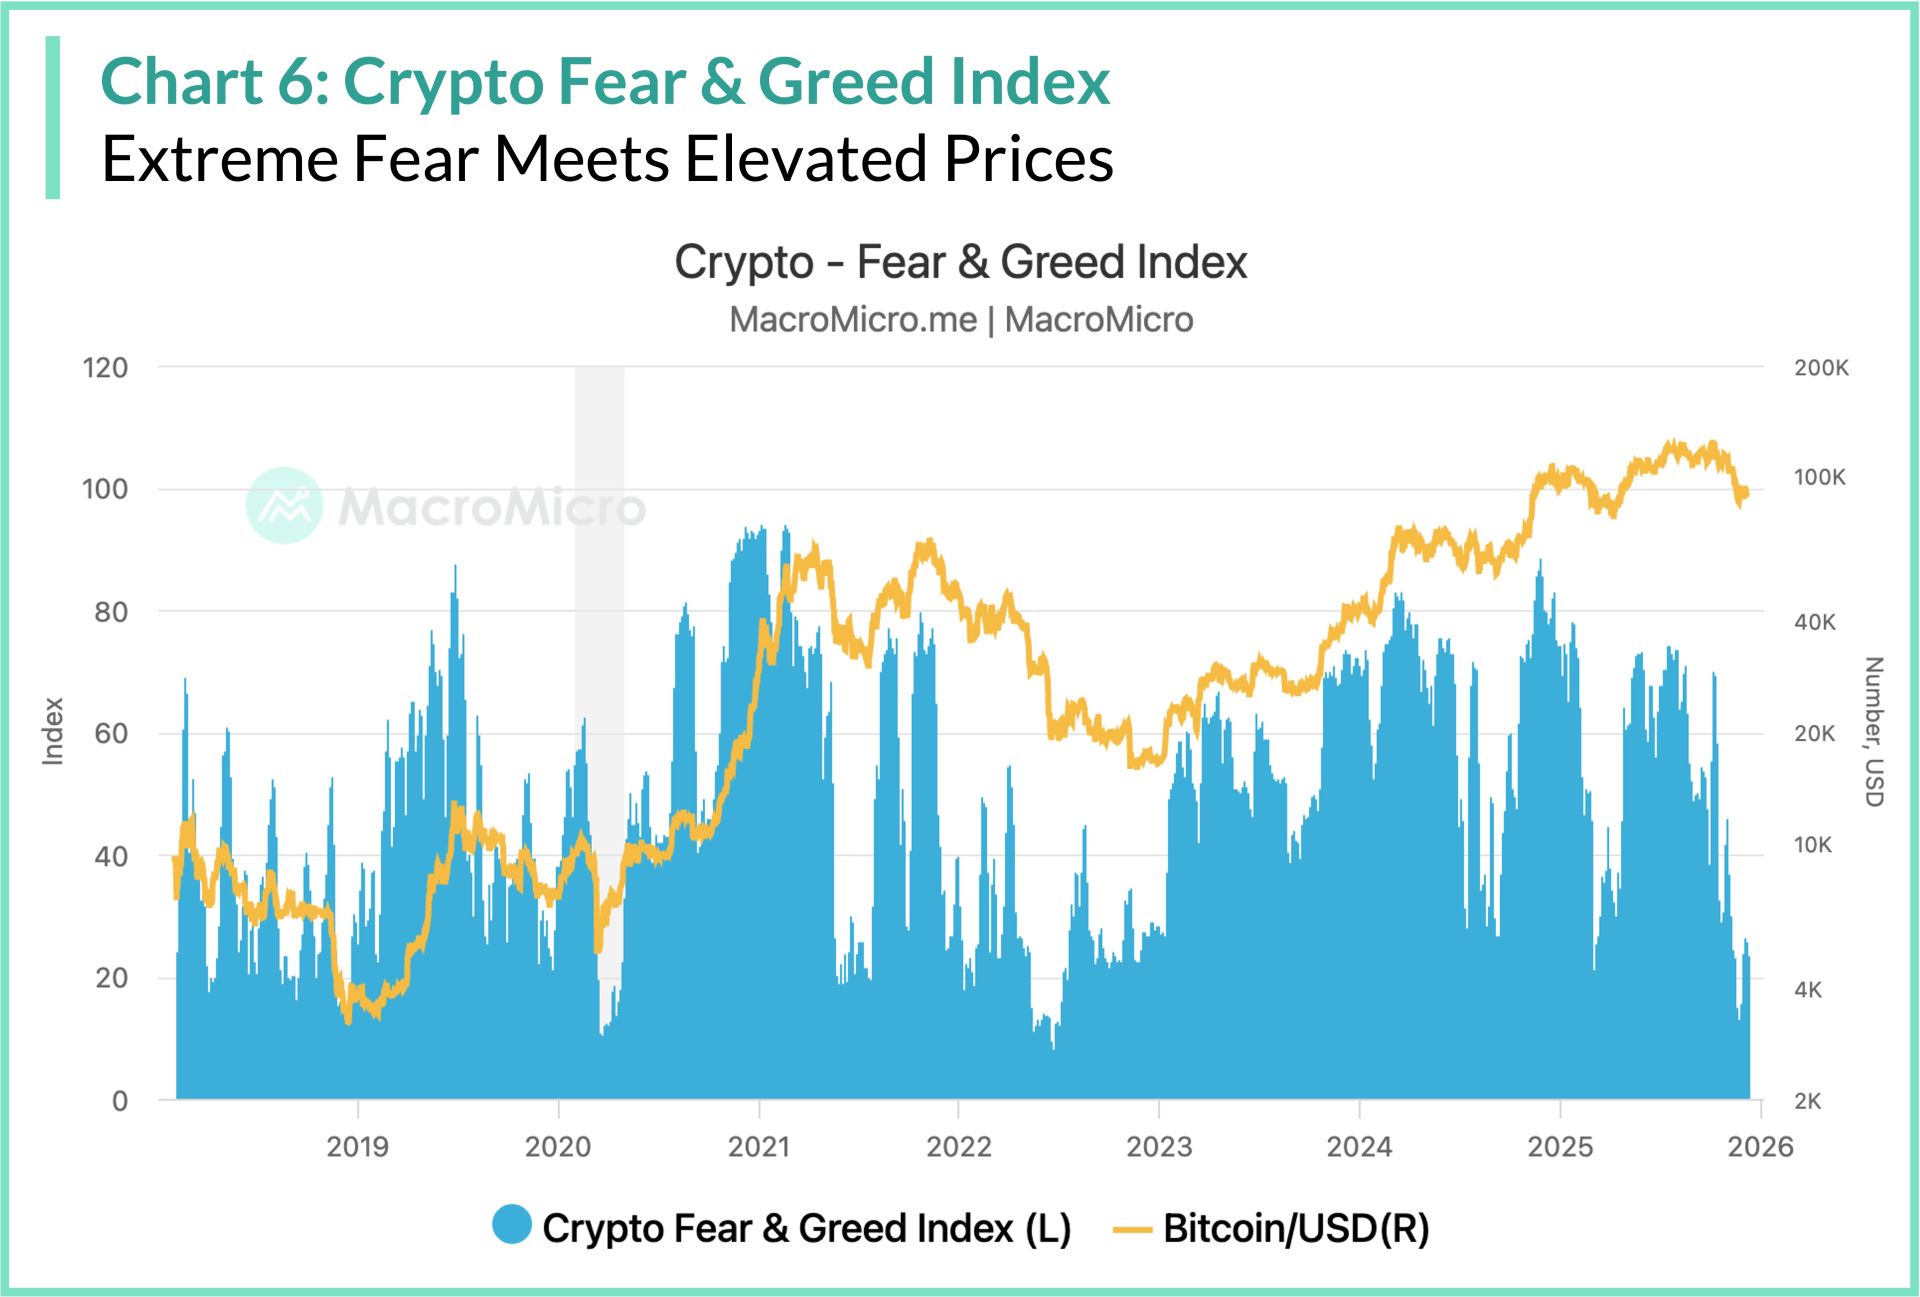
This composite (0-100) aggregates price momentum, social buzz, Bitcoin dominance, and search volume. Extremes act as contrarian signals: >75 (greed) warns of tops; <25 (fear) hints at bottoms.
Currently, the index reads in the low to mid 20s—extreme fear—mirroring the recent 30% pullback from peaks. This echoes 2022 lows that birthed the bull run. "Extreme Fear" typically occurs after a correction when retail investors expect further downside. Historically, these periods of maximum pessimism have frequently marked the turning point before a trend reversal to the upside.
MM Research Insights
Bitcoin's journey in 2025—from halving shocks to regulatory breakthroughs—reinforces that fundamentals cut through noise. While the euphoria of the early 2025 highs has faded, the underlying fundamentals suggest a market that is structurally sound and potentially undervalued.
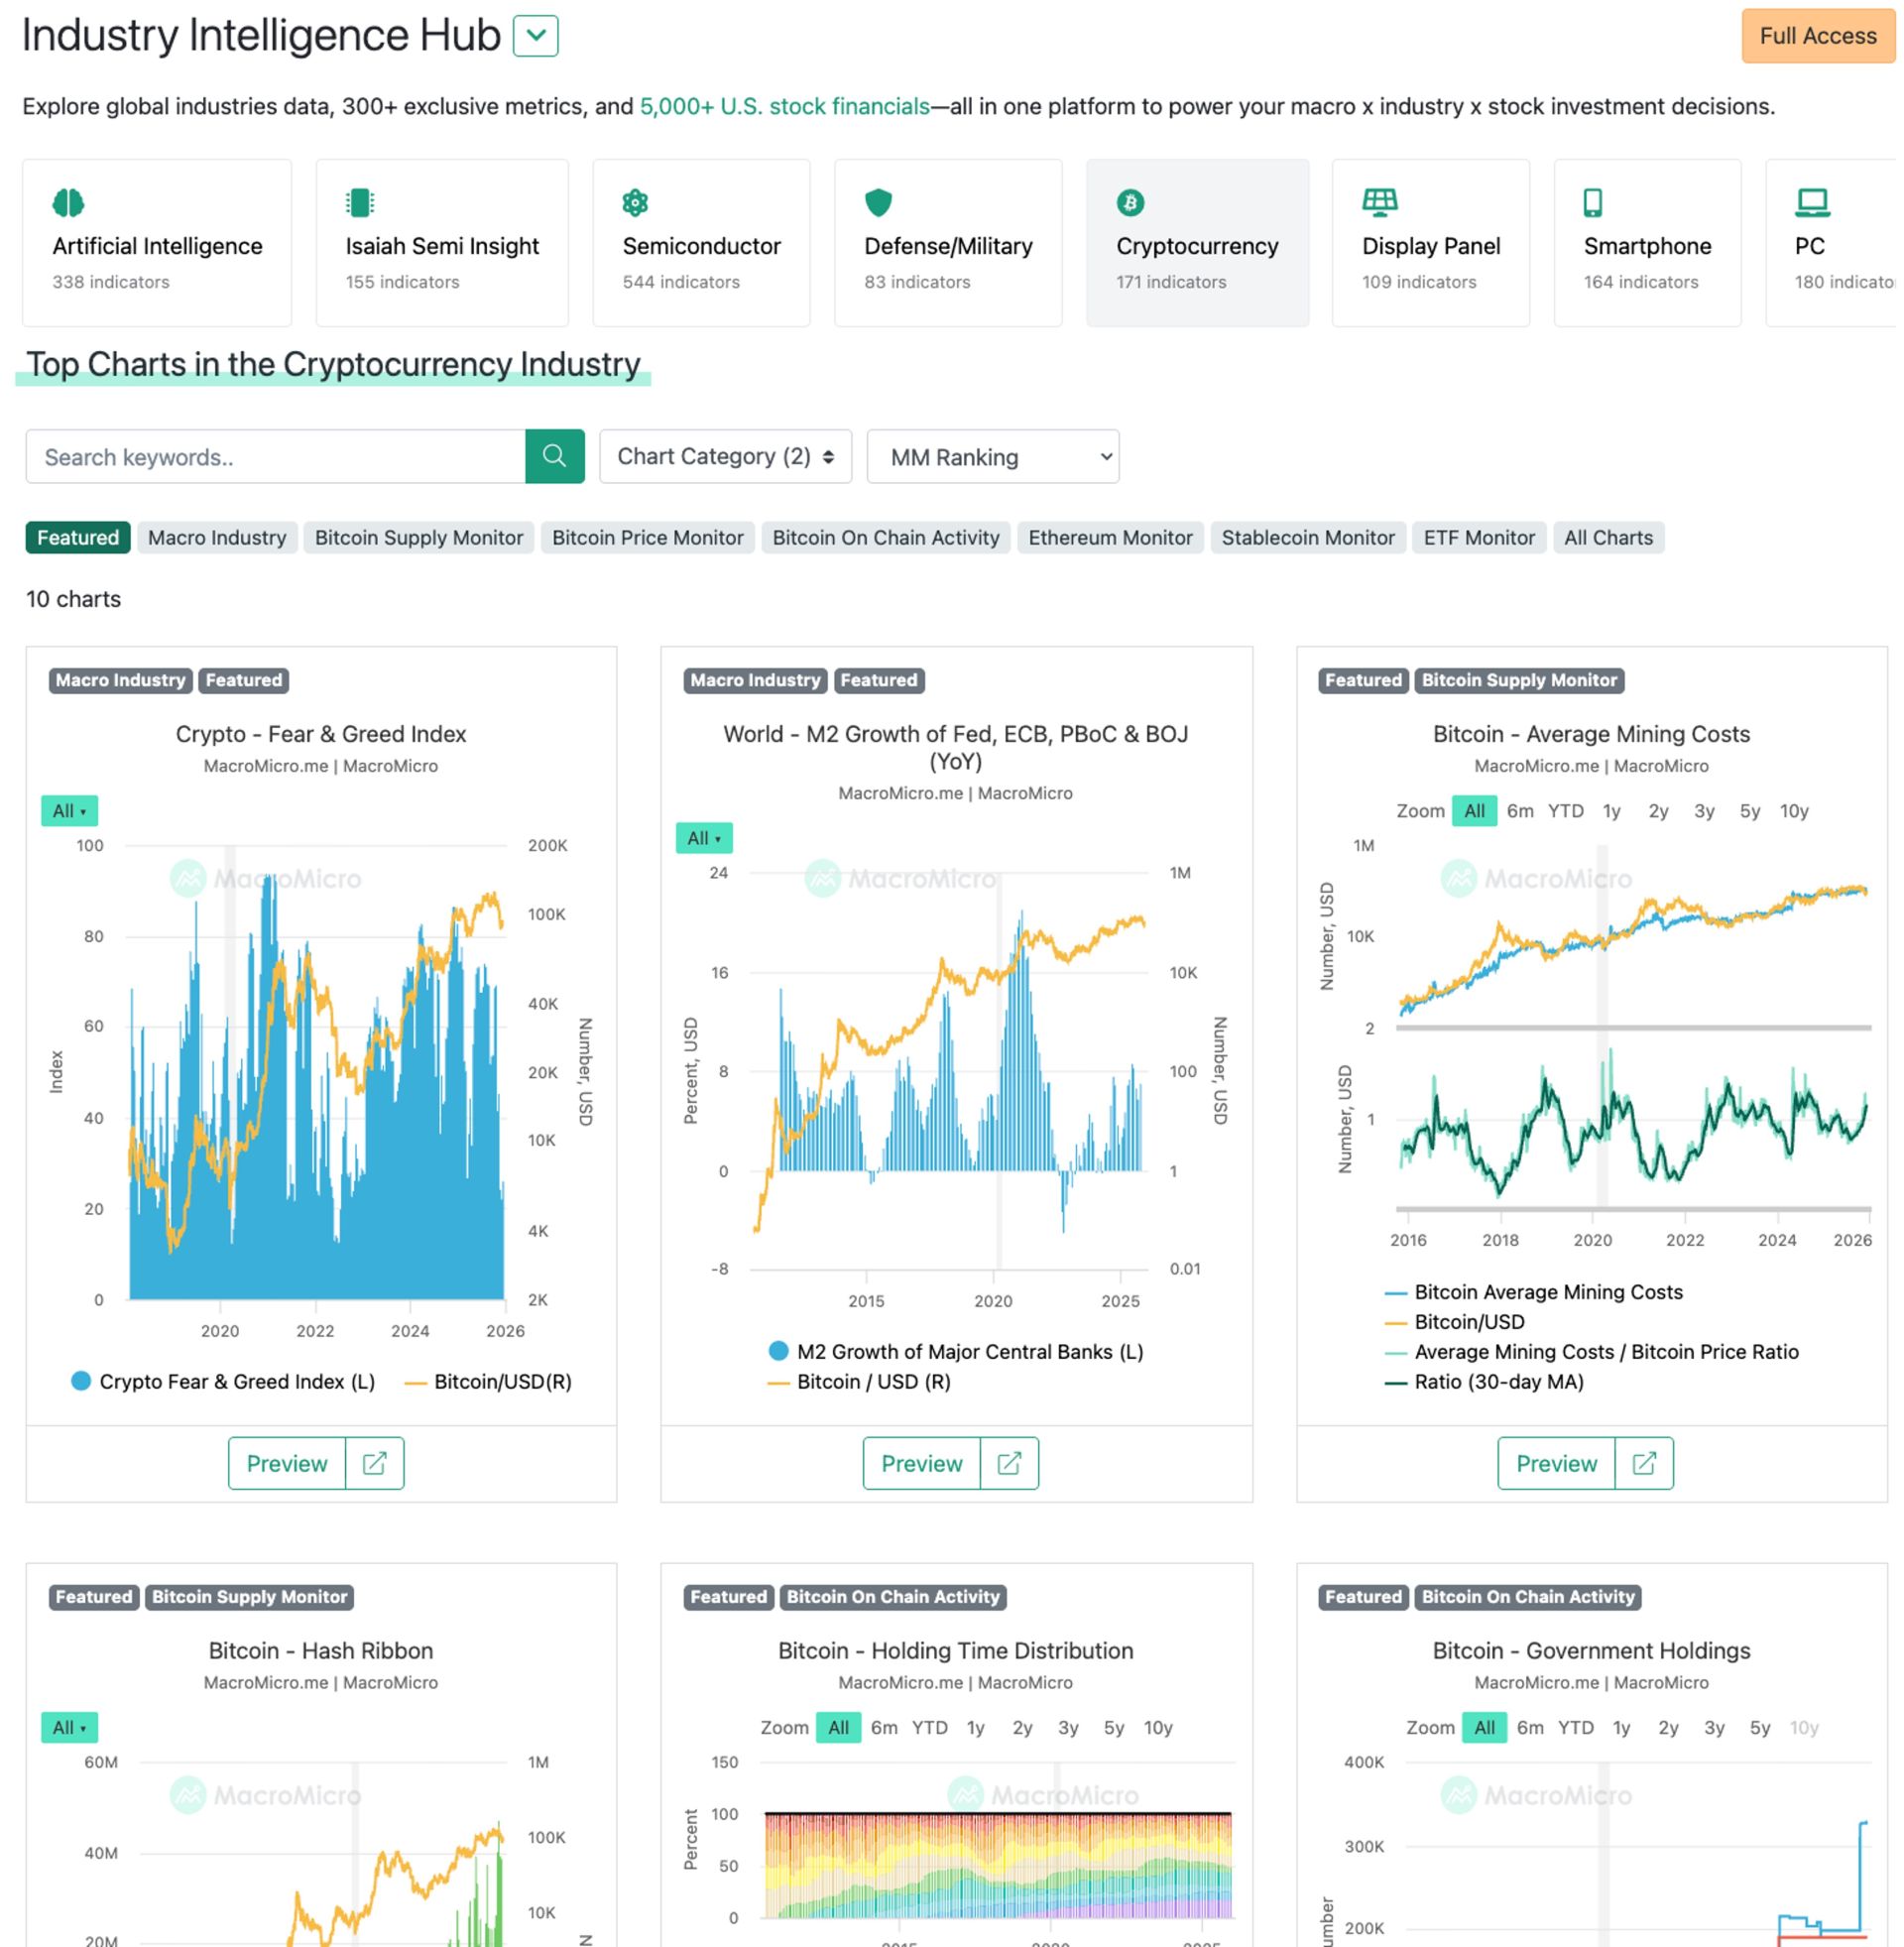
These charts and more than a hundred more now live on the new Cryptocurrency Dashboard on our Industry Intelligence Hub, updated in real time to equip you to decode cycles and mitigate risks.
Author: MacroMicro (Jordan)
