What You Should Know
The Fed turned to rate hikes at its September meeting, and long-term Treasury yields have kept climbing. Core PCE rebounded to 0.25% MoM in the release at the end of September, above the 0.2% safe threshold set out by NY Fed President Williams, and the September dot plot now shows two quarter-point hikes this year, up from none in June. Ten-year and 30-year Treasury yields are back at levels last seen in the 2000s. Growth data remain firm: Q2 GDP was revised up to 2.2% annualized from 1.5%, with consumption contributing 2.5 percentage points.
These moves raise two questions. Does a hike after five years of above-target inflation mark the start of a tightening cycle, and do 30-year yields at 2000s highs point to a shortage of liquidity? We think the answer to both is no. MacroMicro's own research analyst, Ralice, broke all this down as part of our Q4 2026 Economic Outlook.
Key Takeaways
- Why did the Fed hike? Inflation has been above 2% for more than five years, and the US-Iran conflict is a second supply shock after last year's tariffs, which made it harder to look through. The Fed's own projections show growth above its 2% long-run rate through 2029, which gave it room to act.
- Is inflation spreading? Wage growth is 3.1% YoY and sticky CPI is still decelerating, so pressure is concentrated in energy. The oil rally becomes a high base in 2027, and AI hardware price increases are already narrowing. We expect two hikes this year and a pause in 2027.
- Why are long-term yields rising? After the September meeting the main driver was the real yield, which reflects upgraded growth expectations, and the term premium has risen since July. Auction demand and bank lending capacity are intact. Governments are shifting issuance toward bills, recruiting new buyers and strengthening repo backstops.
- Can the debt burden be carried? The global gap between interest rates and growth has been flat since 2024, and US nominal GDP growth exceeded 6% in both Q1 and Q2. If bonds are needed, we favor short-dated US Treasuries.
I. The Fed Turns to Hikes: Inflation Pressure Is Concentrated in Energy & the Economy Can Absorb It
The September hike raised a direct question: did the Fed see something in inflation that the market missed? Escaping inflation would show up as price increases broadening beyond fuel, wages feeding back into prices, and no relief in sight for energy. The data show none of the three. What they show is an economy strong enough that the Fed chose to tighten.
Core PCE Rebounds to 0.25% MoM, but the Trend Keeps Easing
The concern started with the monthly rebound: headline PCE rose 0.31% MoM (previous: 0.05%) and core PCE rose 0.25%, above the 0.2% threshold. The components show where it came from. Gasoline was the main driver, lifting nondurable goods by 0.5% MoM (previous: -0.4%) and transportation by 1.4% (previous: 0.2%). Food services and accommodation rebounded to 0.5% (previous: -0.1%), and other services to 0.9% (previous: 0%). The largest moves sit in fuel-linked categories and the services gains follow weak prior readings, so the monthly print overstates the underlying pace.
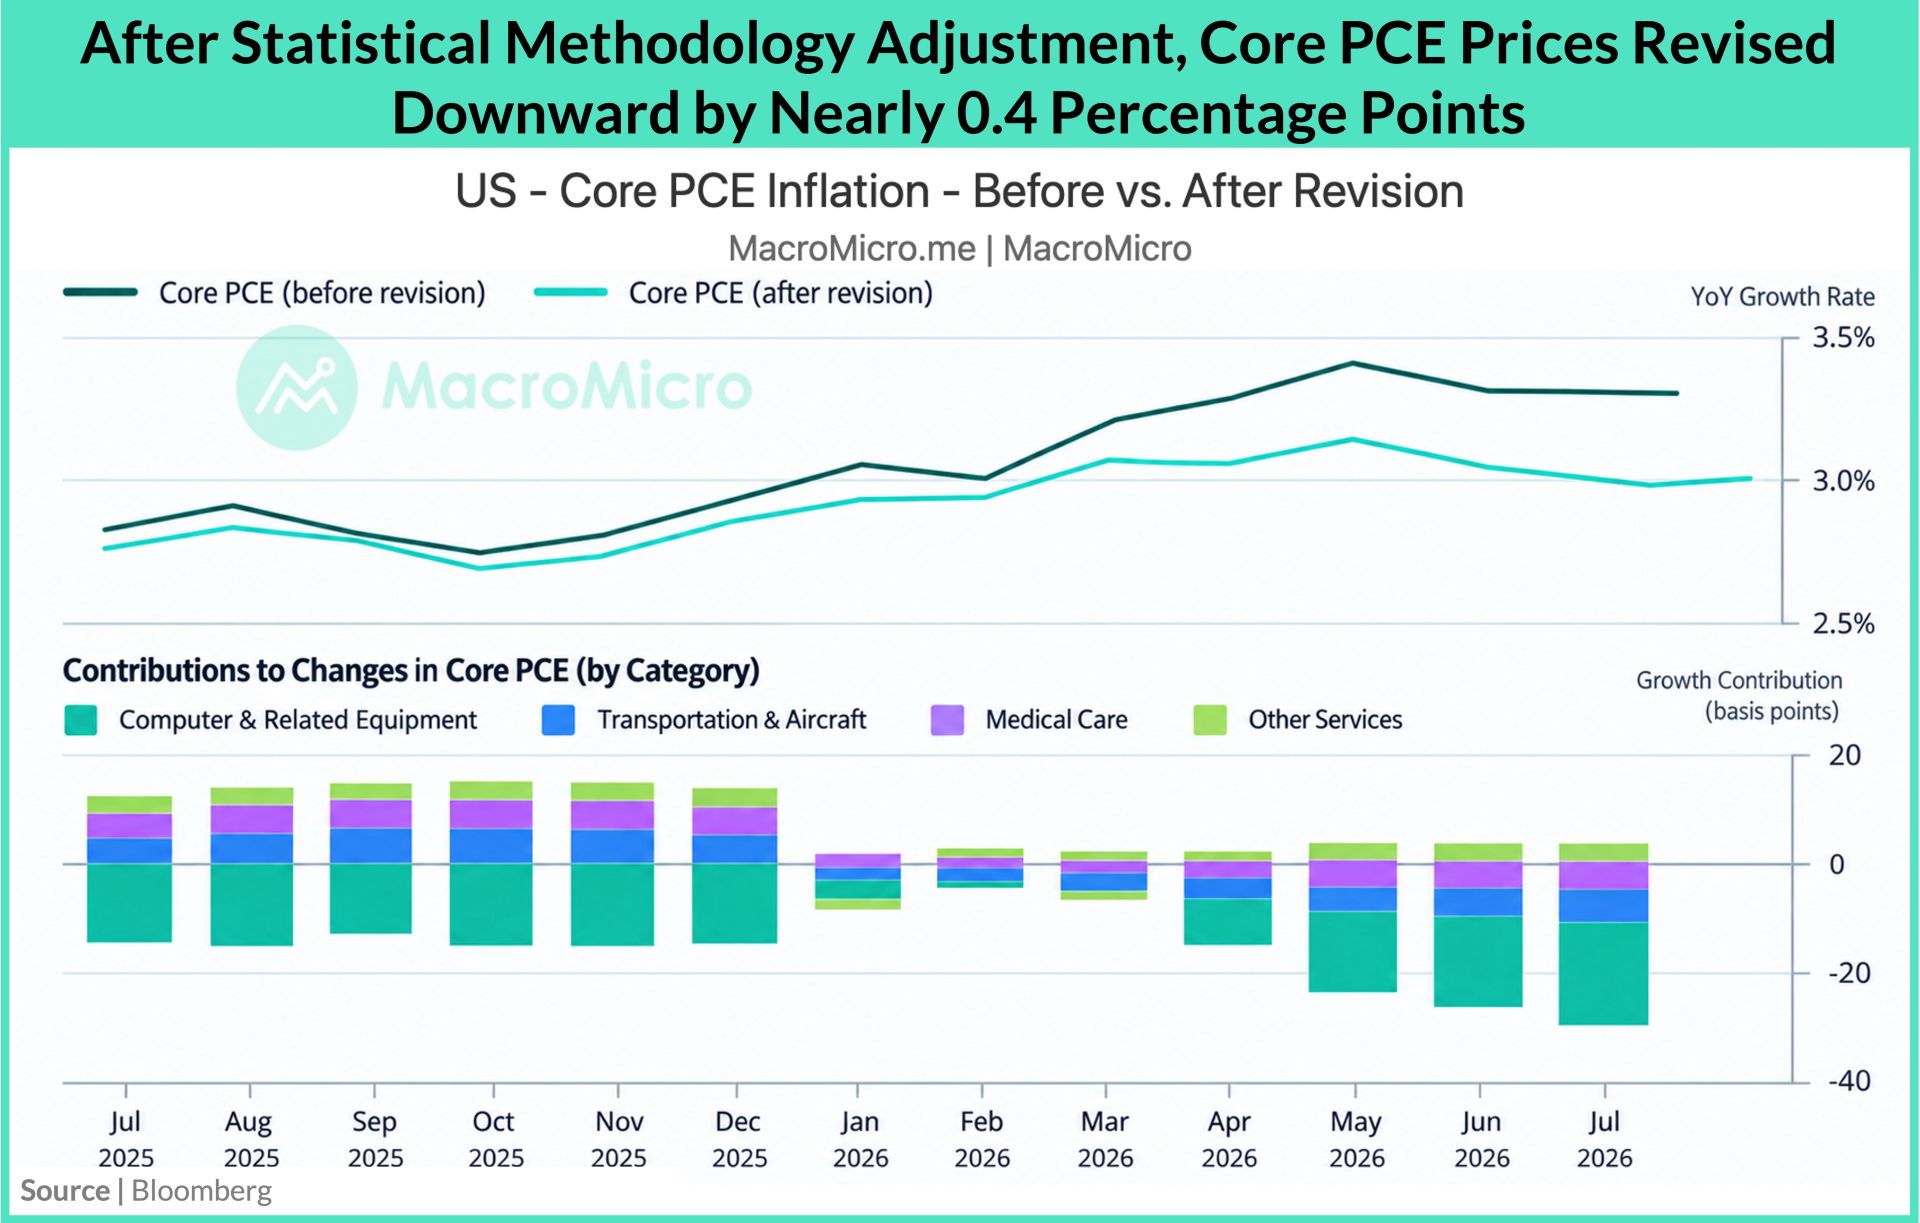
The annual readings have moved the other way, with headline PCE rose 3.42% YoY (previous: 3.36%) and core 3.01% (previous: 2.98%); both below expectations. The cause was a BEA methodology revision covering computer software and accessories, portfolio management, and legal services. It lowered the series by close to 0.4 percentage point in total, more than the market had expected, and took core PCE YoY from close to 3.5% to about 3%, which is why the monthly and annual readings appear inconsistent.
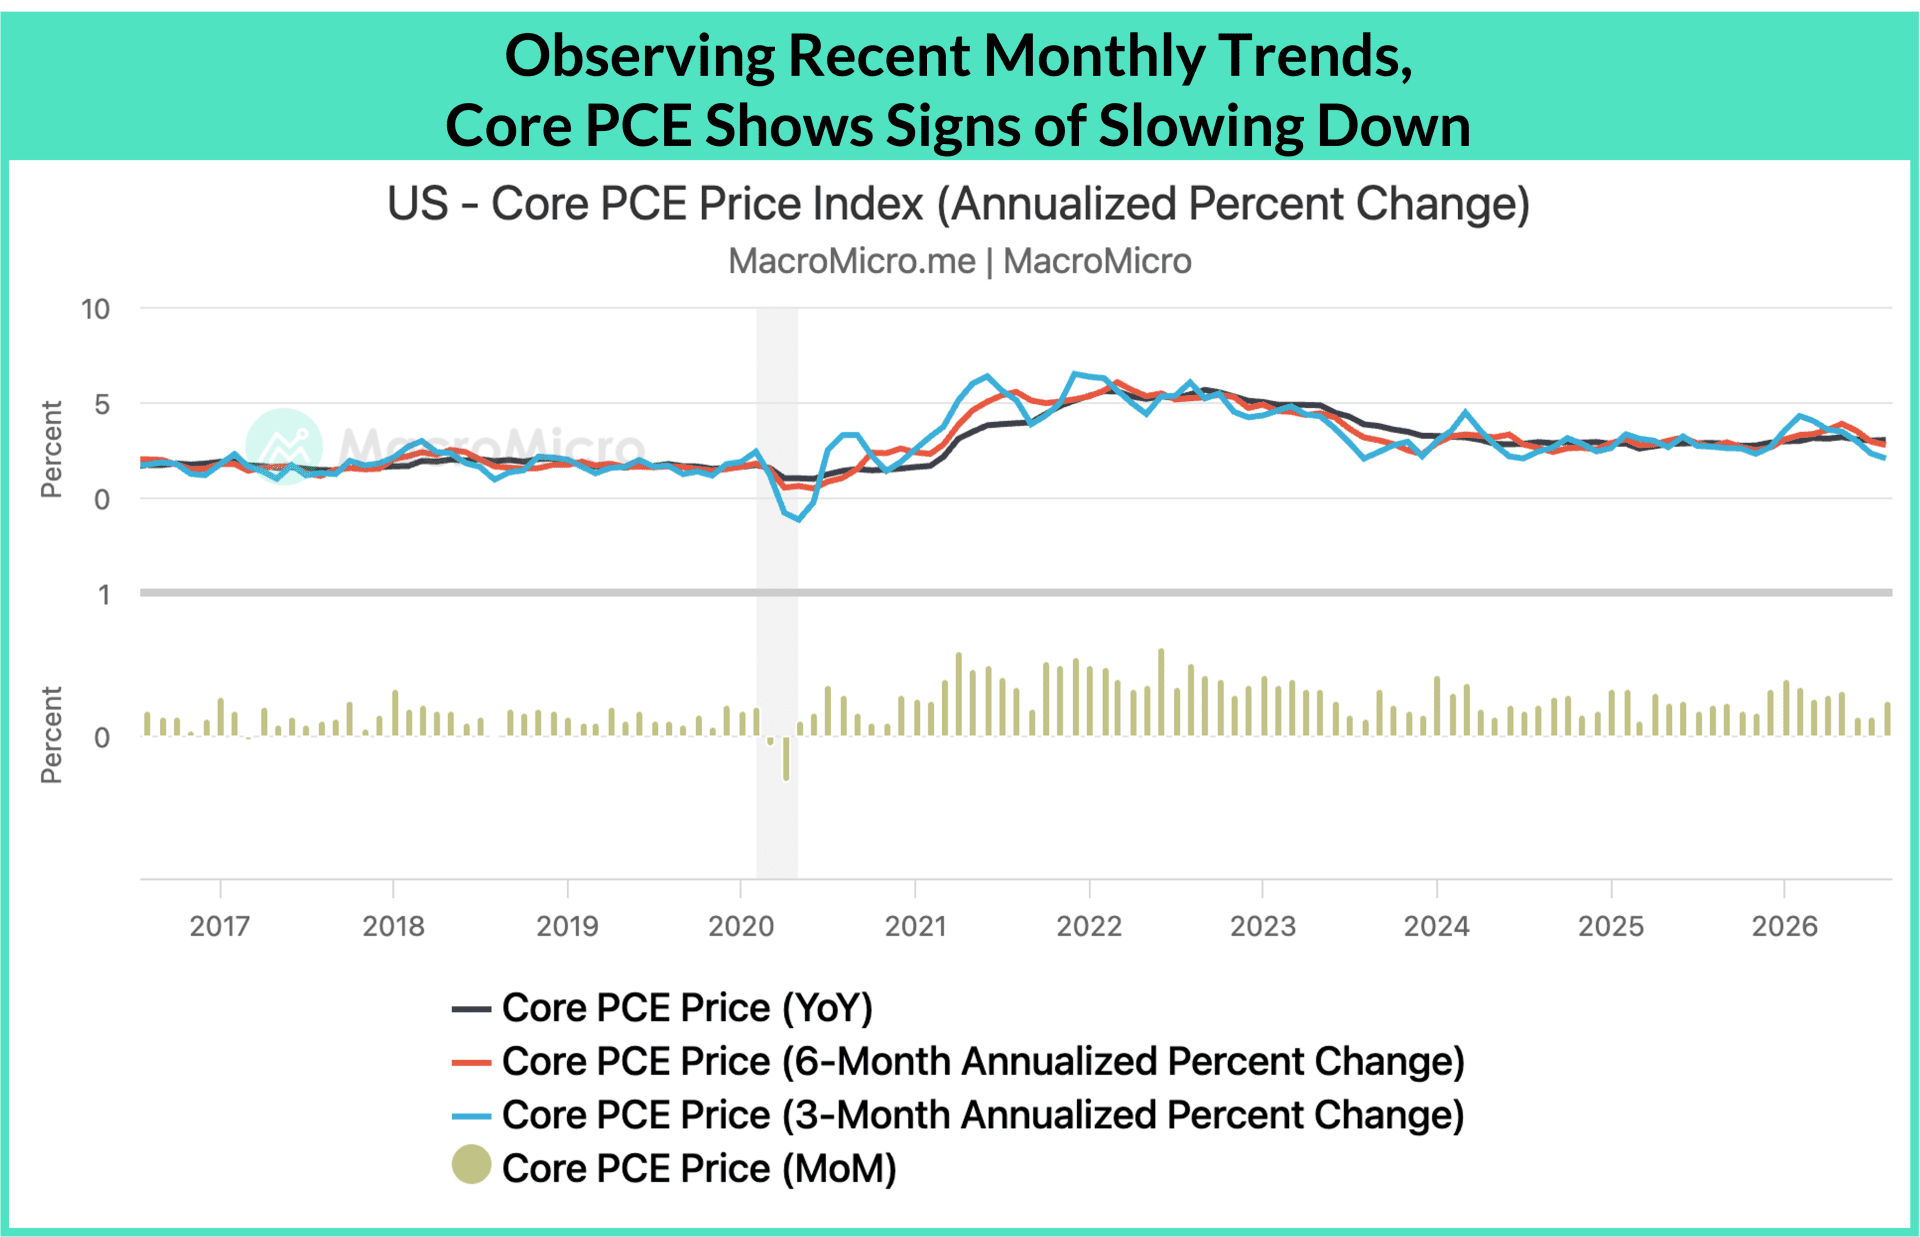
Trend measures filter out the monthly noise. The 6-month average of core PCE MoM has fallen steadily from its May high to 0.23%, close to the 0.2% threshold. The 6-month annualized change in core PCE has slowed from 3.9% in May to 2.7%, and the 3-month annualized change has fallen to 2.1%, the lowest since 2024. The next two months of data will still carry MoM pressure from the oil rebound, but the direction since May shows inflation moving back onto a decelerating path.
A decelerating core trend leaves one risk open: a second round, in which a strong labor market pushes wages up and sustains inflation.
Wages & Sticky Prices Show No Second-Round Effects
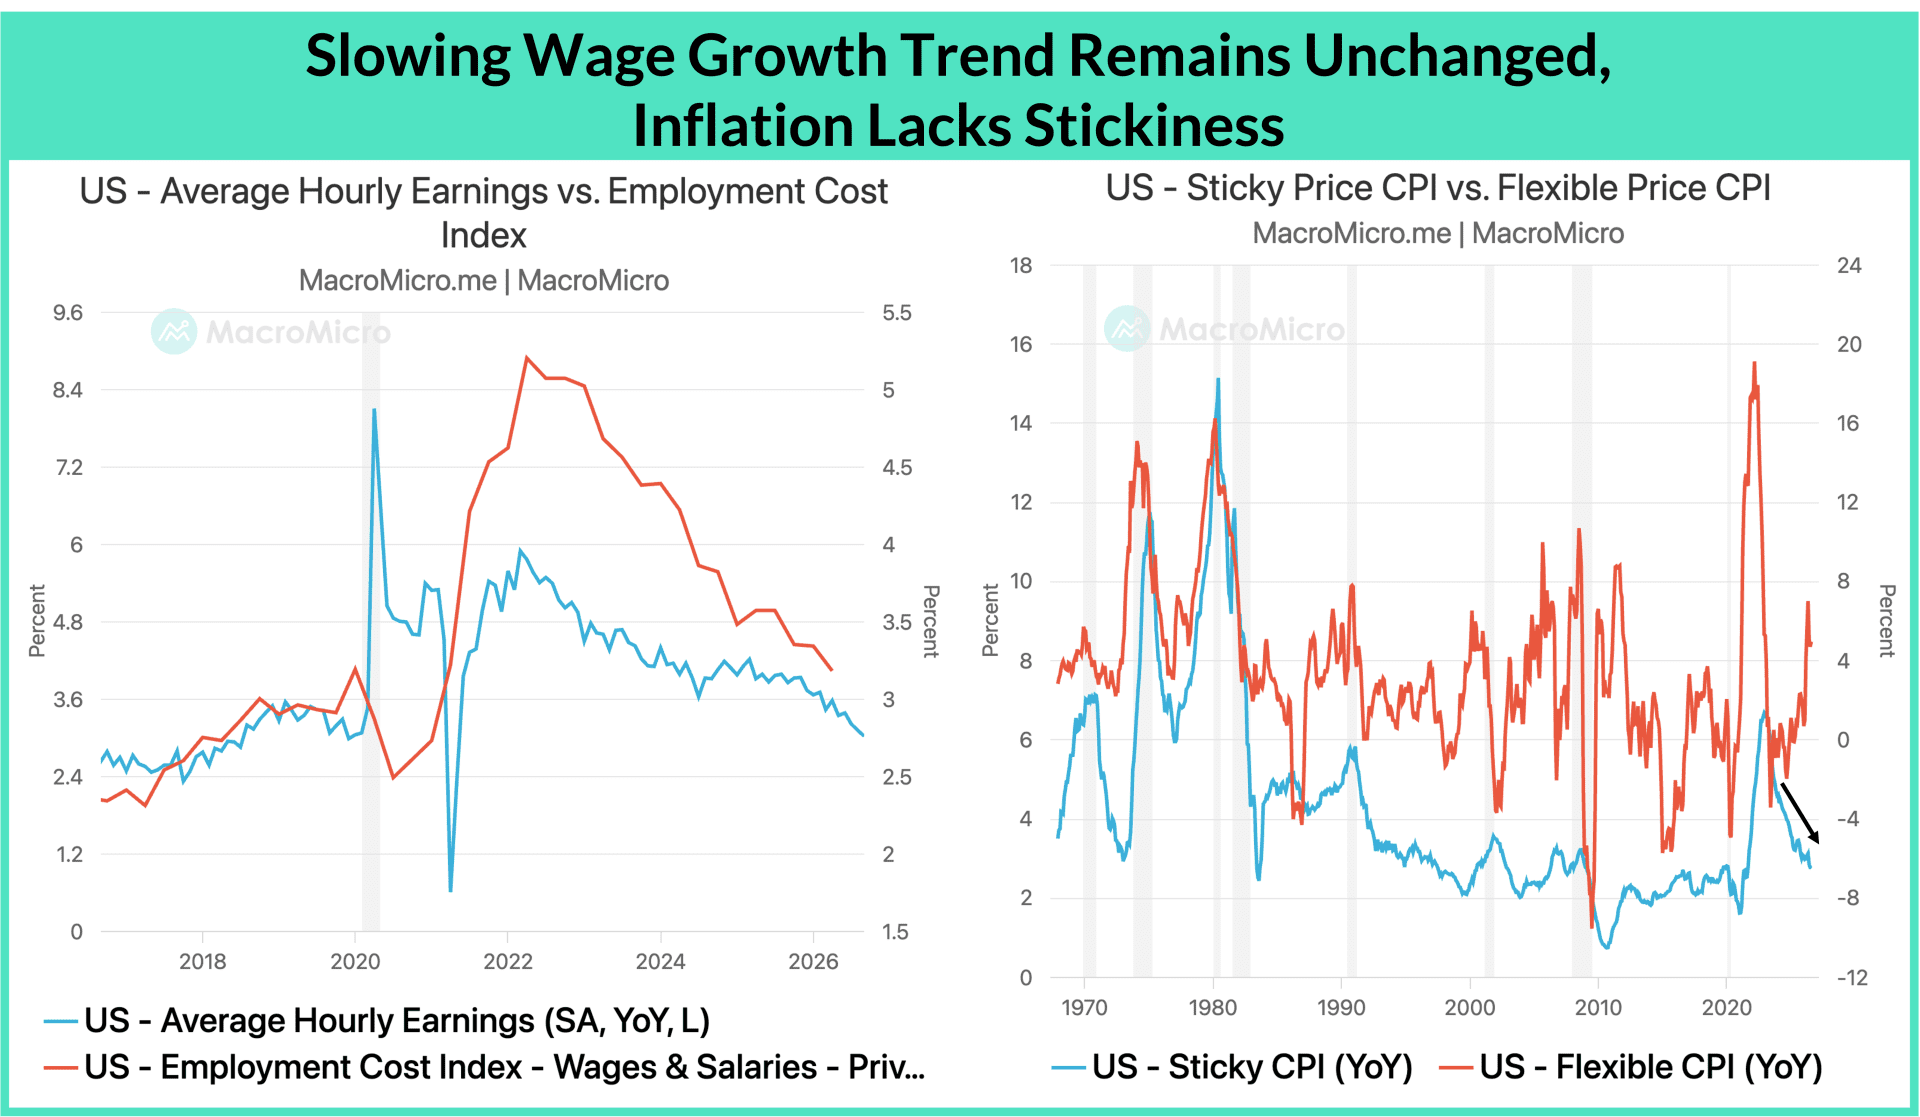
An above-expectations August payroll print revived the fear that a tight labor market would lift wages and set off a price spiral. The wage data do not support it. Average hourly earnings growth has slowed to 3.1% YoY, slightly below the pace of 2019, before the pandemic, so the labor market has stopped being a source of inflation pressure.
Splitting CPI by how often prices change points the same way. Sticky CPI covers goods and services whose prices take more than 4.3 months to change, such as rent, medical care, recreation, autos and home repair services, and it kept decelerating through August. Flexible CPI, which covers prices that adjust within 4.3 months, such as fuel, food and utilities, rebounded with oil. Because sticky prices change slowly, a sustained rise in them would signal entrenched inflation. Their continued slowdown shows the oil shock has not spread across the basket.
With wages and sticky prices contained, the remaining pressure sits in energy and hardware, and both have a visible path to easing.
Energy Pressure Peaks in H2 2026, & AI Hardware Price Increases Are Narrowing
The remaining pressure sits in energy and hardware, and both have a visible path to easing. On energy, the US-Iran conflict has lasted well beyond what we expected in the first half, and crude moved back above $100 per barrel after attacks halted Saudi Arabia's east-west pipeline, a bypass route for Gulf exports. Supply data nonetheless show a recovery. Burggraben Analysis estimates September Middle East crude exports at 94% of their January 2026 level, which we take as the pre-war baseline. Including refined products, exports have recovered from more than 40% below the pre-war average to about 10% below.
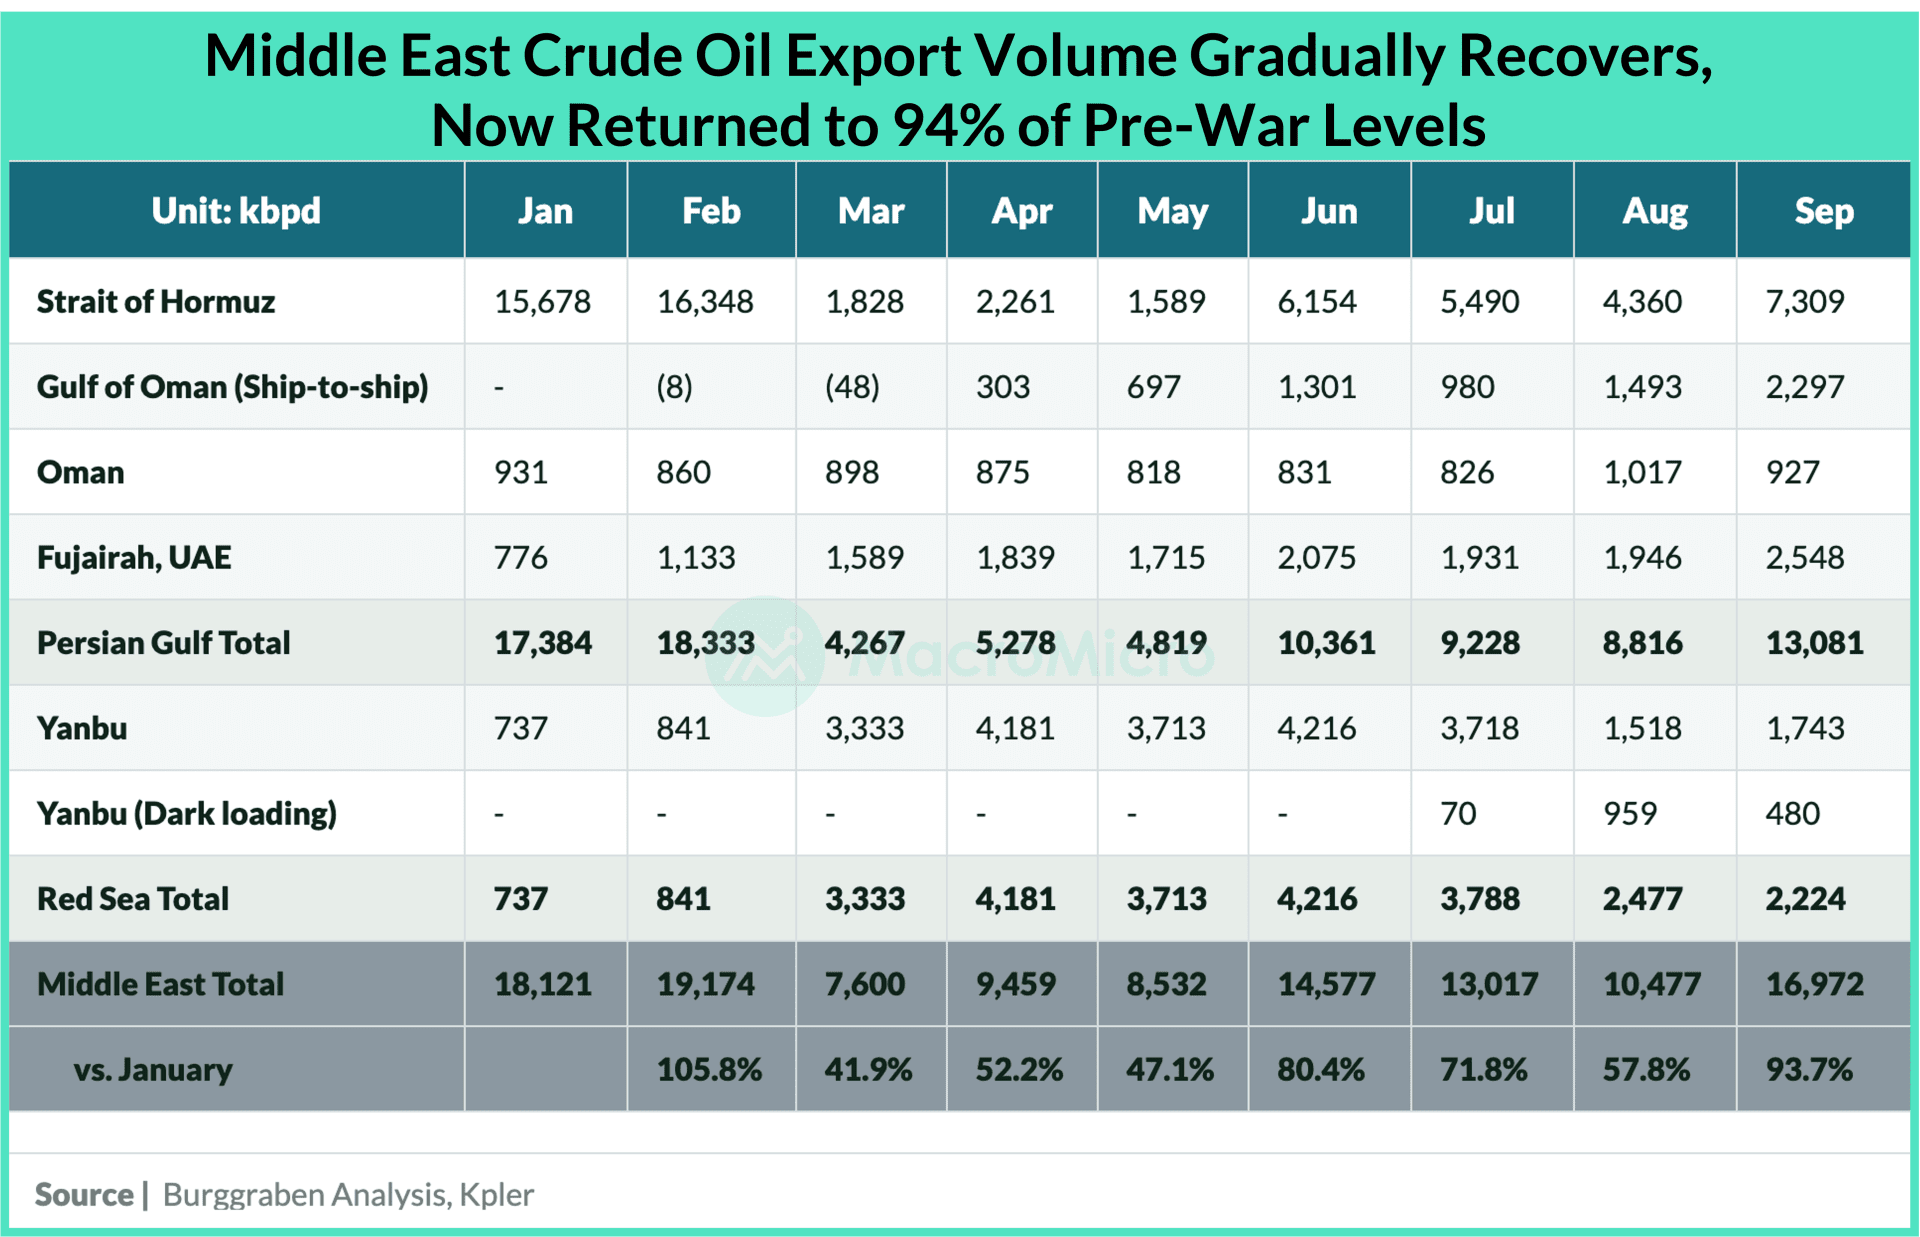
The recovery fits the producers' own incentives. Energy exports are the main revenue source for Middle East oil producers, so these governments have an economic reason to press Iran to keep exports flowing with or without US pressure. The likelier arrangement is a tacit understanding under which Iran allows other Middle East producers to export through bypass routes and their own fleets, which would keep supply from returning to the tightness of the war's first months even if the conflict continues. The US also has buffers, with crude inventories rebuilt from their low at the peak of the consumption season to normal seasonal levels and refinery utilization close to 100%, which lets refiners turn that crude into the diesel and gasoline that downstream users lack.
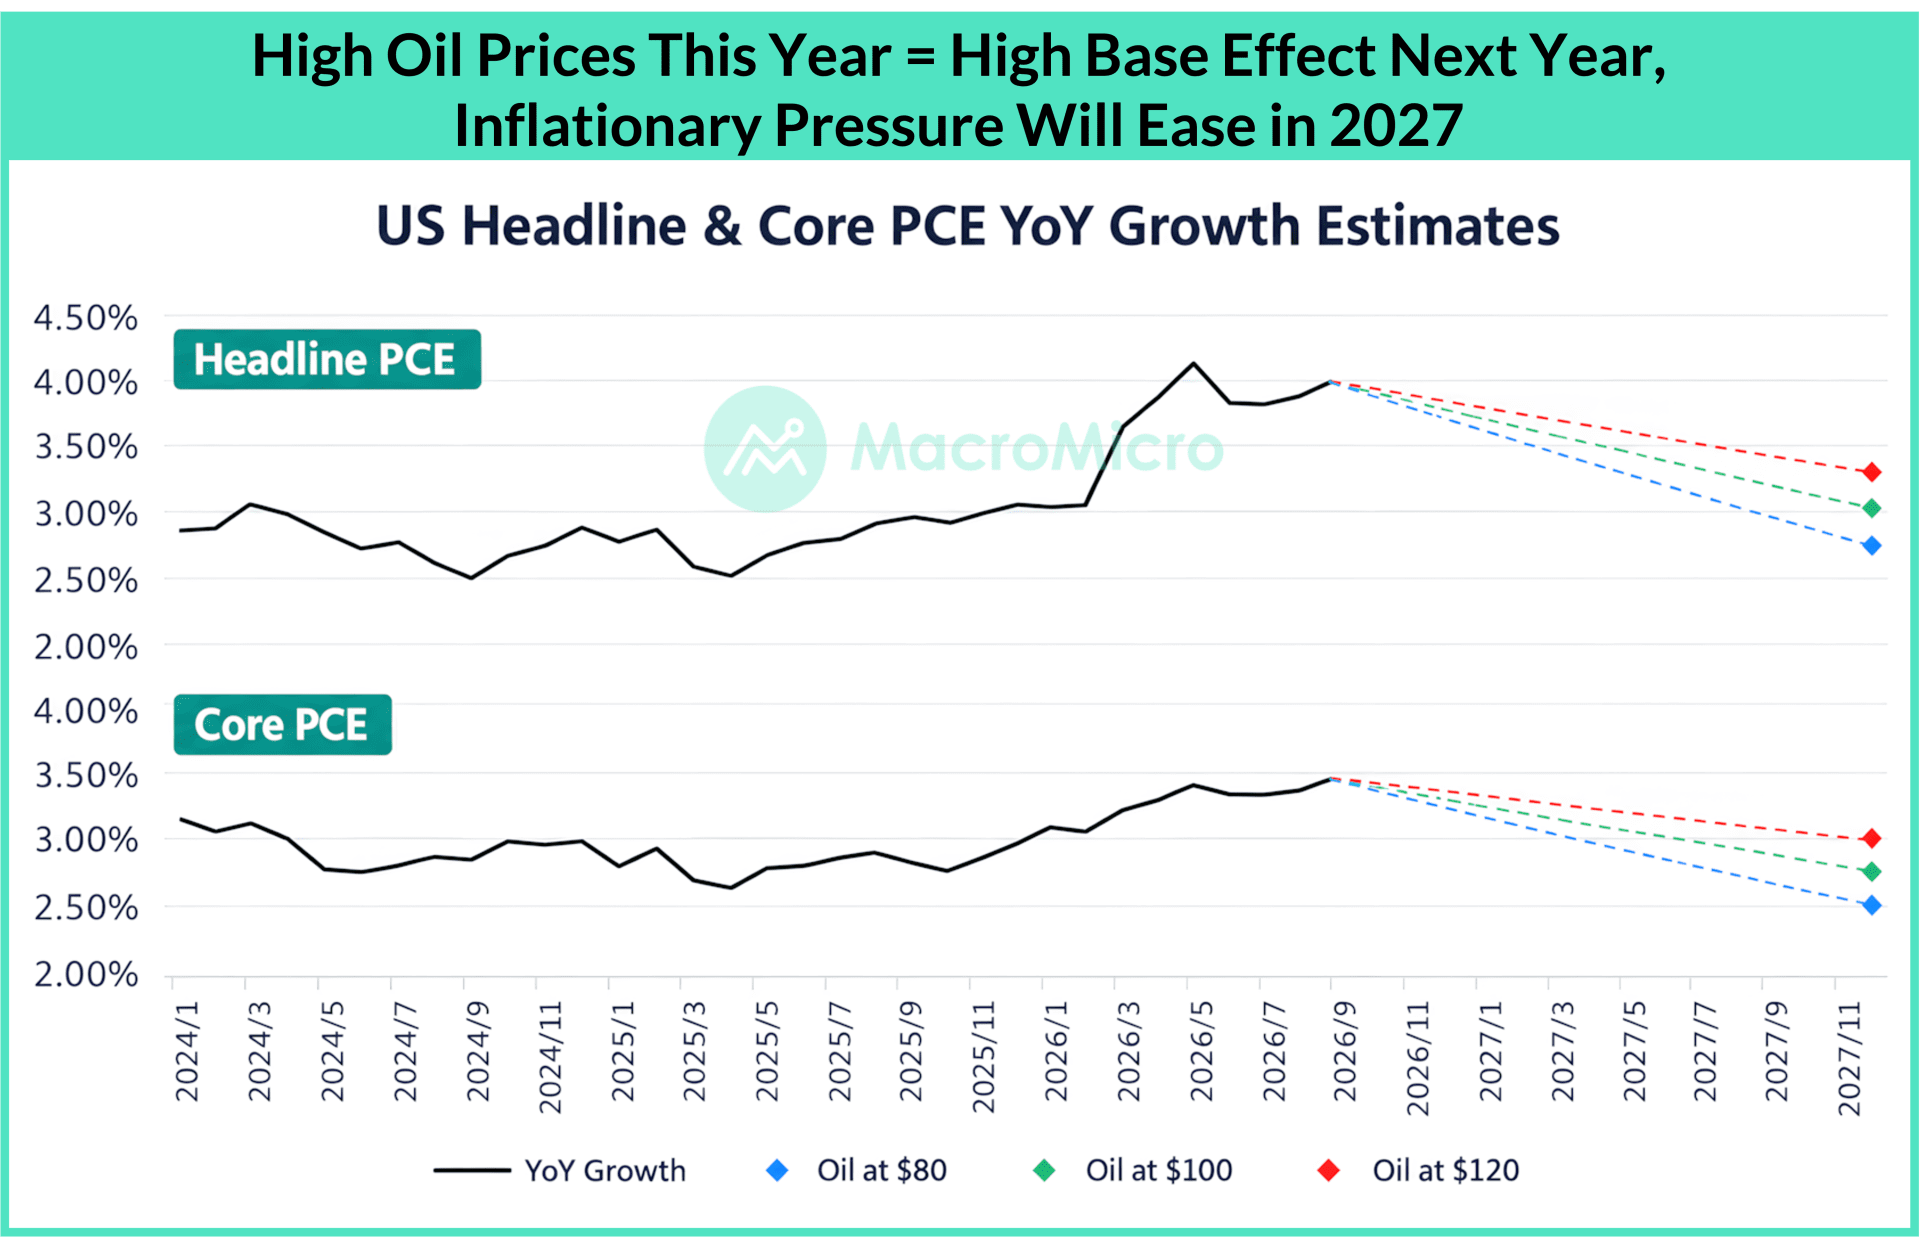
Because oil prices pushed up by this year's conflict become a high base next year, the base effect is the largest favorable factor for inflation in 2027. Even if oil stays flat at $80 to $100 per barrel, headline inflation would cool clearly, so energy pressure should peak in H2 2026, possibly into Q1 2027, and fade as the base rises.
Hardware is the second source of price pressure, and it follows the same pattern. Micron, the memory maker whose prices rose fastest, still has rising consensus revenue estimates, but each quarter's increase is smaller. Demand remains above supply, so volume is holding up and the narrowing reflects smaller price increases. Downstream, handset brands and especially PC makers are accumulating inventory, because rising component prices depress demand for devices that were not strong to begin with. Brands in that position have a reason to negotiate with upstream suppliers, since suppliers also lose if orders are cut. We expect more agreements in which each side absorbs part of the increase, which caps further price gains in the AI hardware chain.
A Stronger Economy Gave the Fed Room to Hike
With broad inflation pressure ruled out, the Fed's reasoning rests on two points. First, inflation had not improved enough: August CPI and PPI came in slightly above expectations and oil was back above $100, so hiking early aims to return inflation to its slowing path sooner. Second, the economy was strong. The September projections raised GDP growth for 2026 and 2027, with the forecast staying above the 2% long-run rate through 2029, and lowered unemployment to 4.1%, below the 4.2% long-run level, while inflation projections moved up only slightly. Equities did not react negatively to a dot plot that moved from no hikes to two this year, which fits a Fed projecting strength.
Data since the meeting support that reading. Q2 GDP growth was revised up to 2.2% annualized from 1.5%, with consumption contributing 2.5 percentage points (previous: 0.5), a new high since 2025. Payroll growth slowed to 29,000 (previous: 133,000), but more than half of industries kept adding jobs, including education and health, construction and manufacturing, and the rise in unemployment to 4.2% came from more people entering the labor force, with participation up from 61.6% to 61.8% and employment up by 406,000. Consumption, employment and investment are rising together.
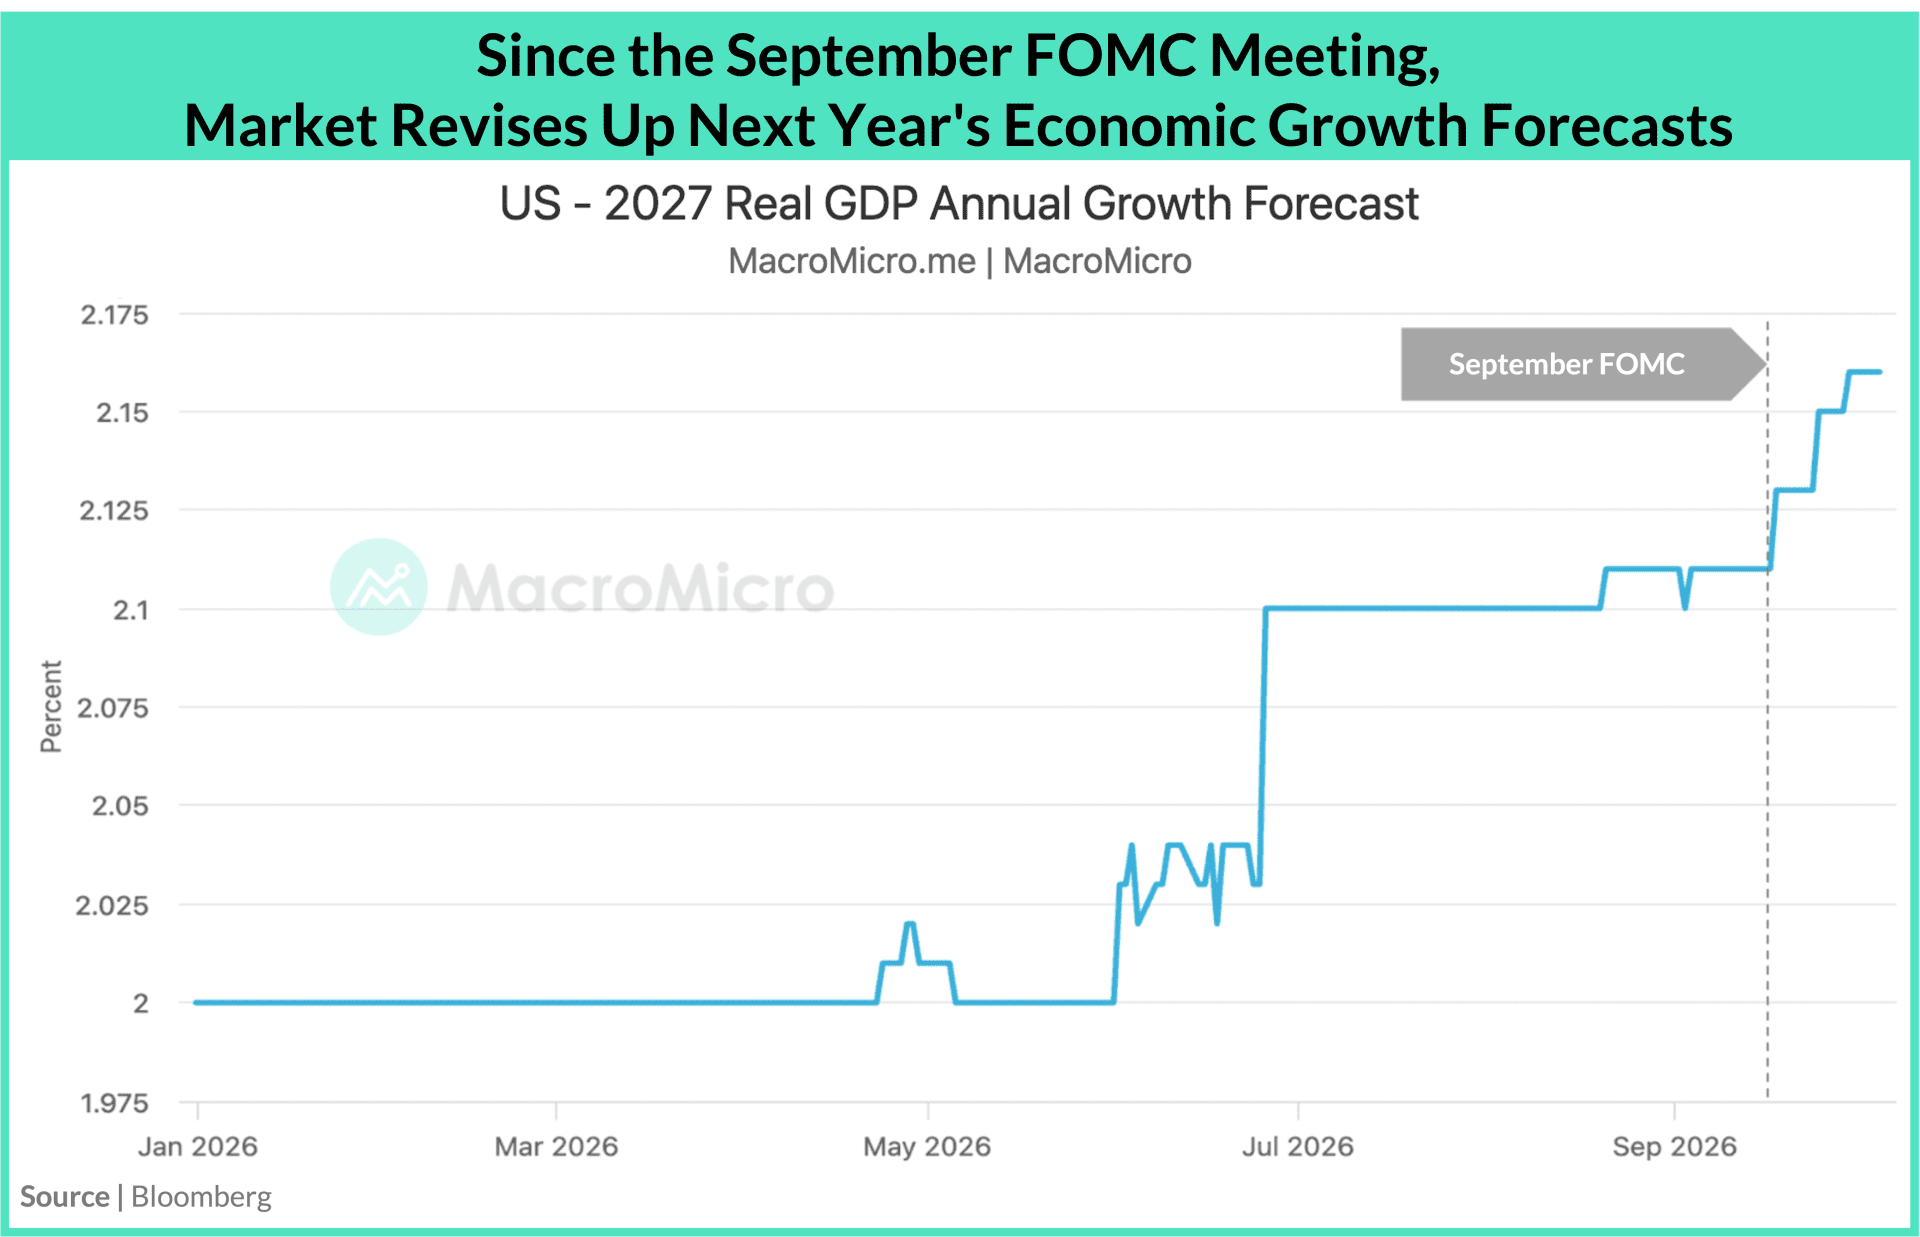
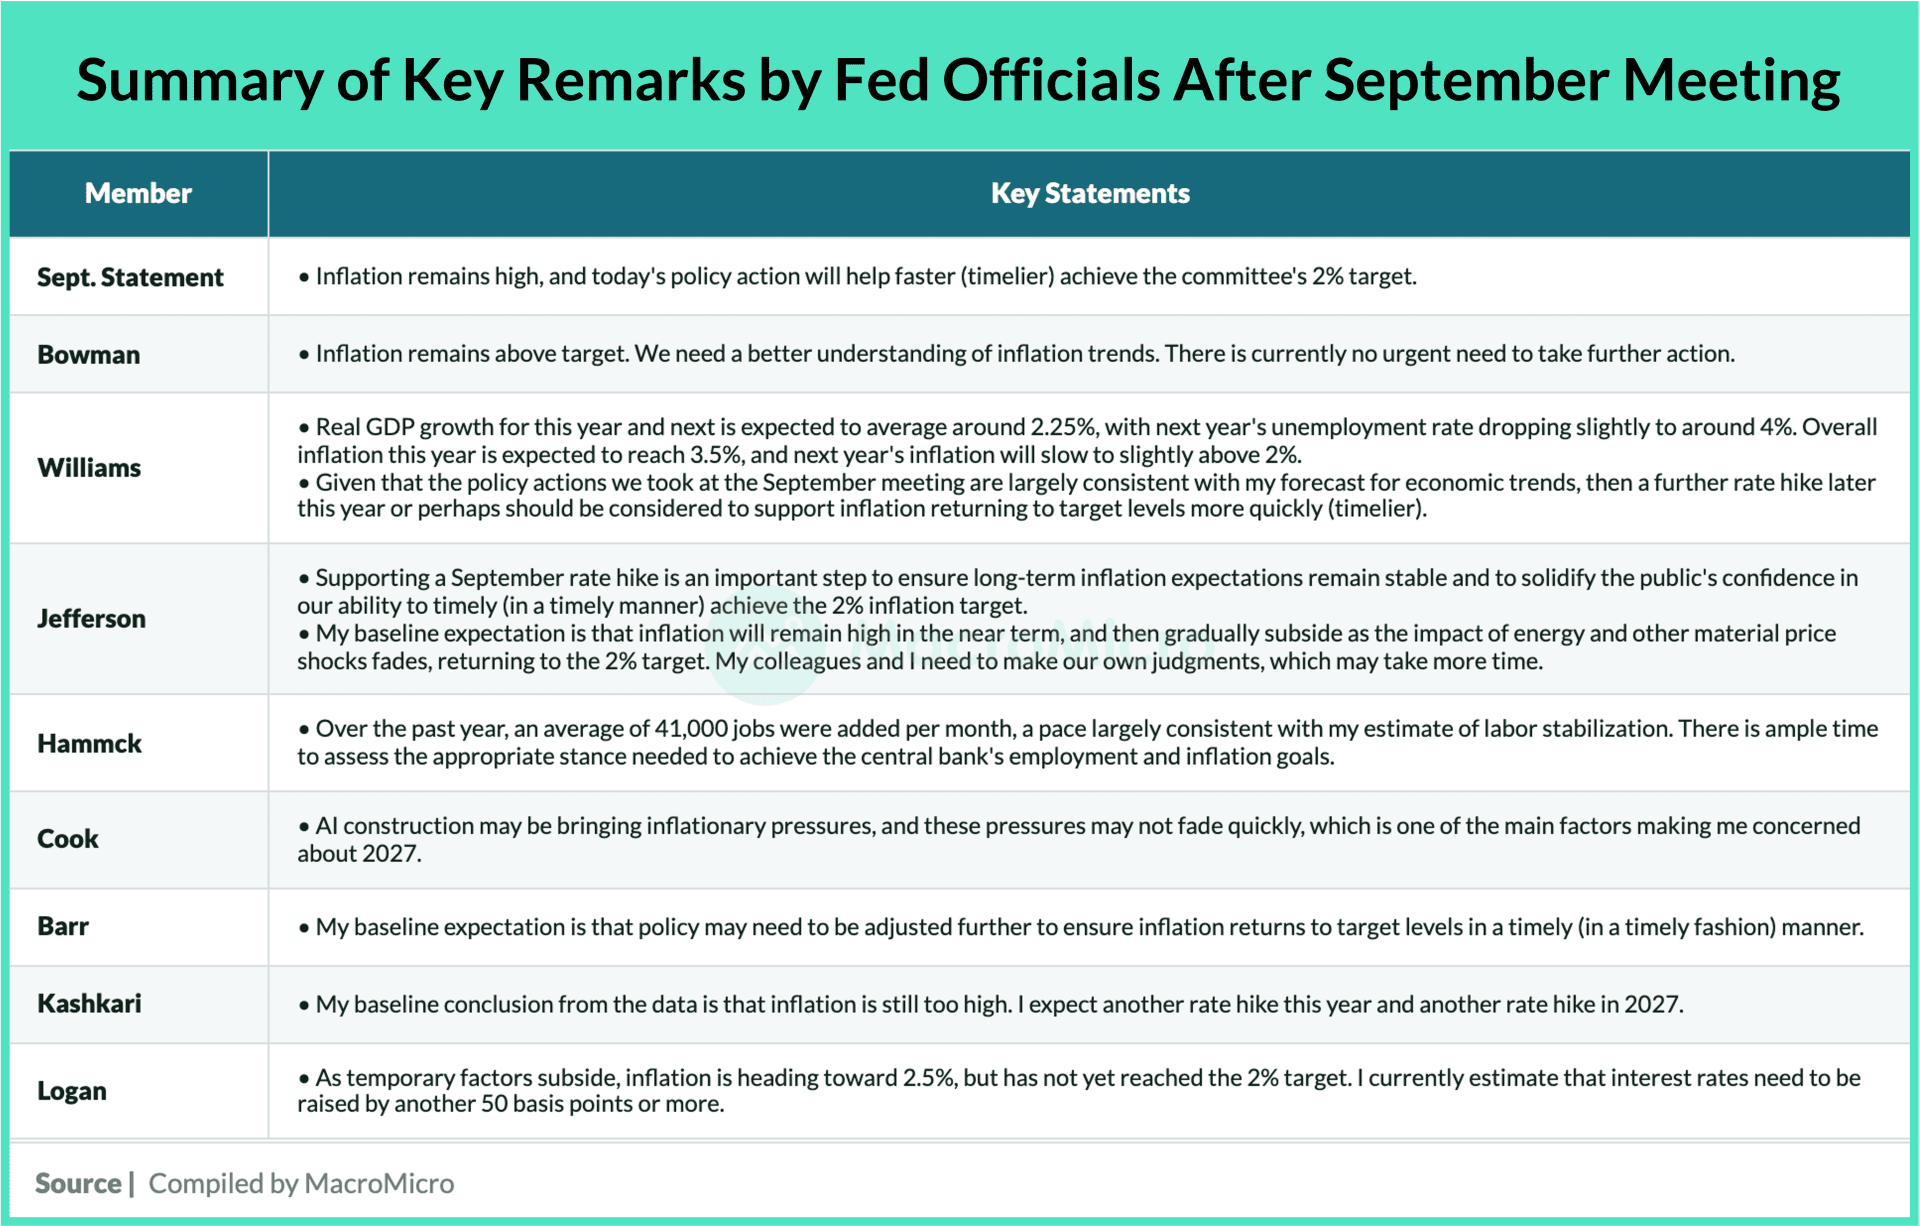
Since the meeting, an upgrade to the economic outlook has become the market's main narrative. Consensus growth for 2027 has risen to nearly 2.2%, converging toward the Fed's projection, and Williams, Jefferson and Barr have each described the aim of the hike as returning inflation to 2% in a timelier manner. In our reading, the hike reflects both upside inflation risk and data confirming a resilient economy that gave the Fed room to tighten, which marks a change from the first half of the year, when it was concerned about economic fragility.
We therefore expect two quarter-point hikes this year and a pause in 2027, since the energy and hardware pressures both ease. Any tightening in rates or in the balance sheet is likely to be paired with easing on the other side. A hike that strains liquidity would bring back reserve management purchases (RMPs), and the Fed's statement still keeps its wording on ample reserves to preserve that option. Further balance sheet reduction next year, if Kevin Warsh pushes for it, would be discussed together with rate cuts. With short-term rates on a clear path, the long end is where the market's remaining concern sits.
II. Why Long-Term Yields Keep Rising While Short-Term Yields Ease
Short-term rates have a clear path, but the long end has not followed it: short-term yields have eased while long-term yields keep setting new highs, and the divergence unsettles equity investors. A rise at the long end can reflect a stronger growth outlook, weak demand for government debt, or a funding shortage as borrowers compete for money. Each has different implications for markets, and the evidence points to the first.
Real Yields Lead the Increase, Reflecting Higher Growth Expectations
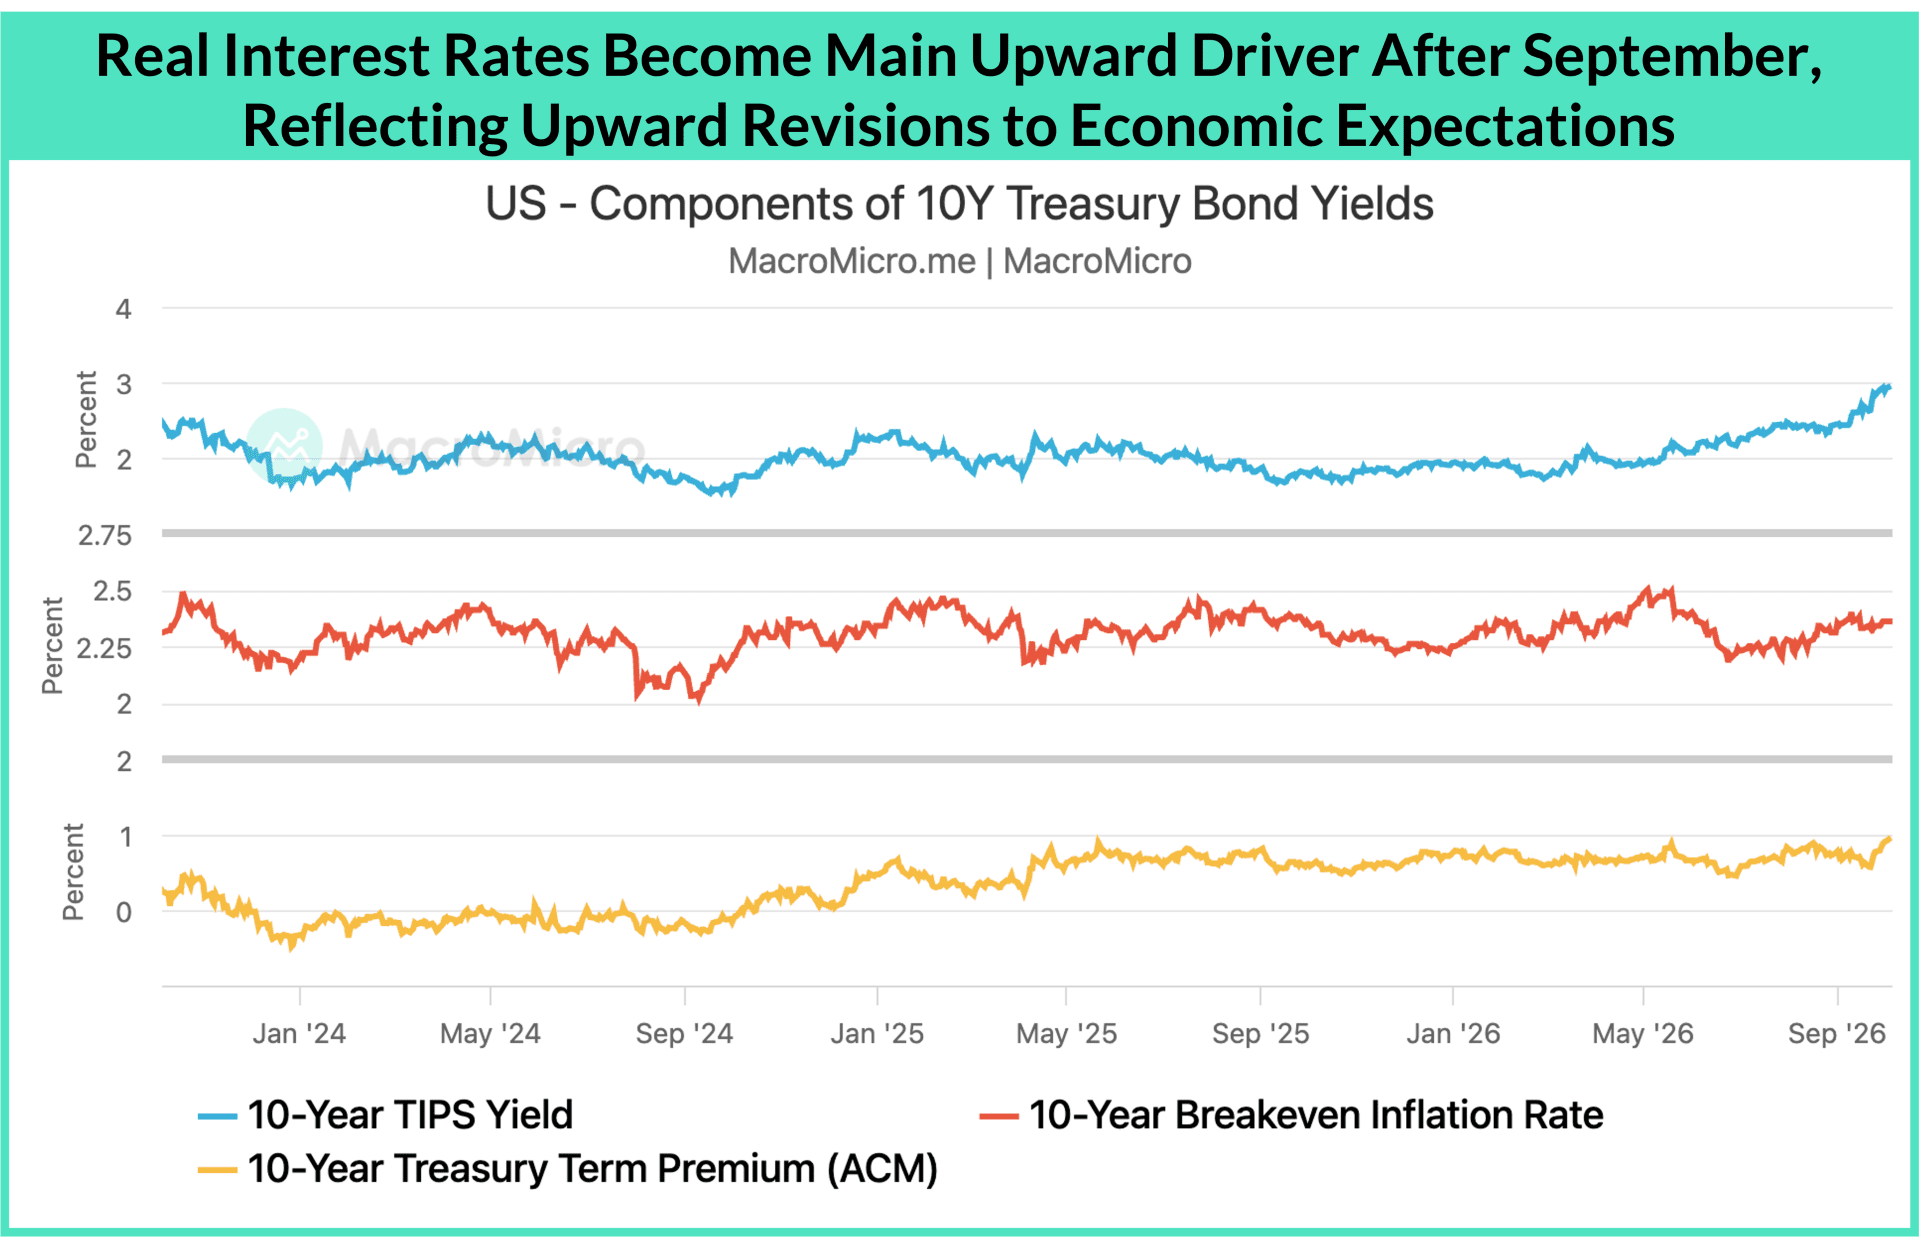
Decomposing the 10-year Treasury yield shows that, since the September FOMC meeting, the increase has come mainly from the real yield, while breakeven inflation has barely moved. Breakeven inflation measures compensation for inflation, so its stability means the market is not pricing a loss of inflation control, and a rising real yield alongside it indicates a stronger growth outlook, the same upgrade visible in GDP, consumption and the Fed's projections. The term premium had already begun rising in July on fiscal concerns, but the move since September is mostly a real-yield move.
A yield increase led by real rates does not by itself signal worsening financial conditions, and it is consistent with corporate earnings and economic fundamentals staying resilient. Bondholders face a different risk. When governments are issuing debt at the same time, long-term investors can collect interest and still lose more on price, which is why we continue to advise avoiding long-dated bonds.
Demand & Bank Funding Are Intact While Supply & Trust Weigh on the Long End
Weak demand for Treasuries is the first explanation to test, and the bid-to-cover ratio at 10-year auctions, which divides demand by the amount offered, has held in a flat range near 2.5x, so demand for safe assets remains firm. The second is AI financing competing with the government for funds, but the Fed's survey of banks shows net loan demand rising while lending standards have loosened, the opposite of what a funding shortage would produce.
Taken together, these results point to lenders with money who are hesitating over where to place it. GPU technology turns over quickly enough that lenders cannot estimate how much residual value a GPU will keep after several years, and so cannot be sure a loan will be recovered. Nvidia's residual value guarantee of up to 25% in some financing projects and CME's planned compute futures aim to remove that uncertainty, although both are early and will take time to reach scale.
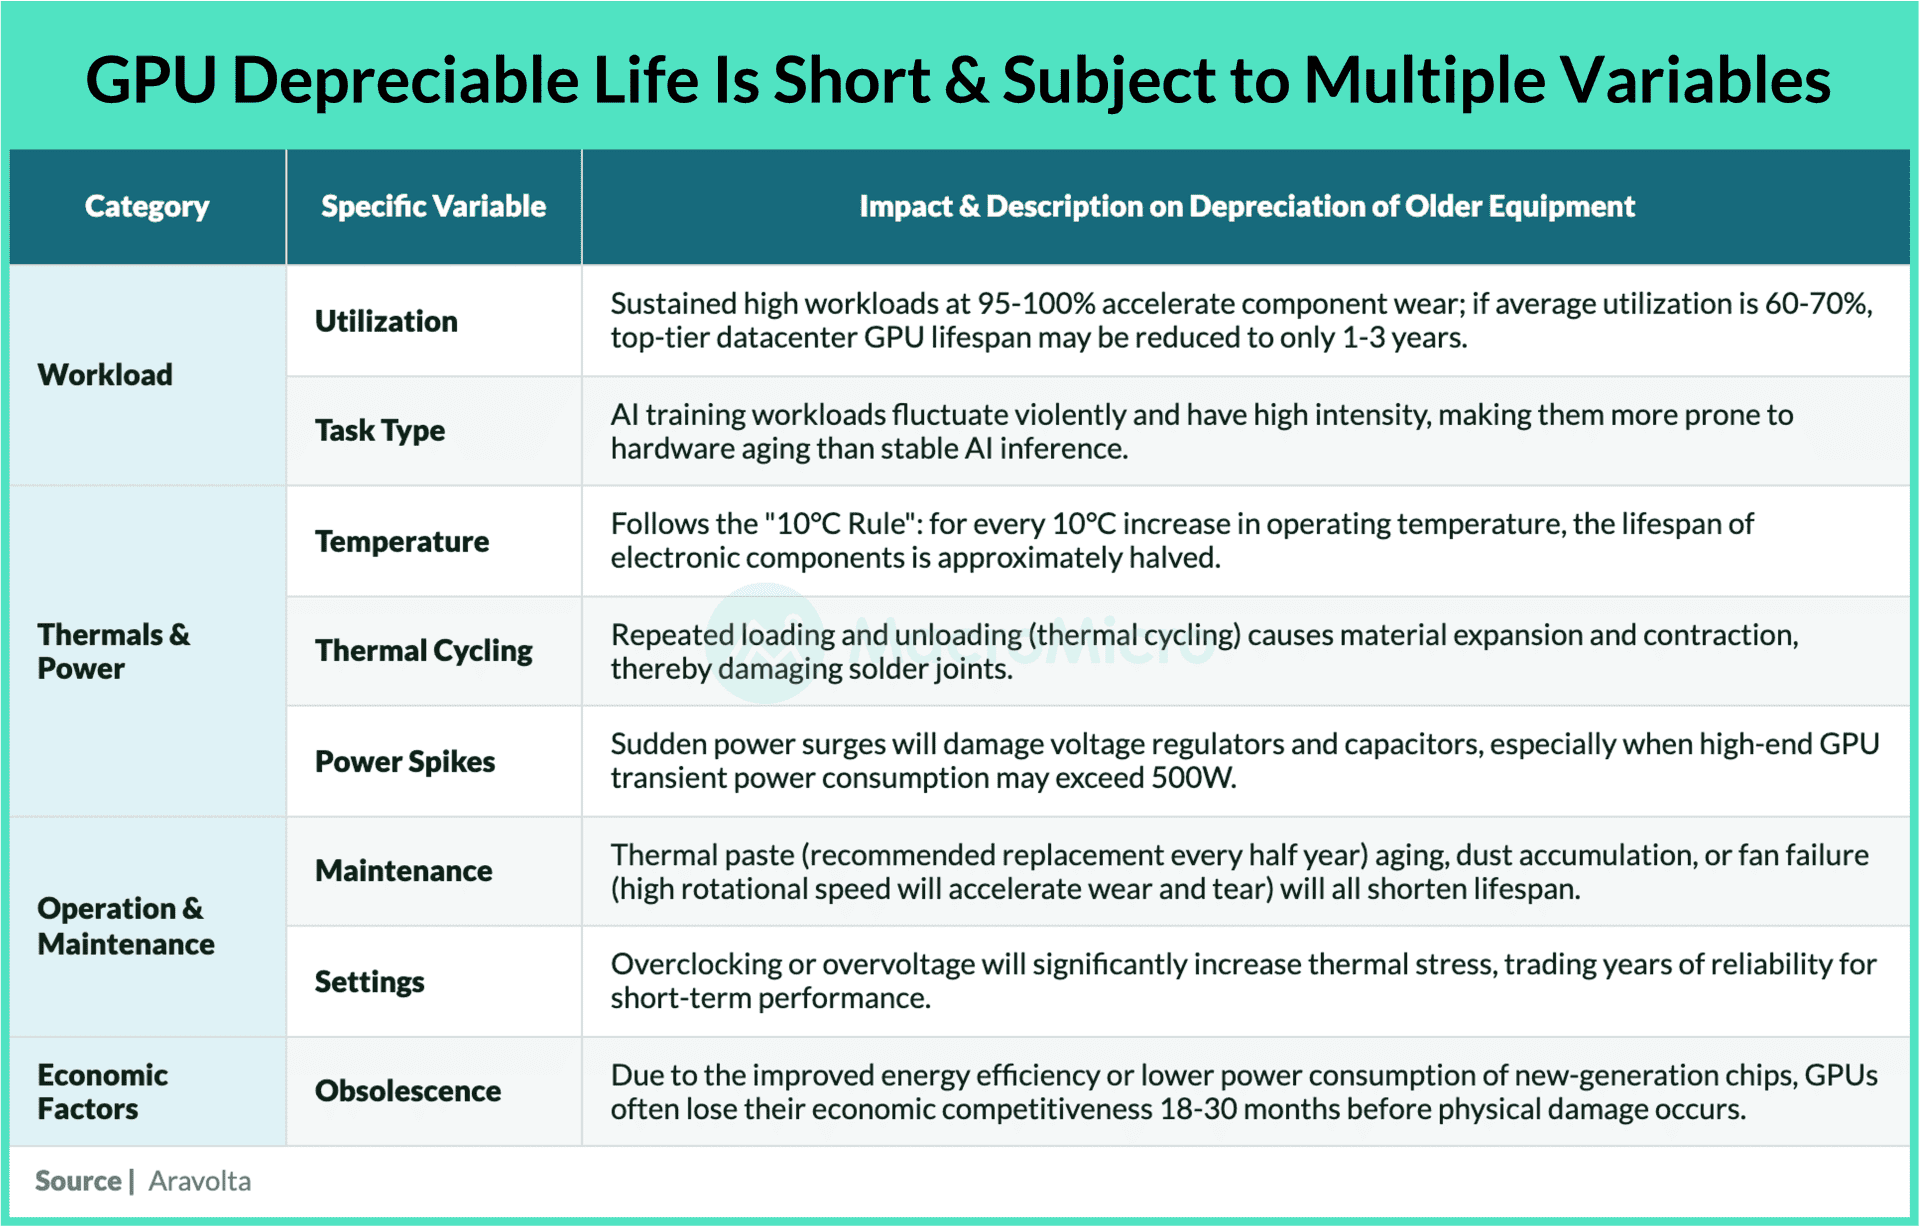
Several other factors keep long-term yields elevated, including geopolitical conflict and the Fed's ambiguous signaling, and the most fundamental is a distrust of government finances that remains unresolved. This pressure is global, with 30-year yields in the UK, France, Germany, Spain and Japan all at recent highs and the UK near 6%, because governments everywhere keep expanding deficits and investors want more compensation for financing them.
Governments Are Using Three Measures to Manage Long-End Pressure
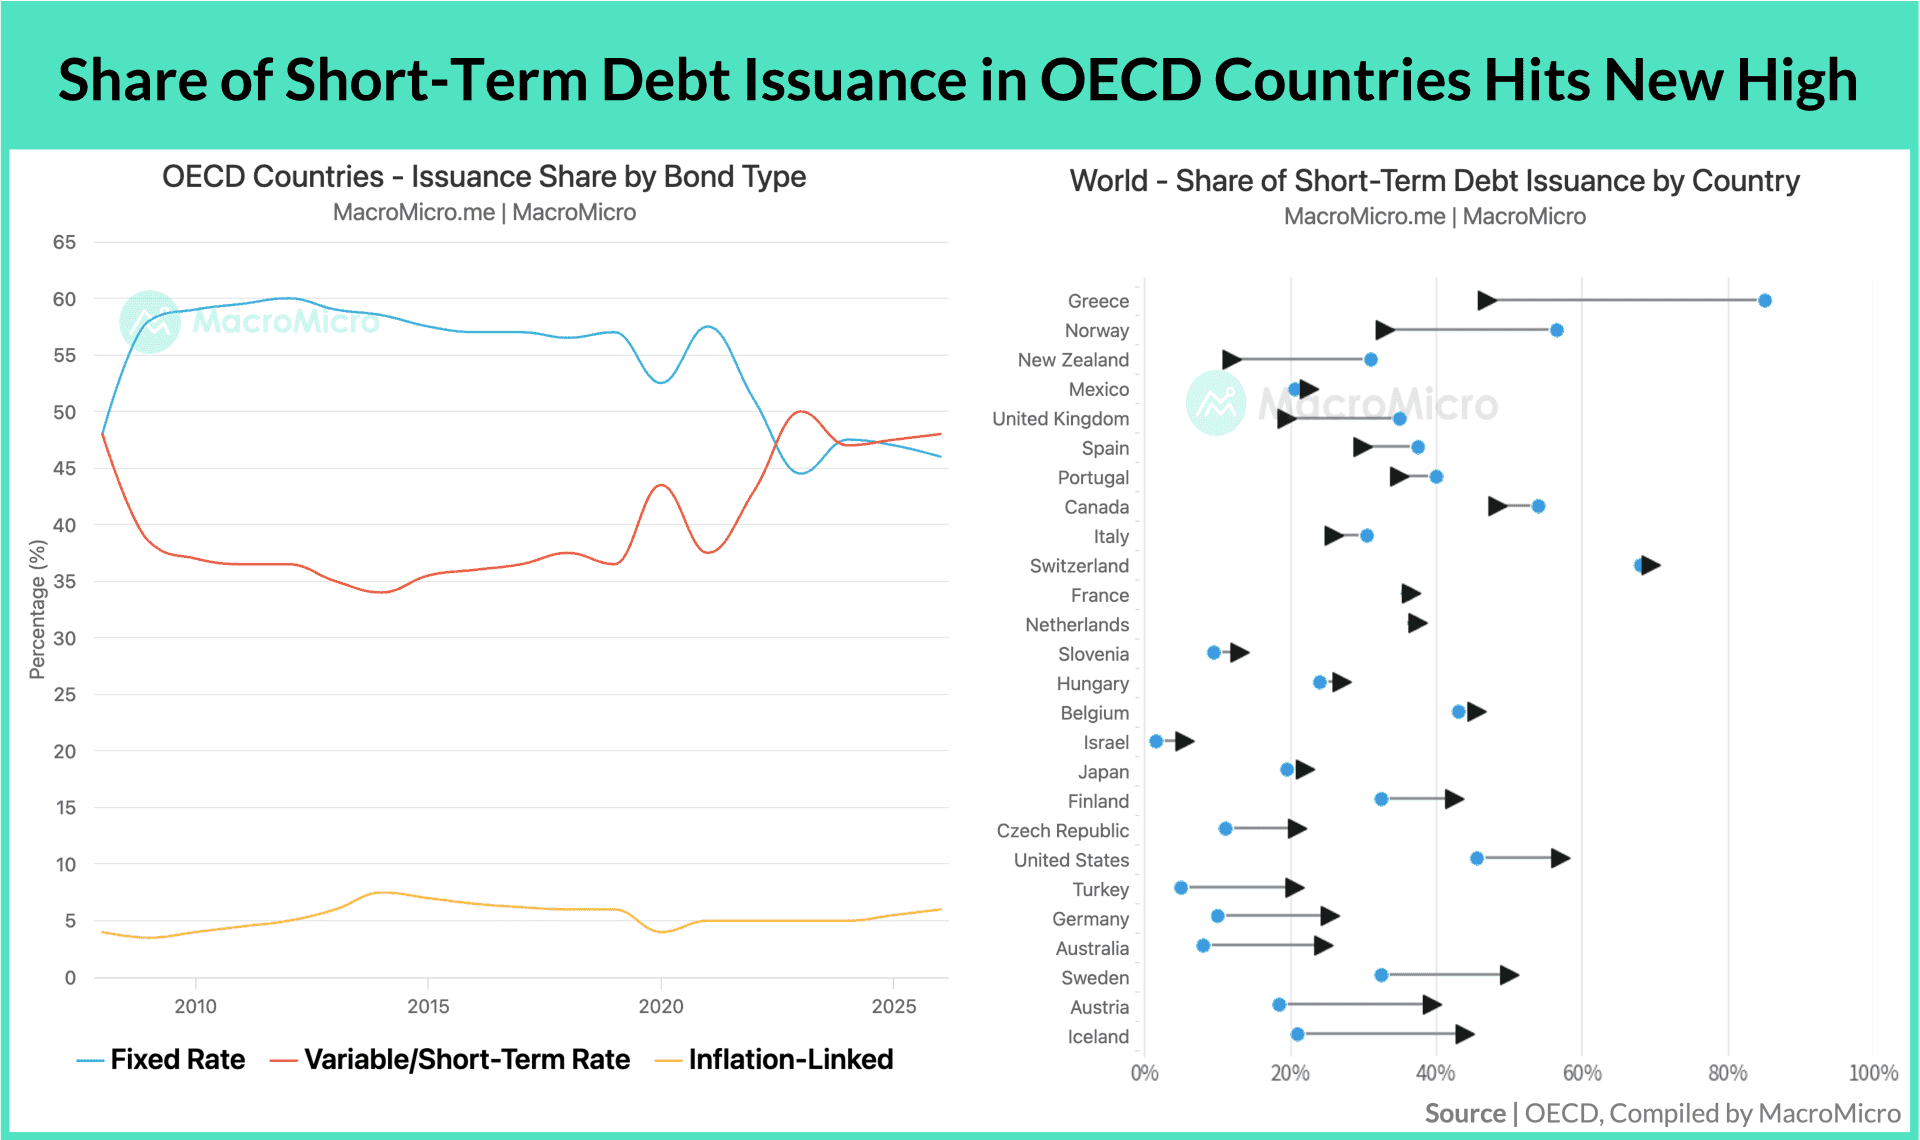
Higher yields raise what governments pay to borrow, and their responses fall into three groups. The first group targets supply: because long-dated issuance is the source of the pressure, governments are shifting toward more short-term bills and fewer long bonds, and in most economies the OECD tracks, the share of bills in total issuance rose in 2025 from 2024, with many of the more heavily indebted countries among those increasing it.
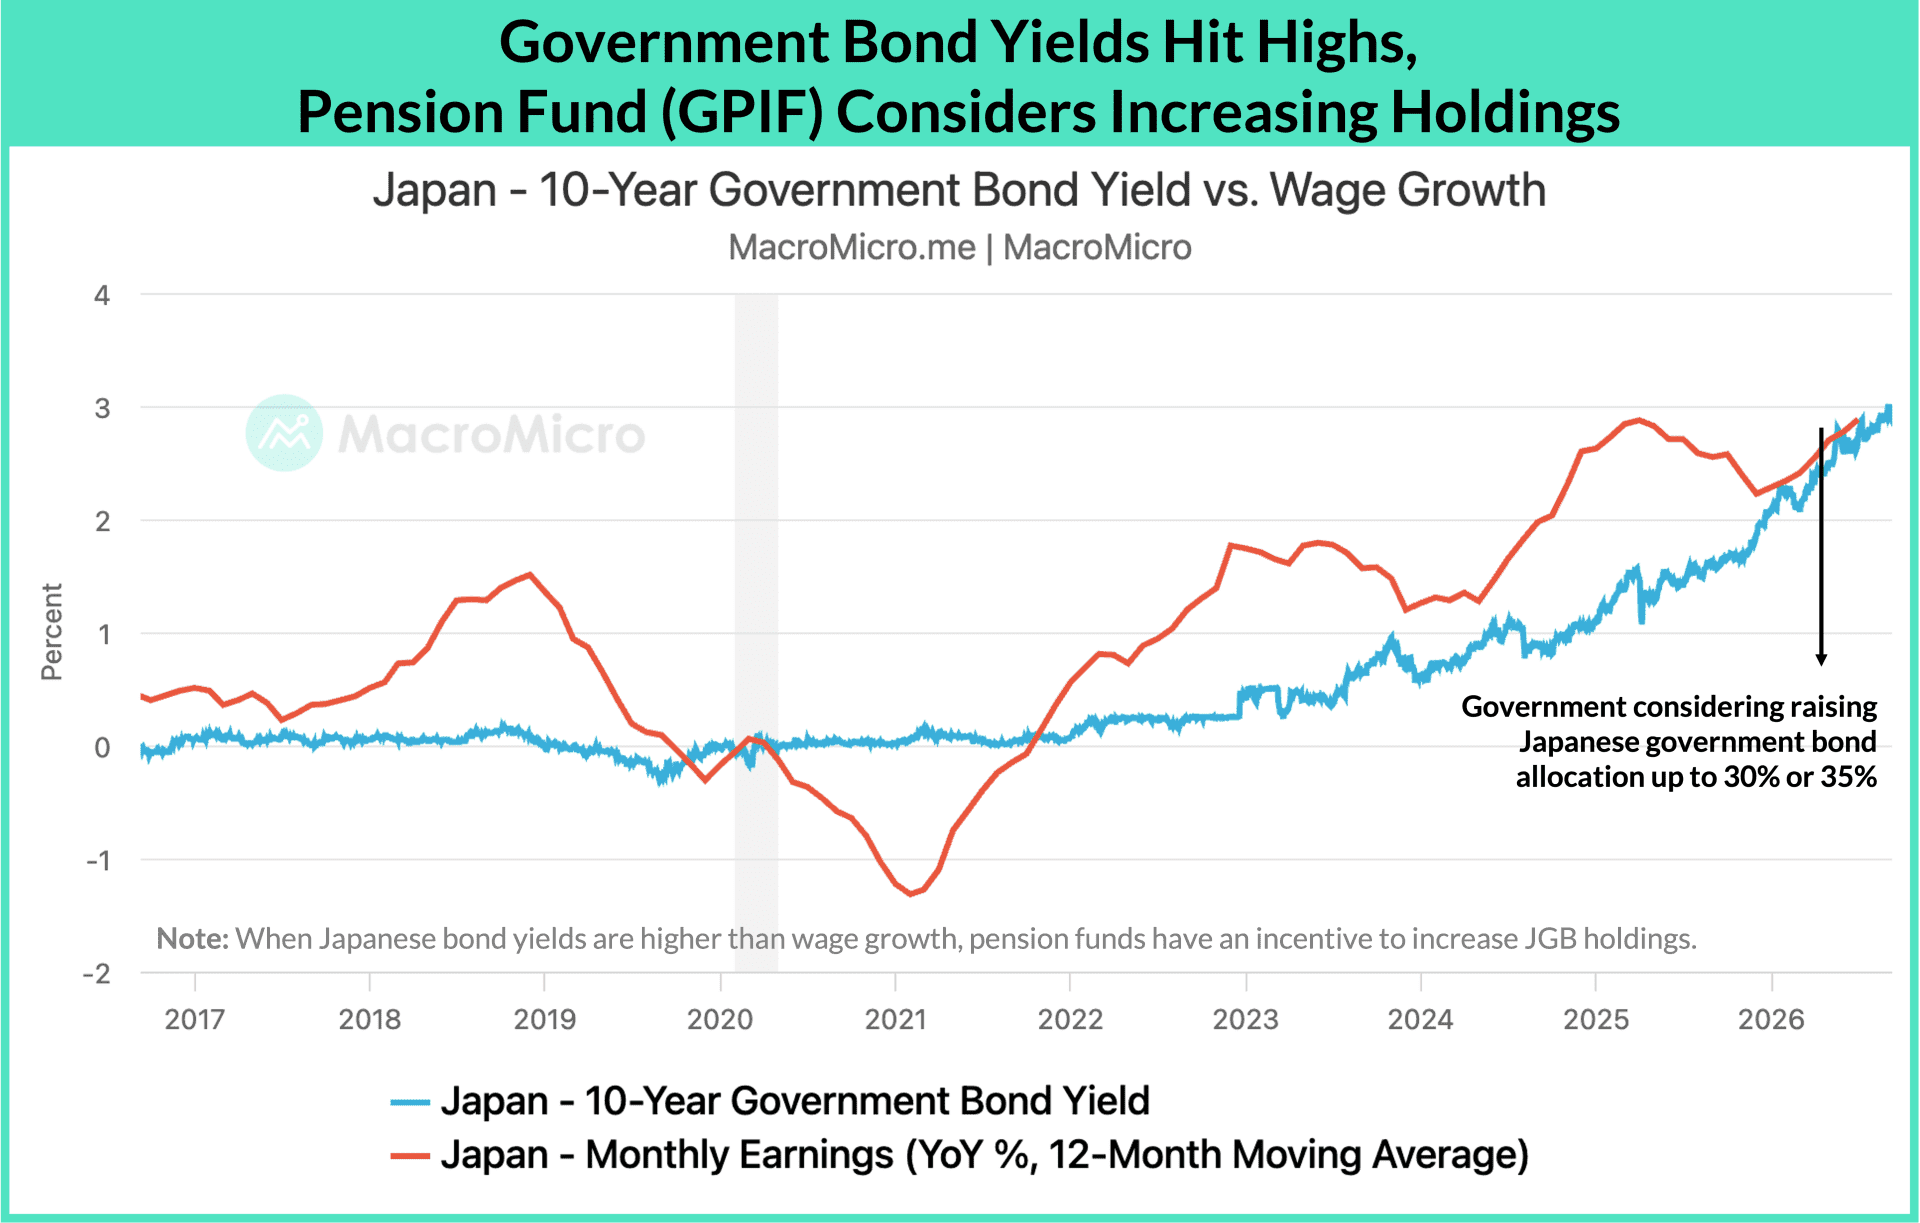
To create demand, the US is channeling money toward Treasuries from two directions. The Fed reinvests maturing MBS principal into bills, and stablecoins, whose reserves are roughly half held in Treasuries, widen the buyer base directly, with TBAC estimating issuers' bill holdings will rise from about $120 billion to $1 trillion by 2028. Japan is targeting its pension system and households: the government is considering raising GPIF's allocation to JGBs from 25% to 30%, which could bring roughly ¥15 trillion into the market, and lawmakers have proposed adding JGB interest income to the NISA tax exemption to draw household savings into JGBs and keep that money from flowing abroad. In Europe, Luxembourg is issuing its first retail bond since 2008, and the UK is studying how to sell T-bills to individuals.
The third group supports market liquidity, and the clearest example is the Fed's repo facility, which lets institutions borrow cash against collateral and, since last year, has a morning window in addition to its afternoon one. Institutions short of cash in the morning can now borrow, so they can hold smaller cash buffers and put the freed funds into activities such as bond trading, which supports bond demand indirectly. These measures help, but each acts on how debt is issued, who buys it or how easily it trades, and none changes the deficits that create the supply.
Growth Is Keeping Pace With Rates, Which Keeps Debt Sustainable & Equities Resilient
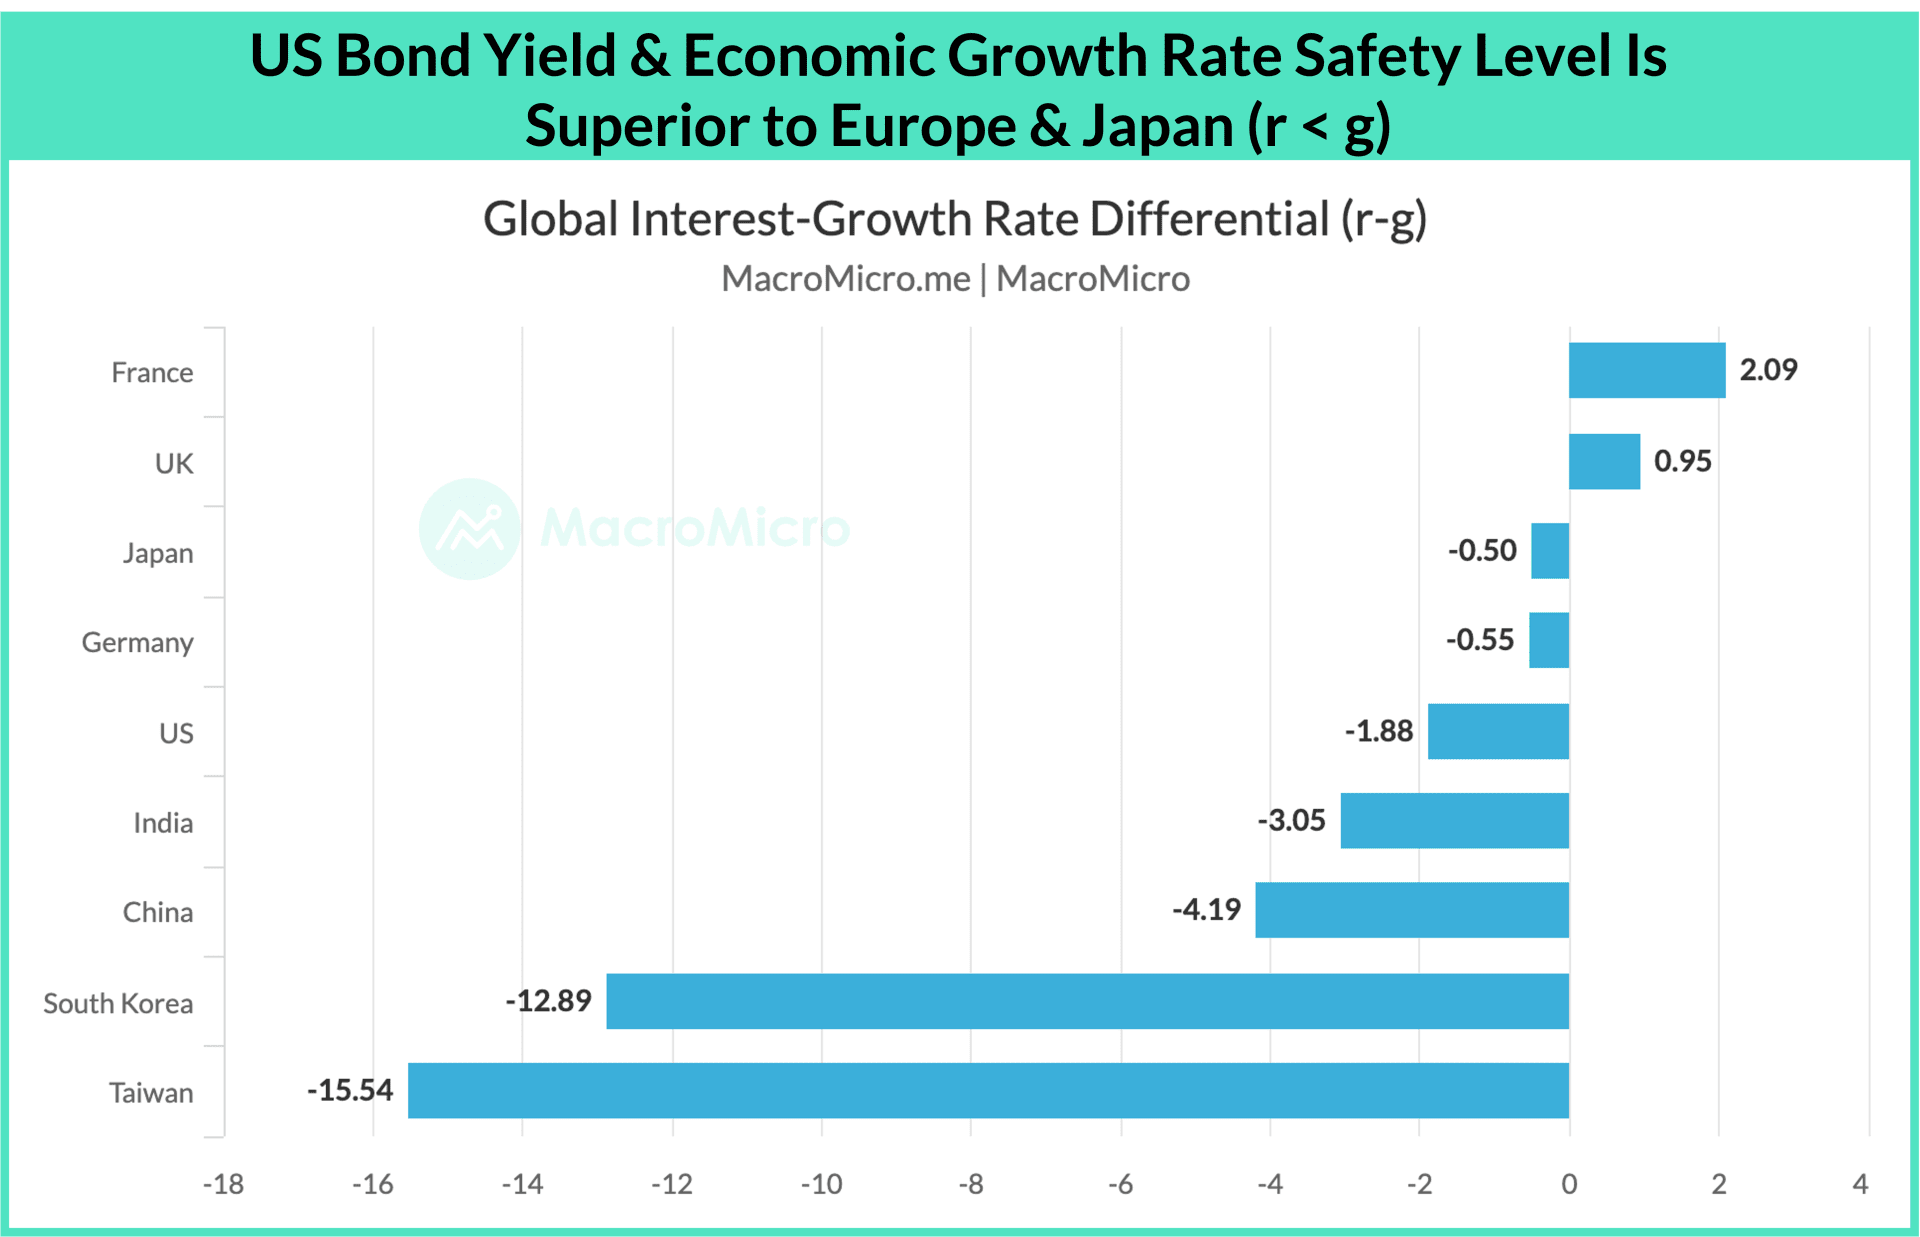
Because deficits stay wide while rates stay high, debt sustainability comes down to growth, as the debt identity shows: the change in the debt ratio equals the deficit ratio plus (r - g) times the current debt ratio, where r is the interest rate and g is economic growth. Governments continue to expand spending, so the deficit term keeps adding to the debt ratio. If growth keeps pace with interest rates, the economy earns income faster than interest compounds on the debt and repayment is not at risk, and the global gap between the two has been flat since 2024.
The US shows how this works for yields. We have treated 4.5% to 5% on the 10-year yield as an important threshold because US nominal GDP grew about 5% in 2025, and yields below that pace looked acceptable. Nominal growth has since exceeded 6% in both Q1 and Q2 2026, so yields have moved into and above that range without visibly suppressing the economy.
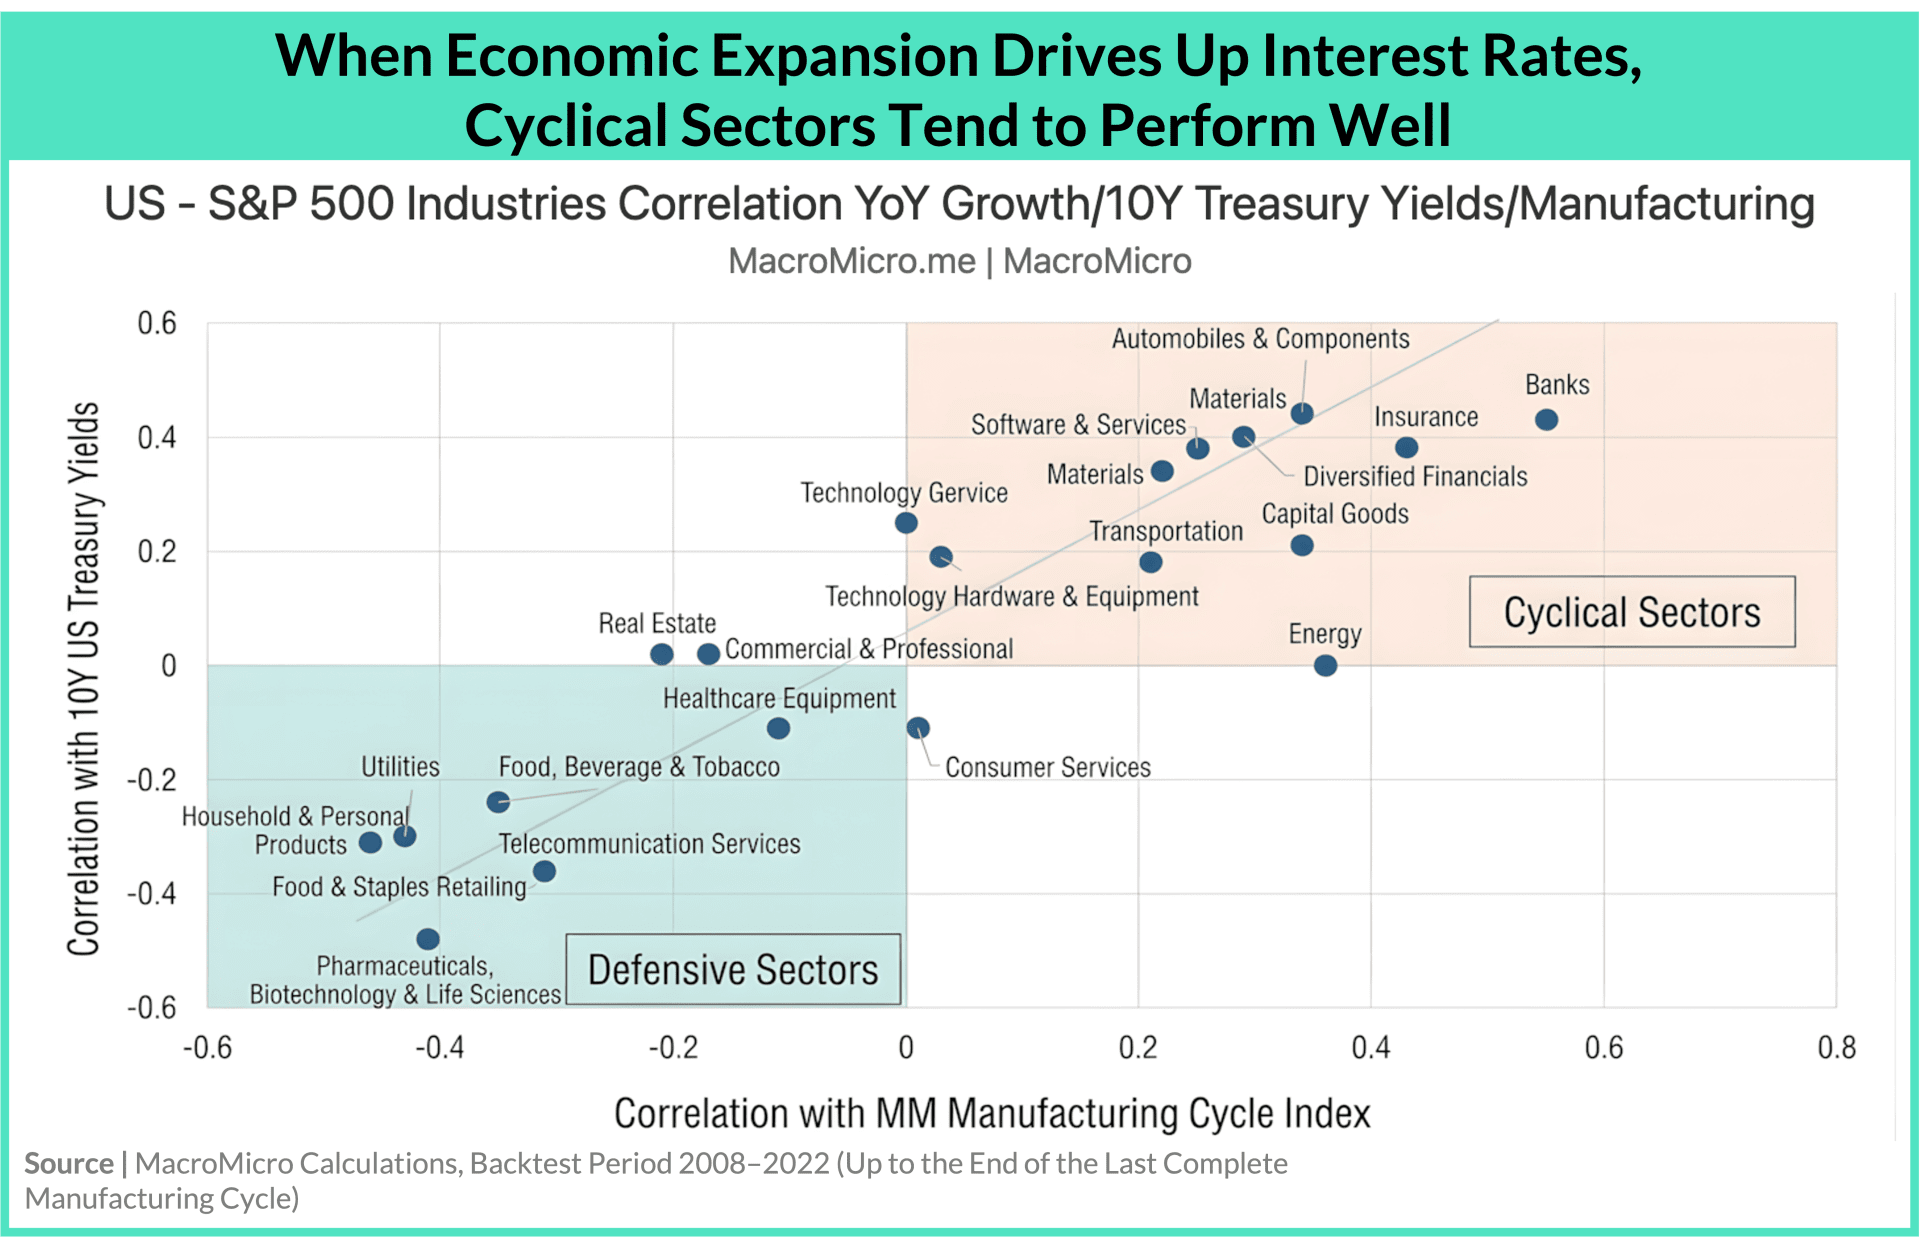
Equity sector behavior supports the same conclusion. Backtests across S&P 500 industries find that cyclical sectors such as technology, software, financials, insurance, autos and capital goods correlate positively with the manufacturing cycle and also with government bond yields, so when an expansion lifts growth expectations and pushes yields up, the higher yields can coincide with improving earnings and need not suppress cyclical stocks.
MM Research Insights
The September hike and the rise in long-term yields trace back to the same cause, a stronger economy. Inflation pressure is concentrated in energy and hardware prices, both of which are set to ease as next year's oil base arrives and suppliers and customers share costs, so we expect two hikes this year and a pause in 2027. Long-term yields have risen with growth expectations, demand for Treasuries and bank lending capacity remain firm, and nominal growth is running ahead of yields, which leaves equities room to absorb them. Repayment capacity in the major developed economies is not in doubt, but that does not make long-dated bonds attractive, because heavy government issuance lets holders collect interest and still lose on price, and central banks outside the US are hiking faster than the Fed. For bond exposure we favor short-dated US Treasuries, which behave like cash and rarely lack buyers, with US money market fund assets approaching $8 trillion and 3-month yields still close to recent lows.
Explore More with Your Exclusive 7-Day Free Trial
Want to explore the data behind these insights? Claim your exclusive 7-day free trial code and experience MacroMicro for yourself. >> Claim Your 7-Day Free Trial
Author: MacroMicro (Ralice)
 Get answers from MM AI.
-
Why did the Federal Reserve implement a rate hike in September despite lingering inflation concerns?
💡The Federal Reserve implemented a rate hike in September because inflation had been above its 2% target for over five years, compounded by the US-Iran conflict creating a second supply shock after previous tariffs. The Fed's projections indicated strong economic growth, remaining above its 2% long-run rate through 2029, which provided the necessary room to tighten monetary policy. Additionally, Q2 GDP was revised up to 2.2% annualized from 1.5%, with consumption contributing significantly, further supporting the view of a resilient economy capable of absorbing the tightening.
-
Is the increase in inflation broadening across sectors, or is it concentrated in specific areas?
💡The increase in inflation is primarily concentrated in energy and hardware sectors, rather than broadening across all sectors. While core PCE rebounded to 0.25% MoM, the annual readings for both headline and core PCE were below expectations due to a BEA methodology revision, indicating a decelerating trend when filtering out monthly noise. Wage growth has slowed to 3.1% YoY, and sticky CPI continues to decelerate, suggesting that inflationary pressure is not spreading across the broader economy. The main drivers for the monthly rebound were gasoline and services gains following weak prior readings, which overstates the underlying pace.
-
When is energy price pressure expected to peak and subsequently ease, impacting overall inflation?
💡Energy price pressure is expected to peak in the second half of 2026, possibly extending into Q1 2027, and then ease as the base effect of this year's oil prices takes hold. The US-Iran conflict pushed crude above $100 per barrel, but supply data show a recovery, with Middle East crude exports reaching 94% of their January 2026 level. Even if oil prices remain flat at $80 to $100 per barrel, headline inflation would cool clearly in 2027 due to the higher base from the current year's conflict, diminishing energy's inflationary impact.
-
What economic indicators suggest the US economy can absorb the recent Federal Reserve tightening?
💡Several economic indicators suggest the US economy can absorb the recent Federal Reserve tightening. Q2 GDP growth was revised up to 2.2% annualized from 1.5%, with consumption contributing 2.5 percentage points, a new high since 2025. Payroll growth, while slowing to 29,000, saw more than half of industries adding jobs, and the rise in unemployment to 4.2% was due to increased labor force participation. The Fed's September projections also raised GDP growth forecasts for 2026 and 2027, with the forecast staying above the 2% long-run rate through 2029, and lowered unemployment to 4.1%, demonstrating a resilient economy.
-
What is MacroMicro's projection for Federal Reserve rate hikes in 2026 and 2027?
💡MacroMicro projects two quarter-point rate hikes by the Federal Reserve in 2026, followed by a pause in 2027. This expectation is based on the assessment that inflation pressure is concentrated in energy and hardware prices, both of which are anticipated to ease. Energy pressure is projected to peak in late 2026 to early 2027 due to base effects, and AI hardware price increases are expected to narrow. This outlook aligns with the Fed's stance of returning inflation to its slowing path sooner, given the economy's resilience.
-
Why are long-term Treasury yields rising while short-term yields show signs of easing?
💡Long-term Treasury yields are rising while short-term yields show signs of easing primarily because the increase at the long end is driven by higher real yields, reflecting upgraded growth expectations. Decomposing the 10-year Treasury yield reveals that since the September FOMC meeting, the increase has predominantly come from the real yield, while breakeven inflation has remained stable. This indicates that the market is not pricing in a loss of inflation control but rather a stronger economic outlook. Short-term rates have a clearer path, but the long end is influenced by these enhanced growth prospects.
-
Does the increase in real yields indicate a stronger growth outlook or a loss of inflation control?
💡The increase in real yields primarily indicates a stronger growth outlook for the economy, rather than a loss of inflation control. This is supported by the stability of breakeven inflation, which measures compensation for inflation, suggesting that the market is not anticipating uncontrolled price increases. A rising real yield alongside stable breakeven inflation is consistent with the upgraded economic growth visible in GDP, consumption, and the Federal Reserve's projections, indicating that corporate earnings and economic fundamentals are expected to remain resilient.
-
What measures are governments implementing to manage the pressure on long-end bond yields?
💡Governments are implementing three main measures to manage pressure on long-end bond yields. Firstly, they are shifting supply towards more short-term bills and fewer long bonds, as long-dated issuance is a primary source of pressure. Secondly, they are creating demand by channeling money towards Treasuries; for instance, the US Fed reinvests maturing MBS principal into bills, and stablecoins are widening the buyer base. Japan is targeting its pension system and households for JGB purchases, and European nations are exploring retail bond sales. Thirdly, governments are supporting market liquidity, exemplified by the Fed's expanded repo facility.
-
How is the global gap between interest rates and economic growth influencing debt sustainability?
💡The global gap between interest rates and economic growth has remained flat since 2024, which is crucial for debt sustainability. According to the debt identity, if economic growth (g) keeps pace with the interest rate (r), the economy generates income faster than interest compounds on the debt, thereby preventing repayment risk. Despite persistent deficits, this stable r-g gap suggests that major developed economies can carry their debt burdens, as growth continues to offset borrowing costs. The US exemplifies this, with nominal GDP growth exceeding 6% in Q1 and Q2 2026, surpassing its 10-year Treasury yields.
-
Which equity sectors correlate positively with rising government bond yields during economic expansions?
💡Cyclical equity sectors such as technology, software, financials, insurance, autos, and capital goods correlate positively with rising government bond yields during economic expansions. Backtests across S&P 500 industries confirm this relationship. When an expansion lifts growth expectations and consequently pushes yields up, these higher yields can coincide with improving earnings in these cyclical sectors. This suggests that during periods of economic strength, rising bond yields do not necessarily suppress these specific cyclical stocks but can instead align with their enhanced performance.
