As the US-Iran war enters its second week with no signs of de-escalation, the macro fallout is intensifying. With Brent & WTI futures holding above $90, inflation fears are surging—putting central banks in a tough dilemma and pressuring global equities.
To help you navigate the chaos, we just launched our US-Iran Conflict Dashboard. Track the latest supply chain, inventory, and macro impacts with 14 essential charts.
Read the Full Report & Unlock Essential Charts with MM Max
How to Redeem the 14 Essential Charts
This dashboard is provided for free to MM Max Annual members. If you are already an MM Max Annual member, welcome to Navigate to "My Rewards" to claim your "US-Iran Conflict Dashboard." If you are not yet a subscriber, welcome to subscribe or upgrade.
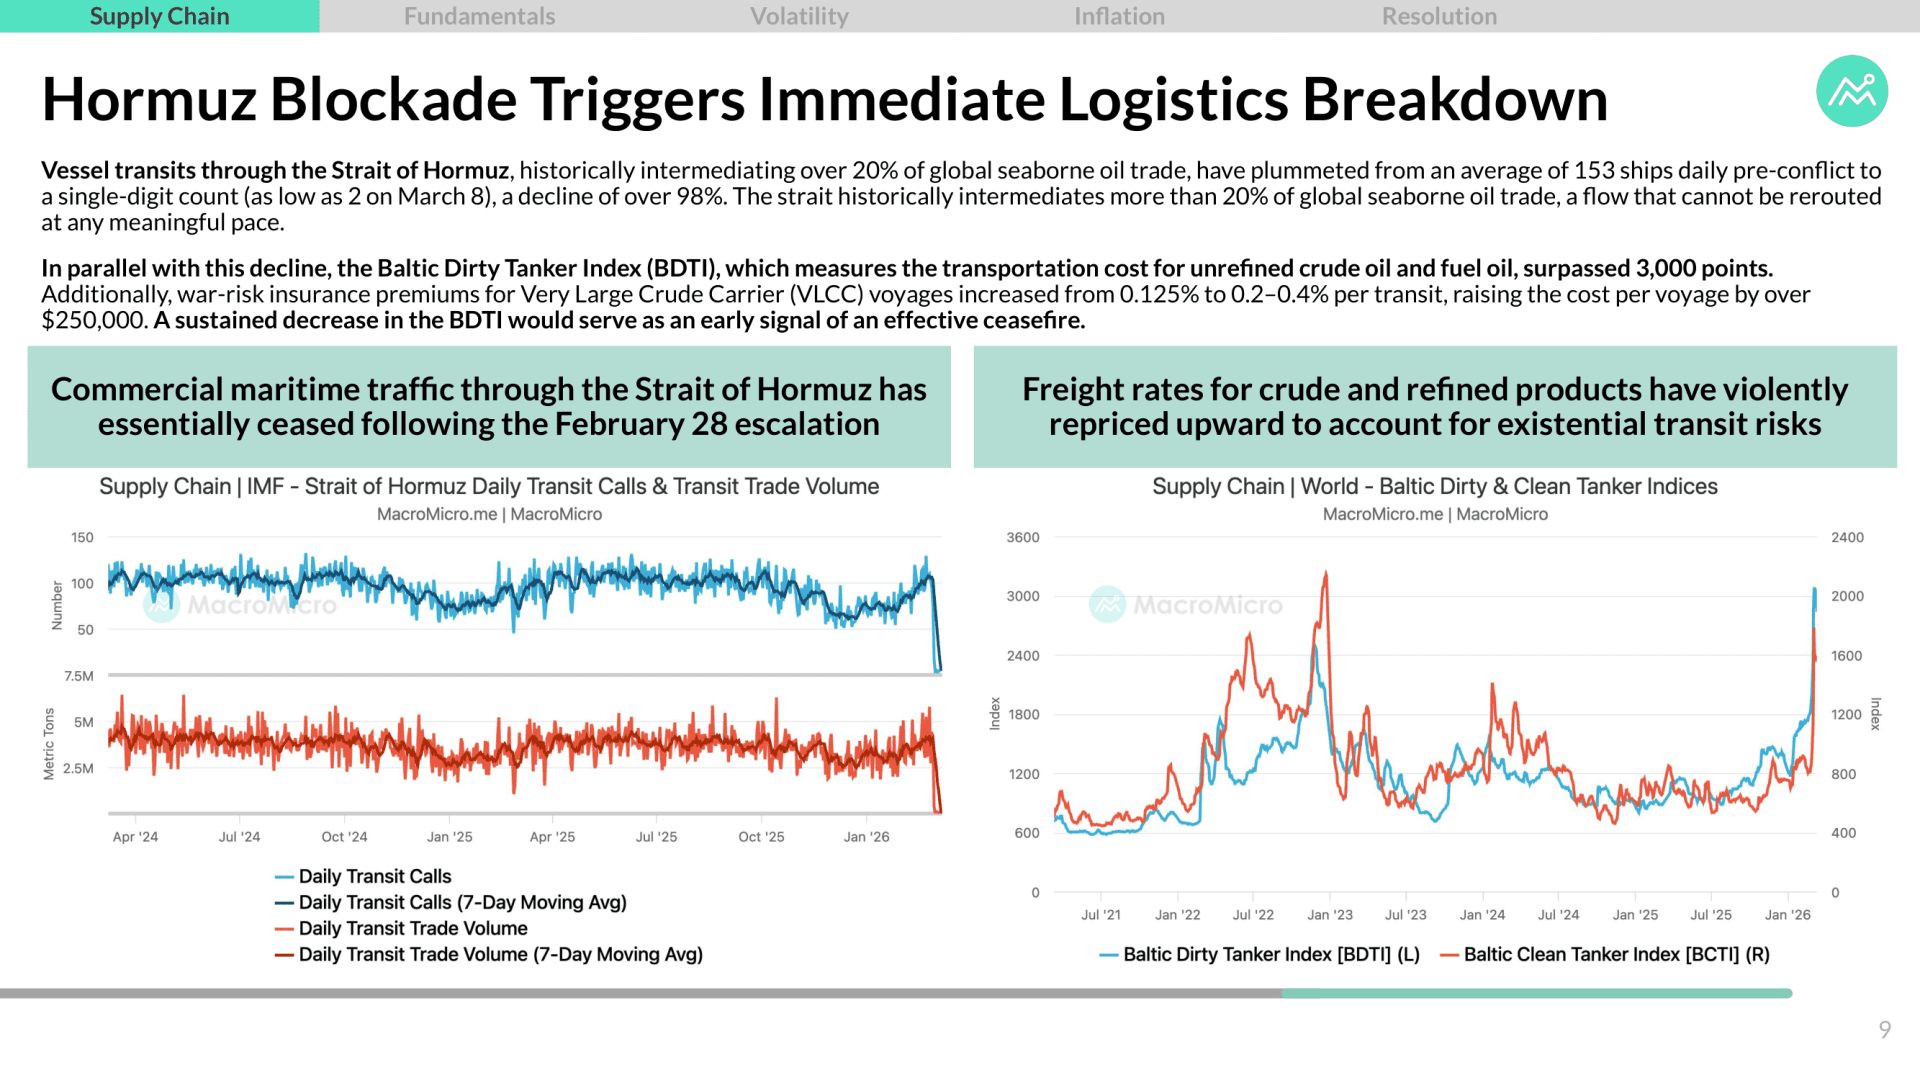
Supply Chain | Hormuz Blockade Triggers Logistics Breakdown
The escalation of the U.S.-Iran conflict has paralyzed the Strait of Hormuz, the world’s most vital energy artery. Following the February 28 escalation, daily vessel transits plummeted by over 98%, falling from 153 to as few as 2 ships by March 8. With bypass pipelines unable to handle even half of the usual volume, the Baltic Dirty Tanker Index (BDTI) has surged past 3,000 points. War-risk insurance premiums for tankers have doubled, adding over $250,000 per voyage, signaling a total rupture in the global maritime supply chain.
💡 Chart Observation: As the current trajectory of the U.S.-Iran war remains highly uncertain, monitoring this chart (BDTI or transit volumes) helps us gauge the severity of the maritime bottleneck. A sustained decline in the BDTI or a rebound in transits will serve as the earliest physical signal of de-escalation and an easing supply chain crisis.
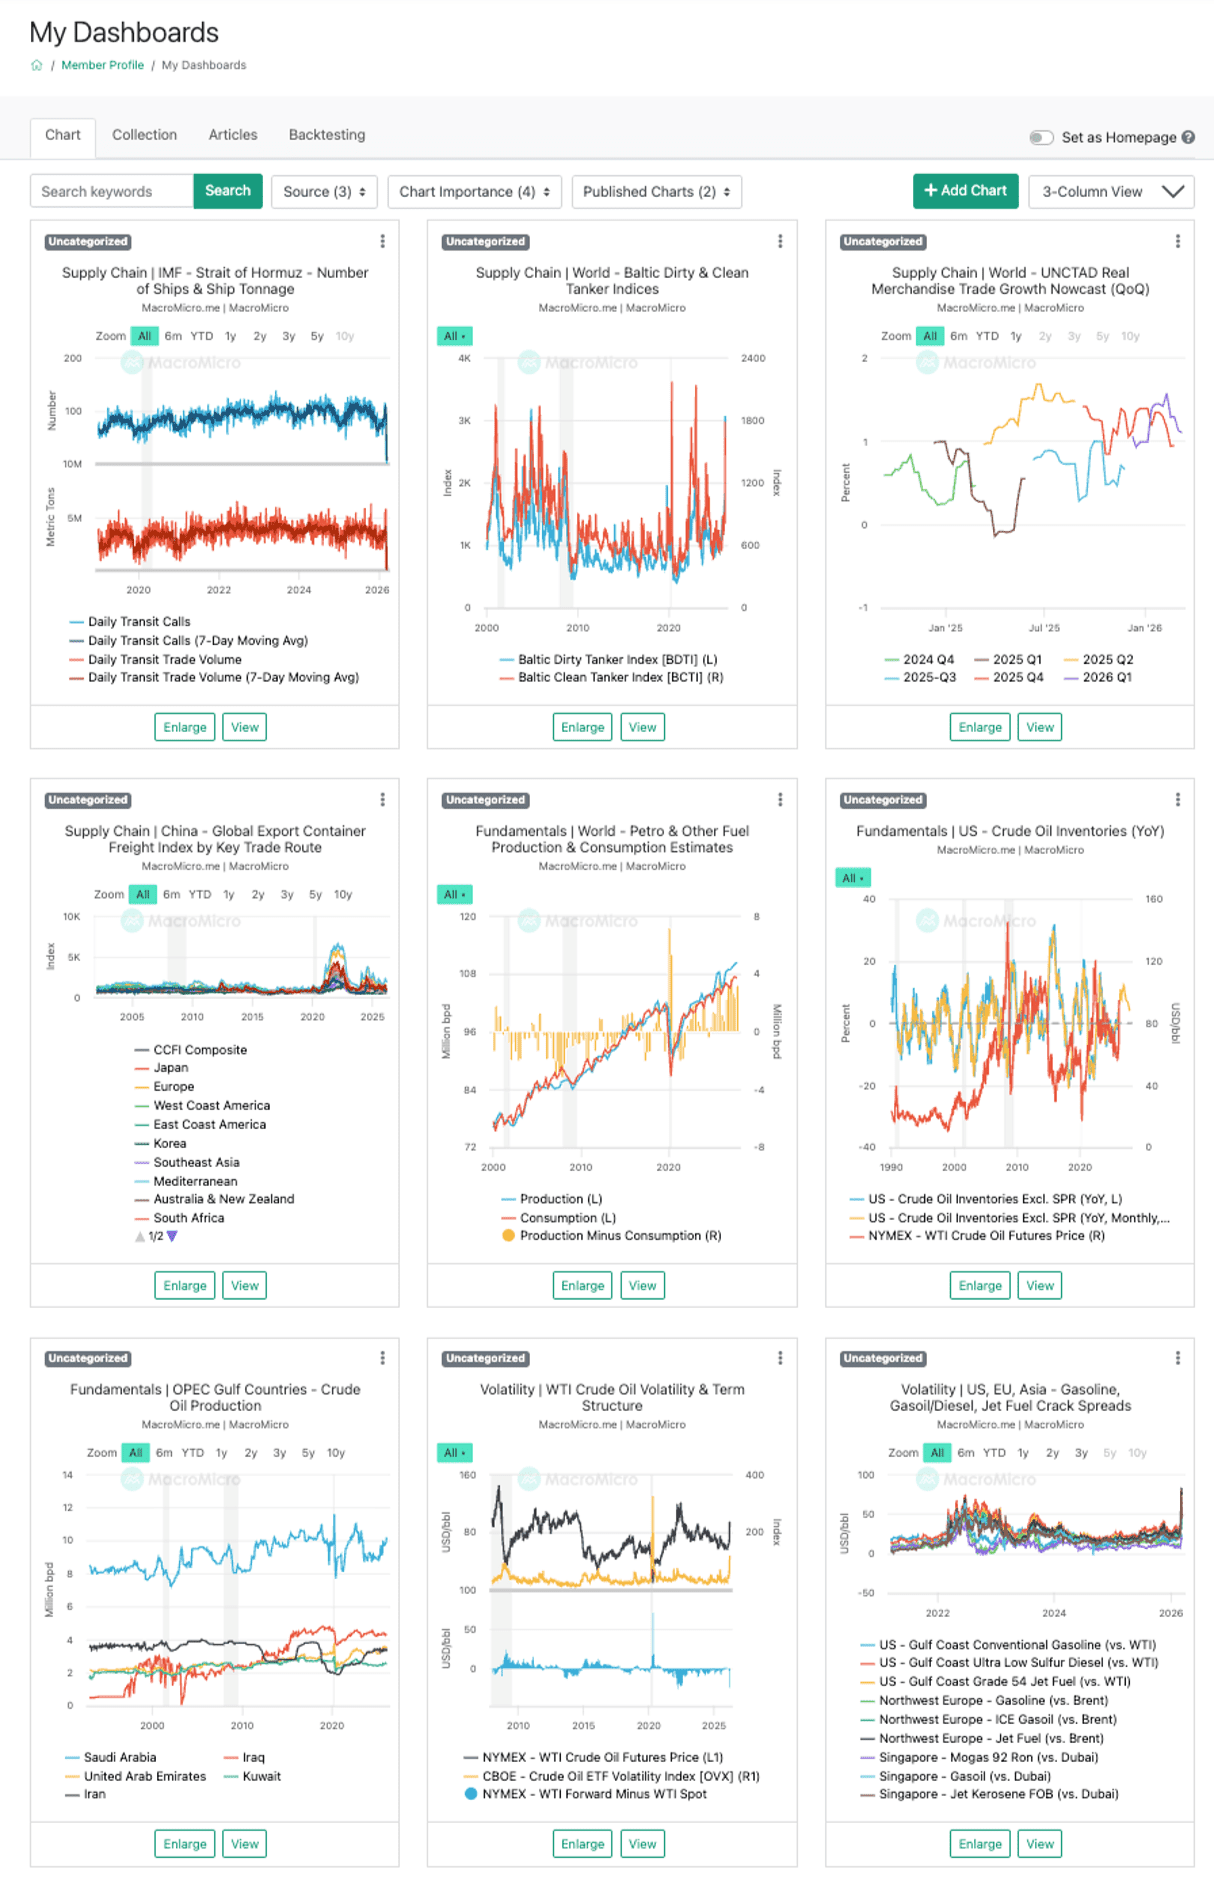
Inventory & Fundamentals | From Oversupply to Acute Shortage
The pre-war global oil surplus of 2.7 million barrels per day has vanished as the Hormuz blockade pushes onshore storage to critical limits. This forced rapid emergency production cuts across the Gulf, including 2.5 million bpd from Saudi Arabia, 1.5 million bpd from Iraq, plus reductions from Kuwait and the UAE. To offset this, the IEA's 32 member nations authorized the largest strategic release in history: 400 million barrels. With IEA public stockpiles at 1.2 billion barrels and industry reserves at 600 million, this massive intervention drains roughly 22% of public holdings, yet physical shortages remain an acute threat.
💡 Chart Observation: With the U.S.-Iran war trajectory remaining highly uncertain...
Read the Full Report & Unlock Essential Charts with MM Max
How to Redeem the 14 Essential Charts
This dashboard is provided for free to MM Max Annual members. If you are already an MM Max Annual member, welcome to Navigate to "My Rewards" to claim your "US-Iran Conflict Dashboard." If you are not yet a subscriber, welcome to subscribe or upgrade.
Already a subscriber? Click here to log in.
Full Access to Our Services

Comprehensive data at your service
with key indicators for investment insights

Exclusive flash reports
on key events and data

Create your own charts and analysis
including performance backtesting

Hub of professionals to engage
in meaningful discussions and insights
 Get answers from MM AI.
-
How has the US-Iran conflict impacted daily vessel transits in the Strait of Hormuz?
💡Daily vessel transits in the Strait of Hormuz plummeted by over 98%, falling from 153 ships to as few as 2 ships between February 28 and March 8, due to the escalation of the U.S.-Iran conflict.
-
What impact has the conflict had on the Baltic Dirty Tanker Index (BDTI)?
💡The Baltic Dirty Tanker Index (BDTI) has surged past 3,000 points, indicating a severe bottleneck in maritime logistics as bypass pipelines cannot handle even half of the usual volume after the Hormuz blockade.
-
Which Gulf nations implemented emergency oil production cuts due to the Hormuz blockade?
💡Saudi Arabia, Iraq, Kuwait, and the UAE implemented forced rapid emergency oil production cuts due to the Hormuz blockade, with Saudi Arabia cutting 2.5 million bpd and Iraq cutting 1.5 million bpd.
-
What was the scale of the IEA's strategic oil release in response to the conflict?
💡The IEA's 32 member nations authorized the largest strategic release in history, totaling 400 million barrels, in response to the conflict to offset production cuts and acute physical shortages.
-
How much of the IEA's public stockpiles were drained by the strategic oil release?
💡Roughly 22% of the IEA's public stockpiles, which stood at 1.2 billion barrels, were drained by the 400-million-barrel strategic oil release, yet physical shortages remain an acute threat.
-
What does extreme backwardation in crude oil futures indicate about physical supply?
💡Extreme backwardation in crude oil futures indicates an acute physical crunch, where refiners pay massive premiums for immediate delivery over future contracts due to the physical absence of crude.
-
How have rising oil prices affected global central bank monetary policy stances?
💡Rising oil prices, up over 40% year-over-year, have halted the global trend toward lower interest rates, forcing central banks to shift from accommodative stances to more hawkish monetary policies.
-
What are the new expectations for the Fed's rate cuts after the conflict began?
💡New expectations for the Fed's rate cuts after the conflict began have been delayed until September and halved from 50bp to 25bp, signaling a prolonged restrictive monetary environment.
-
What does Polymarket data suggest about the probability of a ceasefire by June 30?
💡Polymarket data suggests there is a 70% probability of a ceasefire by June 30, but only a 22% probability by March 31, with the March 31 Xi-Trump summit being a key event trade.
-
How might political pressure in the US influence diplomatic intervention in the conflict?
💡Political pressure in the US, with Democrats priced at ~85% to win the House in November, incentivizes the administration to seek diplomatic intervention before the end of Q2 to stabilize consumer sentiment and address high fuel prices, which are acute political liabilities.
