What You Should Know
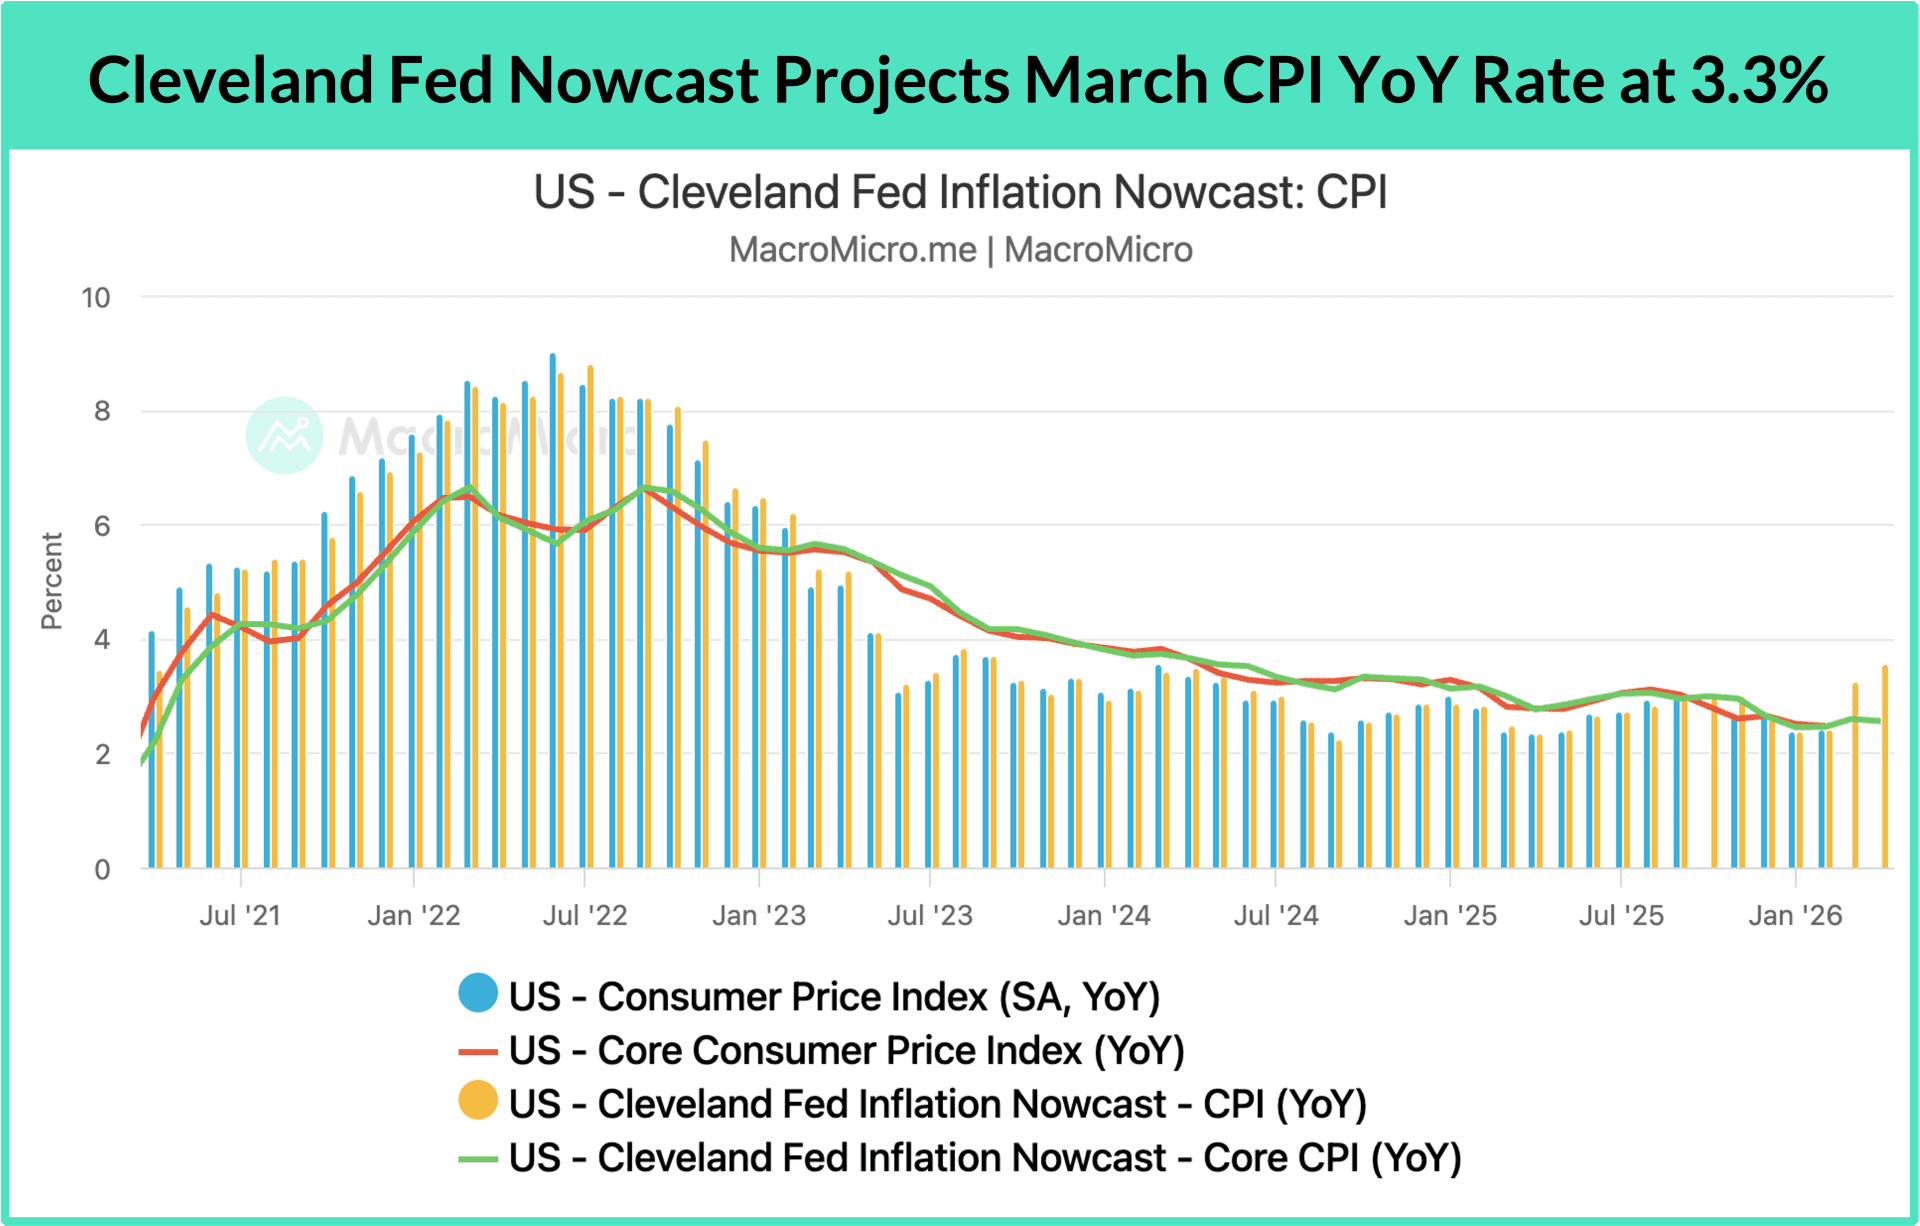
Following the outbreak of the US–Iran conflict, markets have been highly focused on geopolitical developments. The surge in oil prices is expected to push CPI higher, with the Cleveland Fed projecting March CPI (to be released on April 10) to reach 3.3% YoY. However, we observe that price pressures had already been quietly building before the conflict.
In January and February 2026, PPI exceeded expectations for two consecutive months, with YoY growth surpassing 3%. Meanwhile, the Prices subcomponent of the ISM Manufacturing Index surged to 70.5 in February and further climbed to 78.3 following the March escalation, marking the highest level since July 2022.
These signals suggest that price pressures had already been forming within supply-demand dynamics prior to March. Where exactly are these pressures coming from? And with the added shock from oil prices, does the risk of runaway inflation increase significantly? We take a different view; this report provides a full breakdown.
Key Takeaways:
- What’s driving inflation? Beyond the post-conflict oil surge lifting short-term CPI, certain goods prices are rising due to two main forces: tariffs and an AI-driven manufacturing recovery.
- Is runaway inflation a real risk? We analyze this through two lenses: energy shocks and AI/manufacturing-driven price pressures.
Given the ongoing Middle Eastern conflict developments, we have consolidated related research content on our blog.
I. What’s Driving Inflation?
Naturally, when discussing commodity price hikes, we must address the US-Iran war situation. During the spring break weekend, Trump once again issued an "ultimatum" to Iran, stating that if Iran did not agree to restore full passage through the Strait of Hormuz by 8:00 PM EST on April 7, the US would strike Iranian civilian infrastructure such as power plants and bridges, even threatening that "an entire civilization will perish tonight."
However, less than two hours before the deadline, the situation reversed dramatically. Trump announced a two-week temporary ceasefire agreement with Iran. During this period, Iran must allow ships to safely pass through the Strait of Hormuz. Representatives from the US and Iran are expected to meet on April 10 in Islamabad, the capital of Pakistan, to commence further negotiations on the 10-point peace plan proposed by Iran. Following this news, both Brent and WTI crude oil futures plummeted, falling from their previous highs of over $110 down to around $95.
Despite this, oil prices remain elevated compared to pre-conflict levels. We expect short-term CPI to inevitably be pushed higher. This is already evident in the early data released by the Eurozone, where overall inflation in March surged to 2.5% (up from 1.9%) on the back of rising oil prices. The US March CPI will subsequently be released on April 10. Assuming the US national average gasoline price remains at its current high of around $4 per gallon, we estimate the CPI YoY growth rate will jump to...
Will inflation spiral out of control? This comprehensive breakdown of the geopolitical energy shock, the AI-driven supply squeeze, historical productivity parallels, and upcoming Fed pivots is exclusive to MM Max subscribers. Unlock full access to this report, proprietary interactive charts, and our ongoing coverage of these fast-evolving macro trends. Subscribe Now»
Already a subscriber? Click here to log in.
Full Access to Our Services

Comprehensive data at your service
with key indicators for investment insights

Exclusive flash reports
on key events and data

Create your own charts and analysis
including performance backtesting

Hub of professionals to engage
in meaningful discussions and insights
 Get answers from MM AI.
-
What key economic indicators suggested building price pressures before the US-Iran conflict?
💡Key economic indicators suggesting building price pressures before the US-Iran conflict included the Producer Price Index (PPI) exceeding expectations for two consecutive months in January and February 2026, with YoY growth surpassing 3%. Additionally, the Prices subcomponent of the ISM Manufacturing Index surged to 70.5 in February and further climbed to 78.3 following the March escalation, marking its highest level since July 2022, indicating pre-existing supply-demand dynamics.
-
How does AI-driven demand contribute to rising prices for raw materials and electronic components?
💡AI-driven demand contributes to rising prices for raw materials and electronic components by intensifying supply shortages, particularly for items like aluminum and copper used in server racks, thermal components, and cable connections. Computer and electronics-related components within the PPI have seen massive gains, with Electronic Components and Accessories experiencing a nearly 18% YoY growth rate due to cost pressures reflected in price adjustments. This indicates producers are passing cost increases to end consumers, as seen in the Computer Software and Accessories CPI component maintaining over 5% YoY growth.
-
What role does AI expansion play in sustaining manufacturing activity and capital equipment investments?
💡AI expansion sustains manufacturing activity and capital equipment investments by spilling over into non-AI sectors, keeping overall manufacturing robust, as indicated by the MM Manufacturing Cycle Index's upward turn in the second half of last year. This renewed demand has led enterprises to increase investments, with the YoY growth rate for Private Capital Equipment within the PPI steadily rebounding from 2.7% in early 2025 to its current level of 4%. Furthermore, post-conflict inventory replenishment for defense and military resources will further support manufacturing momentum, exerting upward pressure on manufactured goods prices.
-
Why is runaway inflation considered unlikely despite current price pressures?
💡Runaway inflation is considered unlikely despite current price pressures because the impact of tariffs is expected to be a one-time price adjustment that diminishes over time, and the energy shock is anticipated to be short-term, contained within a single quarter. Additionally, "sticky" inflation, particularly shelter services like Rent of Primary Residence and Owners' Equivalent Rent, which account for over 40% of CPI, is expected to continue decelerating throughout 2026 due to increasing rental supply and a stagnant labor market, preventing a broad-based resurgence in core inflation.
-
How has the energy supply structure changed since the 1970s, affecting current oil price shocks?
💡The energy supply structure has significantly changed since the 1970s, making current oil price shocks less impactful. In the 1970s, OPEC crude oil production exceeded 50% of the global total, whereas today, the United States accounts for up to 20% of global production. This increased US production means that negative impacts of high oil prices on employment and economic activity are partially offset by increased profits for US oil companies and potential expansion in drilling activities, unlike the past.
-
Why is the economy less vulnerable to energy price shocks today compared to the 1970s?
💡The economy is less vulnerable to energy price shocks today compared to the 1970s due to advancements in technology and energy efficiency. Energy's share of overall consumption and GDP has steadily declined, with energy-related expenditures as a percentage of overall Personal Consumption Expenditures (PCE) dropping from around 40% in the 1970s to 24% today. Furthermore, the energy intensity of GDP has decreased by nearly 40% since 2000, making it extremely difficult for soaring oil prices to replicate the scale of inflation and economic shocks seen in the 1970s.
-
How do AI and manufacturing-driven price hikes lead to industry structural optimization?
💡AI and manufacturing-driven price hikes lead to industry structural optimization by incentivizing manufacturers to accelerate their transition to next-generation products through direct and indirect pathways. Direct beneficiaries see expanding demand for new products, triggering price hikes and investments in production capacity, while indirect beneficiaries experience capacity crowding-out for older products, causing shortages and price increases. This process ultimately leads to generational turnover, boosting overall productivity and optimizing industry structure.
-
How can productivity improvements driven by AI help suppress medium-to-long-term inflationary pressures?
💡Productivity improvements driven by AI can help suppress medium-to-long-term inflationary pressures by incentivizing manufacturers to accelerate their transition to next-generation products, leading to industry structural optimization and an expansion of aggregate supply. This echoes the 1990s phenomenon where a productivity boom, driven by the internet, kept inflation near the 2% target despite a tight labor market. The accelerating productivity following ChatGPT's emergence suggests a similar pathway, where increased output and efficiency can offset price increases over time.
-
What market developments should be observed in April to assess the impact of the US-Iran conflict?
💡In April, crucial market developments to observe for assessing the impact of the US-Iran conflict include the release of US March CPI data on April 10, which will begin to reflect the material impact of the conflict. This period will also involve the market repeatedly testing the bottom, with reactions to negative data serving as a key indicator. The ongoing US-Iran situation's phased progress and potential outcomes ahead of the Trump-Xi summit will also be critical.
-
What factors could lead the market to an upward trend after data tests the bottom?
💡Factors that could lead the market to an upward trend after data tests the bottom include a gradual dulling of the market's reaction to negative data, Kevin Warsh taking over as Fed Chair after mid-May, and the US-Iran situation achieving phased progress ahead of the Trump-Xi summit. These developments, combined with an anchoring by productivity improvements, could enable the market to pivot back to an upward trajectory following the period of data testing the bottom.
