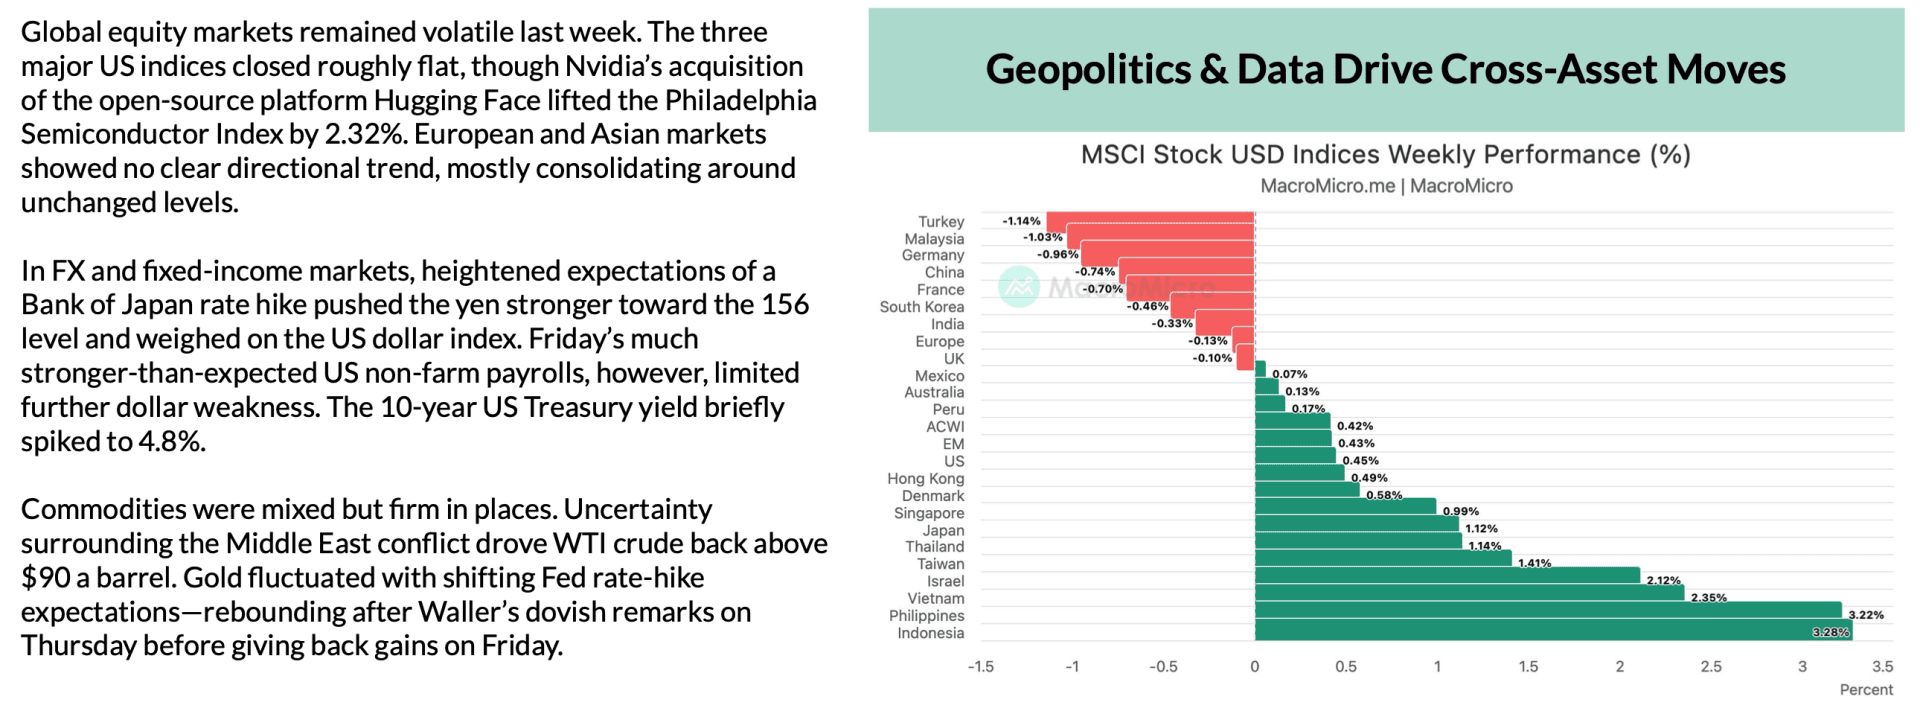
Global equity markets stayed volatile last week. The three major US indices closed roughly flat, though Nvidia's acquisition of Hugging Face lifted the Philadelphia Semiconductor Index 2.32%. Bank of Japan rate-hike expectations pushed the yen toward 155, but Friday's much stronger-than-expected payrolls limited dollar weakness. The 10-year Treasury yield briefly spiked to 4.8% and WTI reclaimed $90.
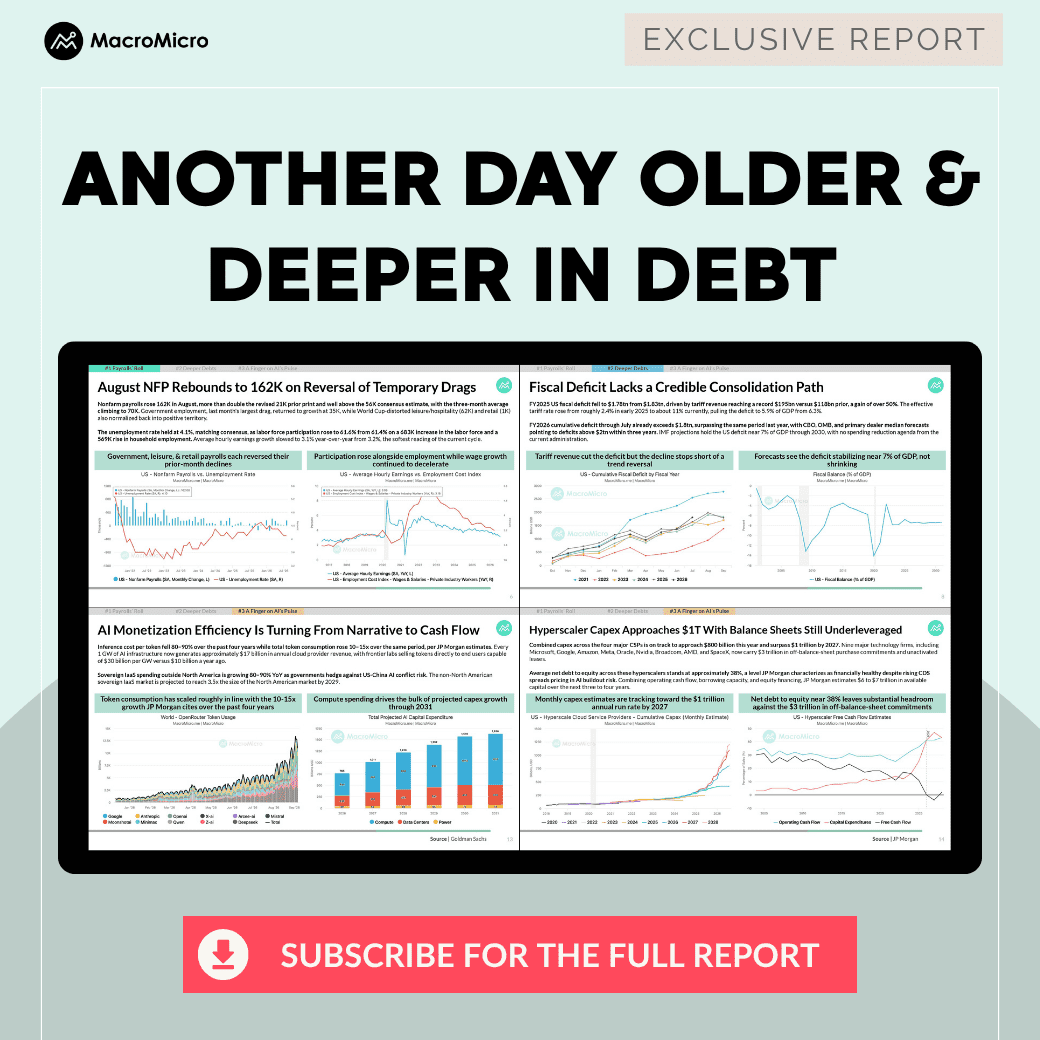
This week’s WEFC covers three themes: a payrolls rebound, rising bond yields, and AI’s shift from hype to cash flow as bottlenecks move downstream to packaging, memory, and power.
This Week's WEFC Preview
Weekly Market Roundup: Volatility Amid Geopolitics, Policy Shifts & Strong US Data
- The three major US indices closed roughly flat while semis outperformed. Nvidia's acquisition of the open-source platform Hugging Face lifted the Philadelphia Semiconductor Index by 2.32%. European and Asian markets showed no clear directional trend, mostly consolidating around unchanged levels.
- Heightened Bank of Japan rate-hike expectations pushed the yen toward 155. That weighed on the US dollar index, though Friday's much stronger-than-expected non-farm payrolls limited further dollar weakness. The 10-year Treasury yield briefly spiked to 4.8%.
- WTI crude moved back above $90 a barrel on Middle East uncertainty. Gold fluctuated with shifting Fed rate-hike expectations, rebounding after Waller's dovish remarks on Thursday before giving back gains on Friday.
- Energy and the yen led cross-asset performance. WTI (+7.38%) and Brent (+6.93%) topped commodities while wheat fell 5.35%; the yen gained 2.26% against a 0.27% decline in the dollar index. Utilities (+1.94%) led S&P sectors and consumer discretionary (-1.41%) lagged. Performance covers Monday, August 31 to Sunday, September 6.
▌Related Charts:Forex market · Commodity market · Bond market
Payrolls' Roll: August Rebound Puts the September Decision on Core CPI
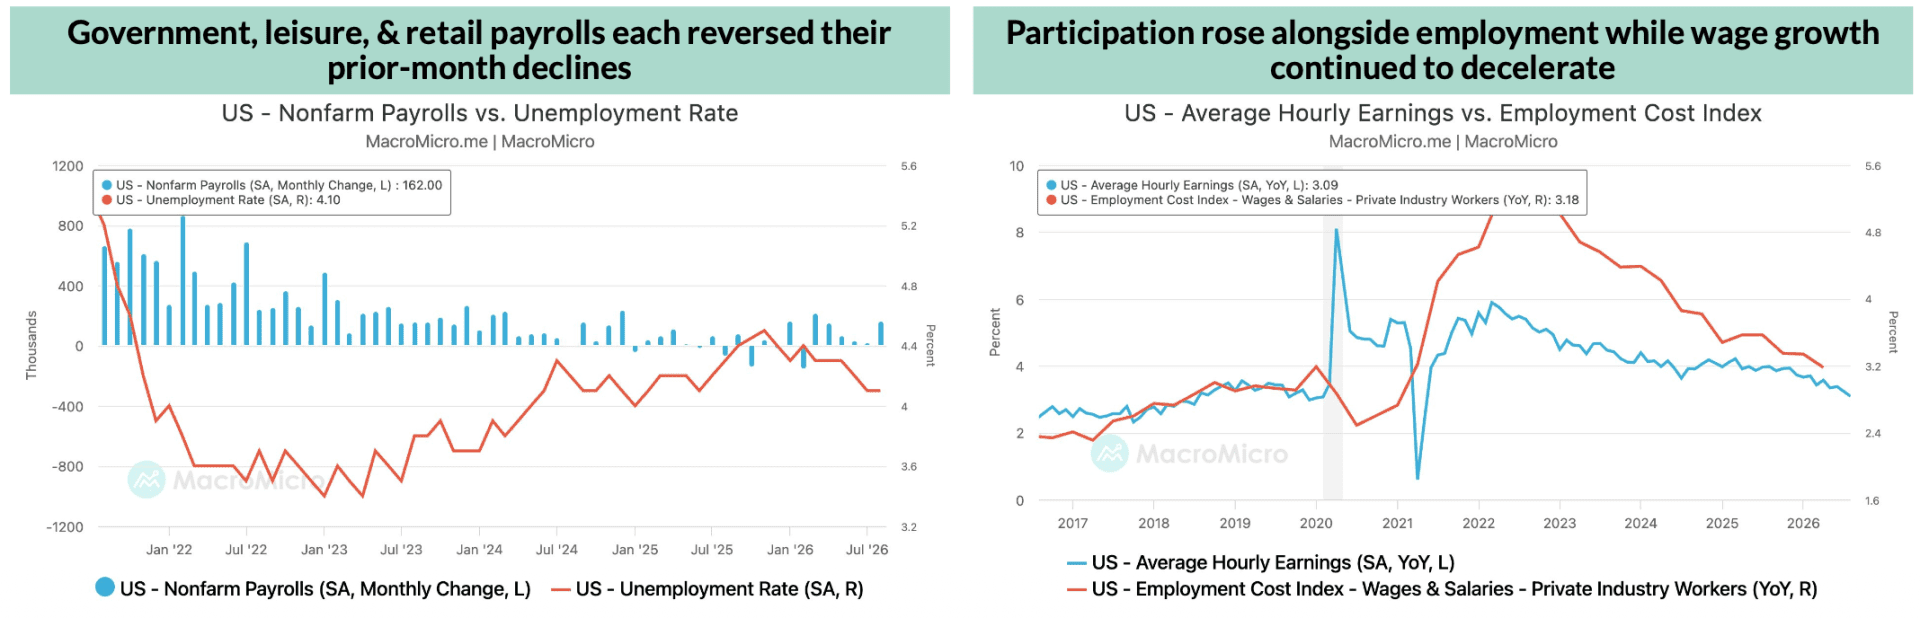
- August nonfarm payrolls rose 162K, more than double the revised 21K prior print. That was well above the 56K consensus estimate, lifting the three-month average to 70K.
- Last month's largest drags reversed. Government employment returned to growth at 35K, while World Cup-distorted leisure/hospitality (62K) and retail (1K) also normalized back into positive territory.
- Unemployment held at 4.1% as participation rose to 61.6% from 61.4%. The labor force grew 683K and household employment rose 569K, matching consensus on the headline rate.
- Average hourly earnings growth slowed to 3.1% year-over-year from 3.2%, the softest reading of the current cycle.
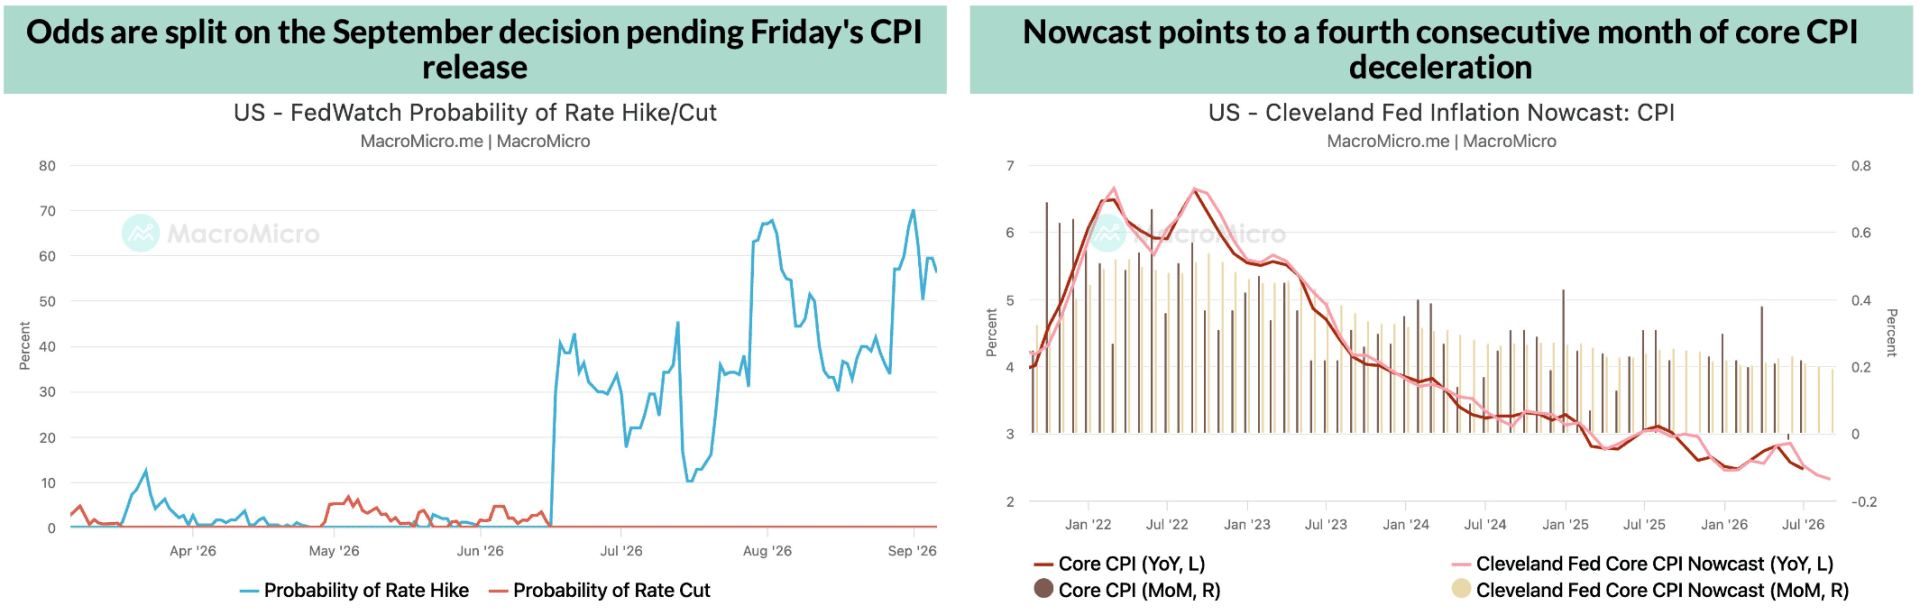
- Core CPI is now the decisive input for September. Fed Governor Waller stated on September 3 that an in-line print would support holding rates steady, while an upside surprise could justify a hike. The Cleveland Fed's nowcast points to core CPI holding at 0.2% month-over-month, bringing the year-over-year rate down to 2.4% from 2.5% and supporting a high probability of a hold.
▌Related Charts: US - Nonfarm Payrolls (Monthly Change, Cumulative Revisions of Past 2 Months)· US - Nonfarm Payrolls by Sector (Monthly Change) · US - Labor Supply & Demand vs. Unemployment Rate · US - Hourly Wage Growth (YoY)
Deeper Debts: No Credible Consolidation Path, So Growth Has to Do the Work
- The FY2025 deficit fell to $1.78tn from $1.83tn on record tariff revenue. Tariff receipts reached $195bn versus $118bn prior, a gain of over 50%, as the effective tariff rate rose from roughly 2.4% in early 2025 to about 11%, pulling the deficit to 5.9% of GDP from 6.3%.
- The decline stops short of a trend reversal. FY2026's cumulative deficit through July already exceeds $1.8tn, surpassing the same period last year. CBO, OMB and primary dealer median forecasts point to deficits above $2tn within three years, and IMF projections hold the US near 7% of GDP through 2030.
- Issuance is shifting to the front end. The 3-month bill yield sits at 3.9% with money market fund assets approaching $8tn, and bills now make up 22% of outstanding Treasury debt versus roughly 15% pre-pandemic. Treasury's August refunding language shifted from assessing "increases" to "changes" in coupon auction sizes.

Subscribe Now to Download the Full Report
About Weekly Economic and Financial Commentary (WEFC)
The MacroMicro WEFC is published weekly, delivering rigorous analysis and in-depth insights on the most critical market-moving events. Coverage spans equities, foreign exchange, bonds, commodities, global central banks, geopolitics, and the international political economy.
At its core is a concise, roughly 20-page Chart Pack designed to help you grasp market trends at a glance. Subscribe Now » to download the full PDF report, lock in the current offer before prices rise and secure your future upgrade to Max AI with full AI access.
Already a subscriber? Click here to log in.
Full Access to Our Services

Comprehensive data at your service
with key indicators for investment insights

Exclusive flash reports
on key events and data

Create your own charts and analysis
including performance backtesting

Hub of professionals to engage
in meaningful discussions and insights

