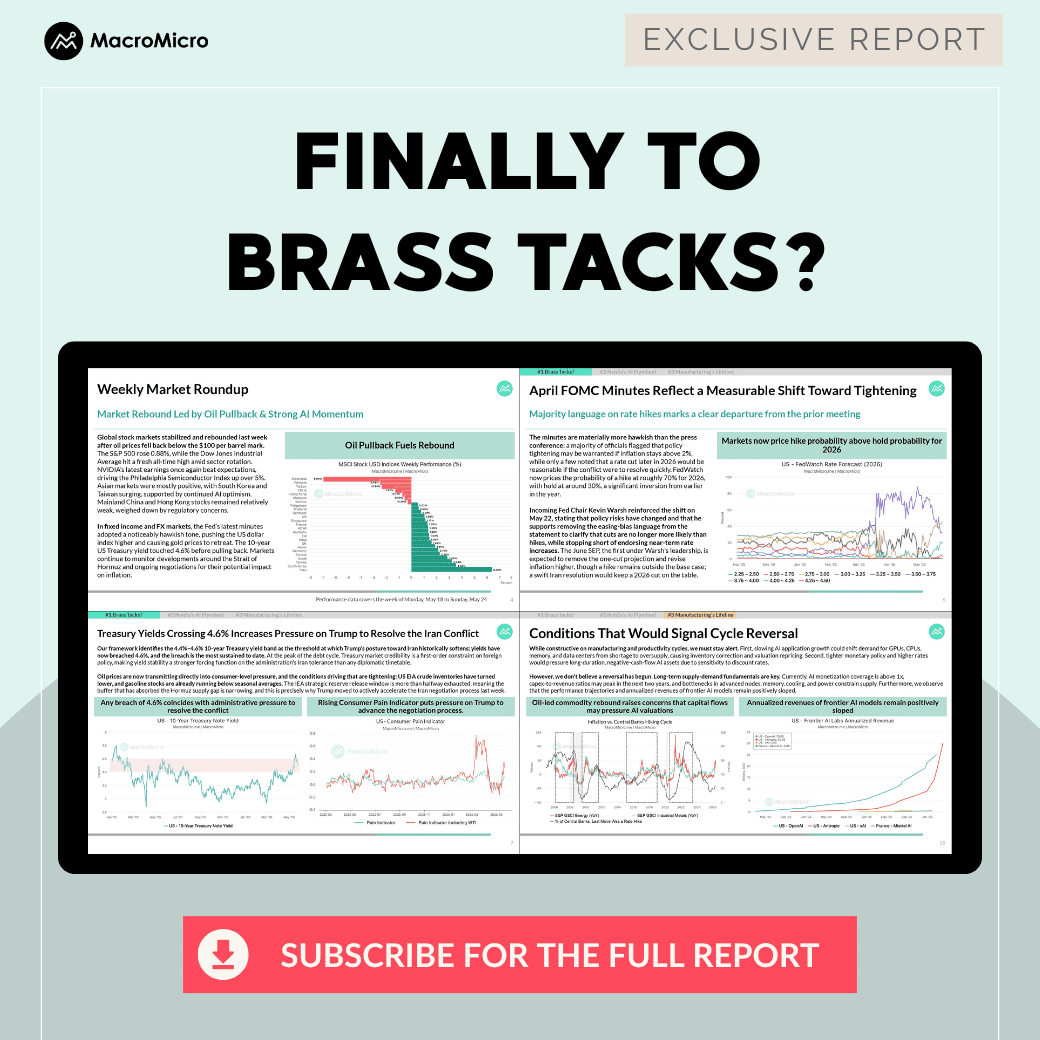
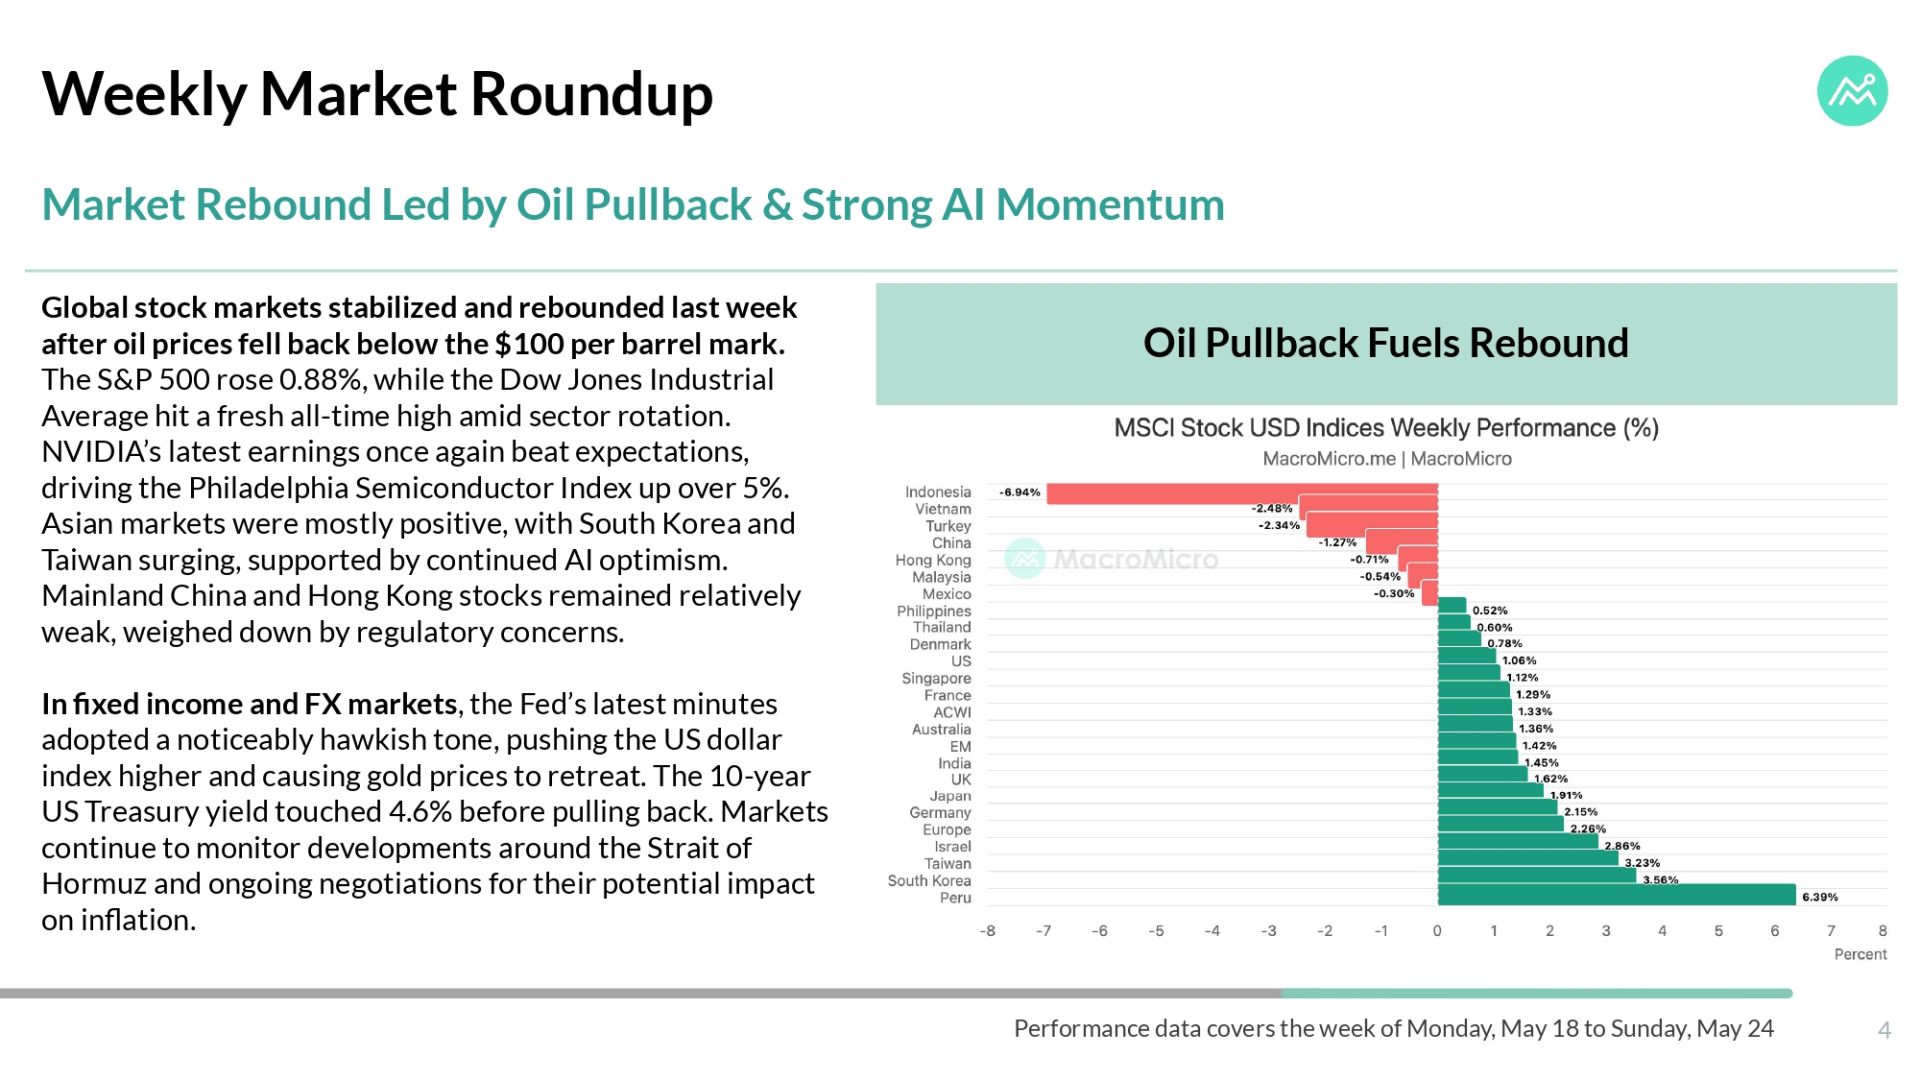
Last week, oil prices fell back below the $100 mark as US–Iran negotiations showed signs of progress, helping global equities stabilize and rebound, with several major markets reaching new highs. Meanwhile, Warsh formally took over as FOMC Chair, and Nvidia once again delivered revenue above expectations. How will these developments shape the next phase of investment strategy? Read this week’s WEFC analysis for our full take.
Key Focus of This Week’s Report
-
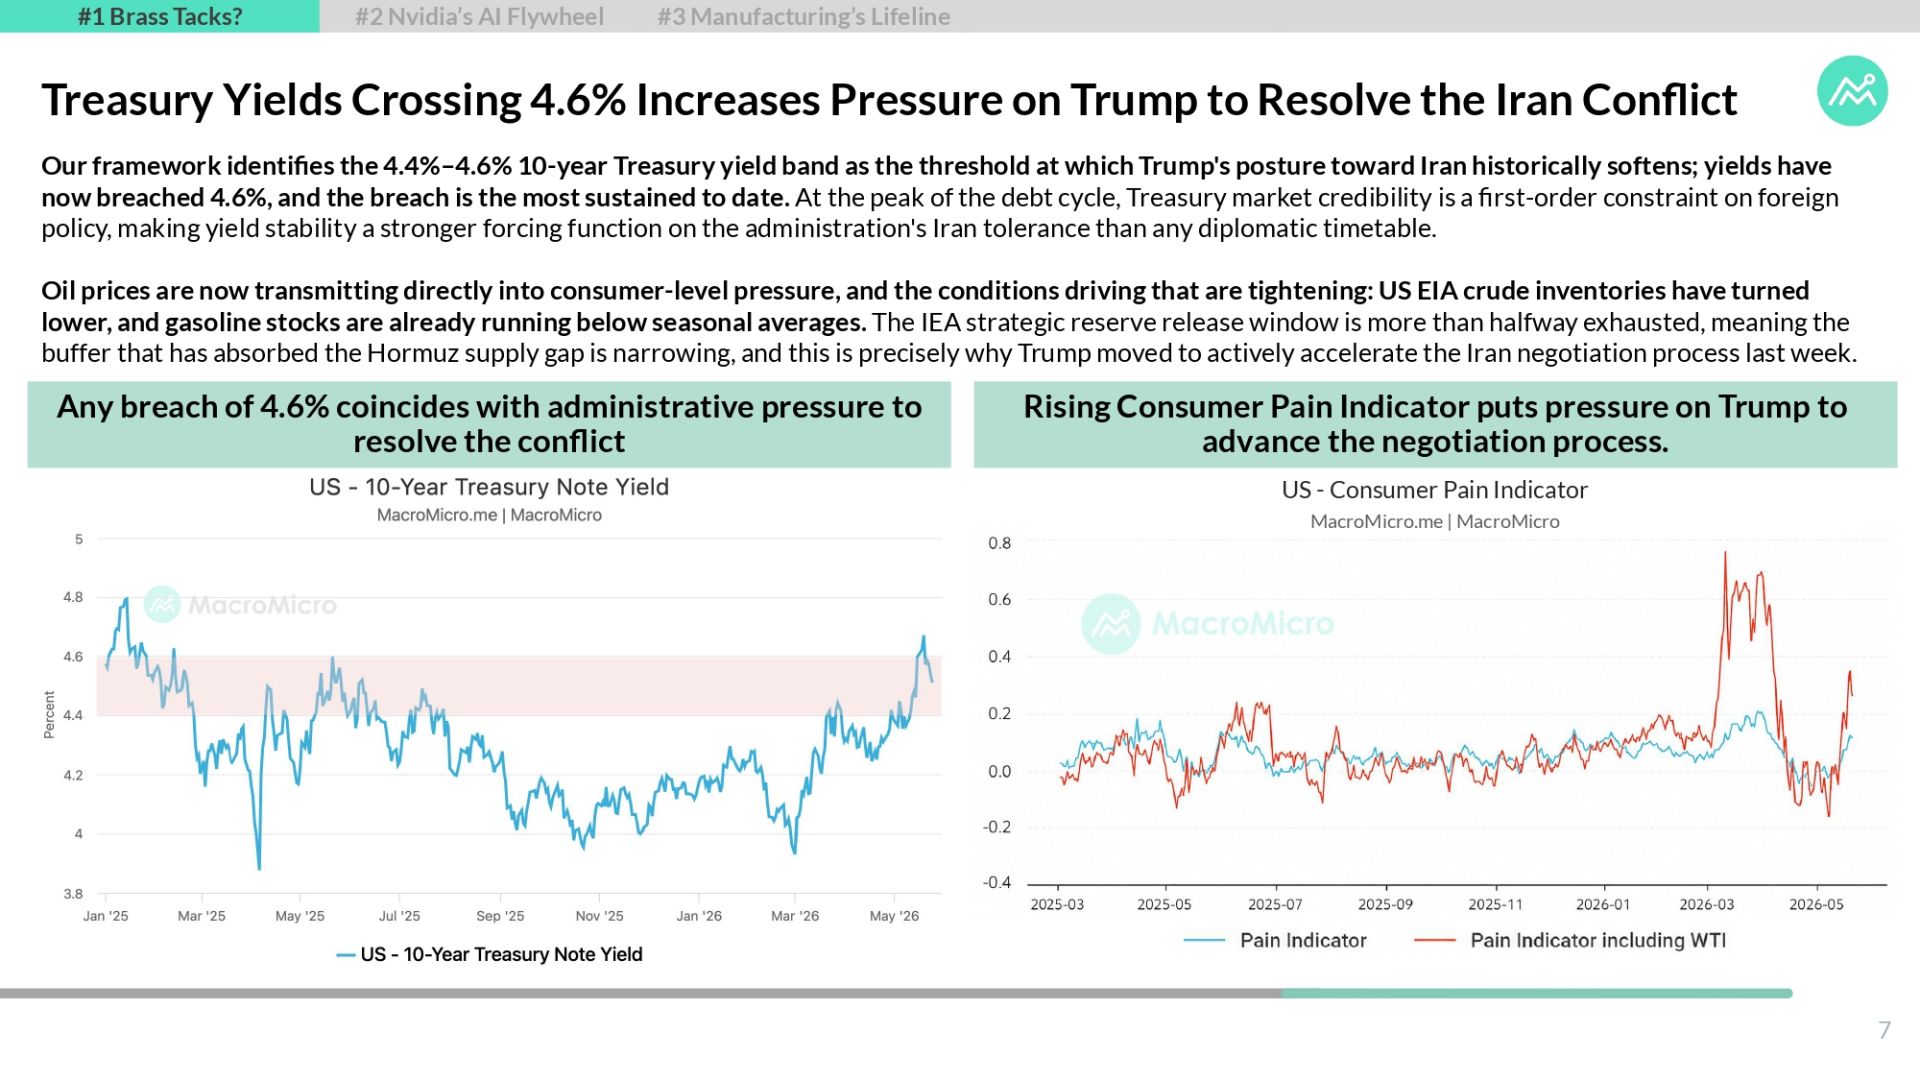
Oil’s Retreat Signals Markets Are Betting on a Forced Iran Resolution: Oil’s pullback below $100 is not merely a relief rally; it signals markets are increasingly pricing a forced diplomatic exit. With Treasury yields breaching the 4.6% pressure zone and gasoline costs becoming a consumer-level problem, Washington’s room for escalation is narrowing.
-
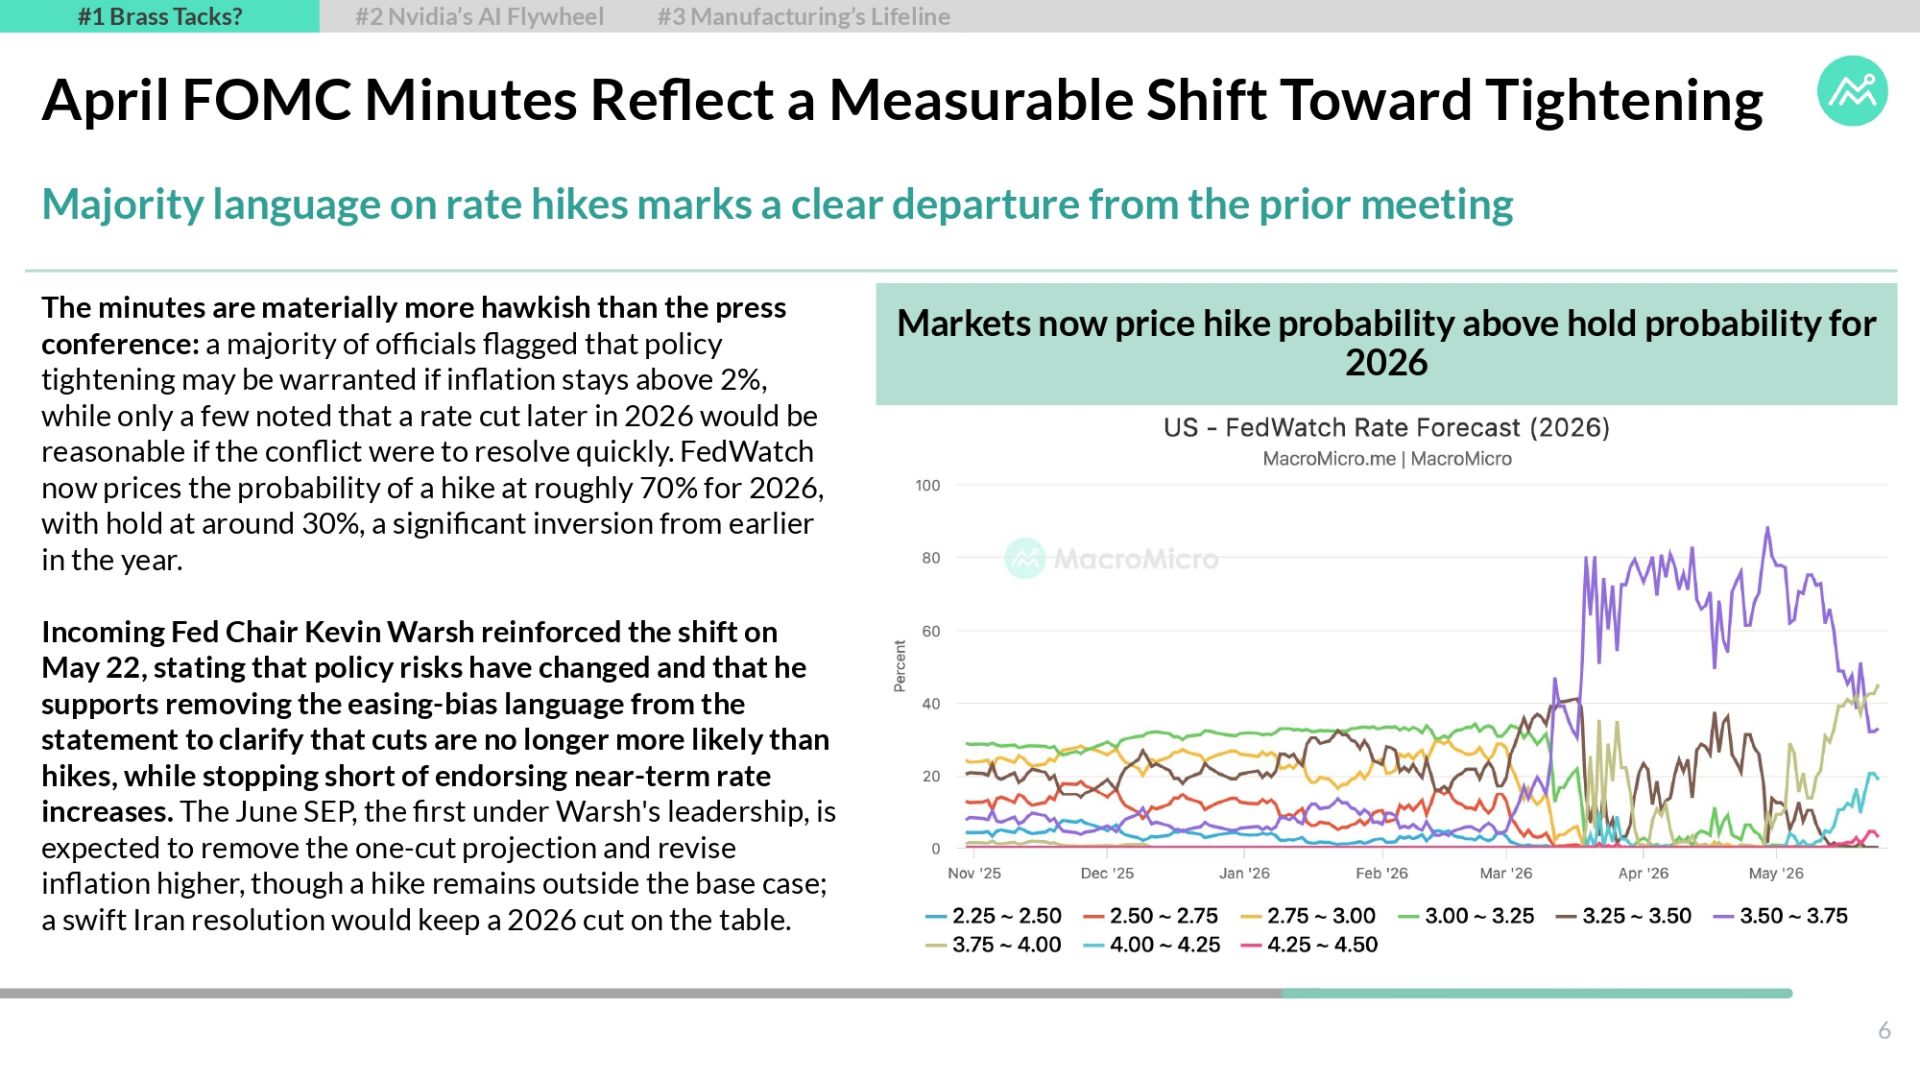
A Hawkish Dot Plot and RMP Pause Could Redefine the Fed’s Policy Path: The June FOMC may mark a turning point if the dot plot shifts from one cut to no cuts, especially with only three officials needed to change the median. Warsh’s first meeting would also put RMPs under scrutiny, as Fed bill purchases have already slowed sharply, raising the odds of a pause or cancellation.
-
Nvidia and Taiwan Confirm AI Demand Is Broadening Beyond Chips: Nvidia’s Blackwell ramp, stronger guidance, and resilient margins confirm that AI demand remains supply-constrained rather than speculative. Taiwan’s export orders add an important cross-check: ICT, electronics, and machinery strength suggest hyperscaler capex is already flowing through the broader semiconductor supply chain.
-
AI Demand Is Extending the Manufacturing Cycle Beyond Normal Inventory Patterns: The manufacturing cycle is not immune to reversal, but AI demand has delayed the usual destocking phase. Semiconductor sales, Taiwan exports, memory, cooling, substrates, and networking all point to system-level demand, making this cycle broader and more durable than a single GPU-led boom.

About Weekly Economic and Financial Commentary (WEFC)
The MacroMicro WEFC is published weekly, delivering rigorous analysis and in-depth insights on the most critical market-moving events. Coverage spans equities, foreign exchange, bonds, commodities, global central banks, geopolitics, and the international political economy.
At its core is a concise, roughly 20-page Chart Pack designed to help you grasp market trends at a glance. Subscribe Now » to download the full PDF report.
Already a subscriber? Click here to log in.
Full Access to Our Services

Comprehensive data at your service
with key indicators for investment insights

Exclusive flash reports
on key events and data

Create your own charts and analysis
including performance backtesting

Hub of professionals to engage
in meaningful discussions and insights
 Get answers from MM AI.
-
Why did oil prices fall below $100, and what does it signal for global markets?
💡Oil prices fell below $100 due to signs of progress in US-Iran negotiations, signaling that markets are increasingly pricing in a forced diplomatic resolution. This retreat is not merely a relief rally but indicates a market bet on a diplomatic exit, which has helped global equities stabilize and rebound, with several major markets reaching new highs. The decline also reflects narrowing room for escalation by Washington, given that Treasury yields have breached the 4.6% pressure zone and gasoline costs are becoming a significant consumer-level problem.
-
How might a hawkish June FOMC dot plot change the Federal Reserve's policy path?
💡A hawkish June FOMC dot plot could redefine the Federal Reserve's policy path by shifting the median expectation from one interest rate cut to no cuts, requiring only three officials to change this median. Such a shift would indicate a more restrictive monetary policy stance, potentially signaling a prolonged period of higher rates than previously anticipated. This development would challenge market expectations for rate cuts and could lead to increased volatility across financial markets as investors adjust to a more hawkish Fed outlook.
-
How do Nvidia's strong earnings and guidance reflect current AI demand?
💡Nvidia's strong earnings and guidance, including the Blackwell ramp and resilient margins, confirm that current AI demand remains supply-constrained rather than speculative, underscoring robust underlying growth. The company's performance indicates that the demand for AI hardware is substantial and sustainable, driven by genuine need rather than speculative investment. This suggests a healthy and expanding market for AI technologies, where supply struggles to keep pace with an accelerating demand, validating the long-term investment thesis in AI infrastructure.
-
What do Taiwan's export orders indicate about the broader AI supply chain demand?
💡Taiwan's export orders indicate that AI demand is broadening beyond just chips and flowing through the wider semiconductor supply chain. Strong growth in ICT, electronics, and machinery exports suggests that hyperscaler capital expenditure is already impacting various downstream and upstream segments. This provides an important cross-check to Nvidia's performance, confirming that the demand for AI is driving system-level growth, extending to components like memory, cooling, substrates, and networking, thereby supporting a more durable manufacturing cycle.

