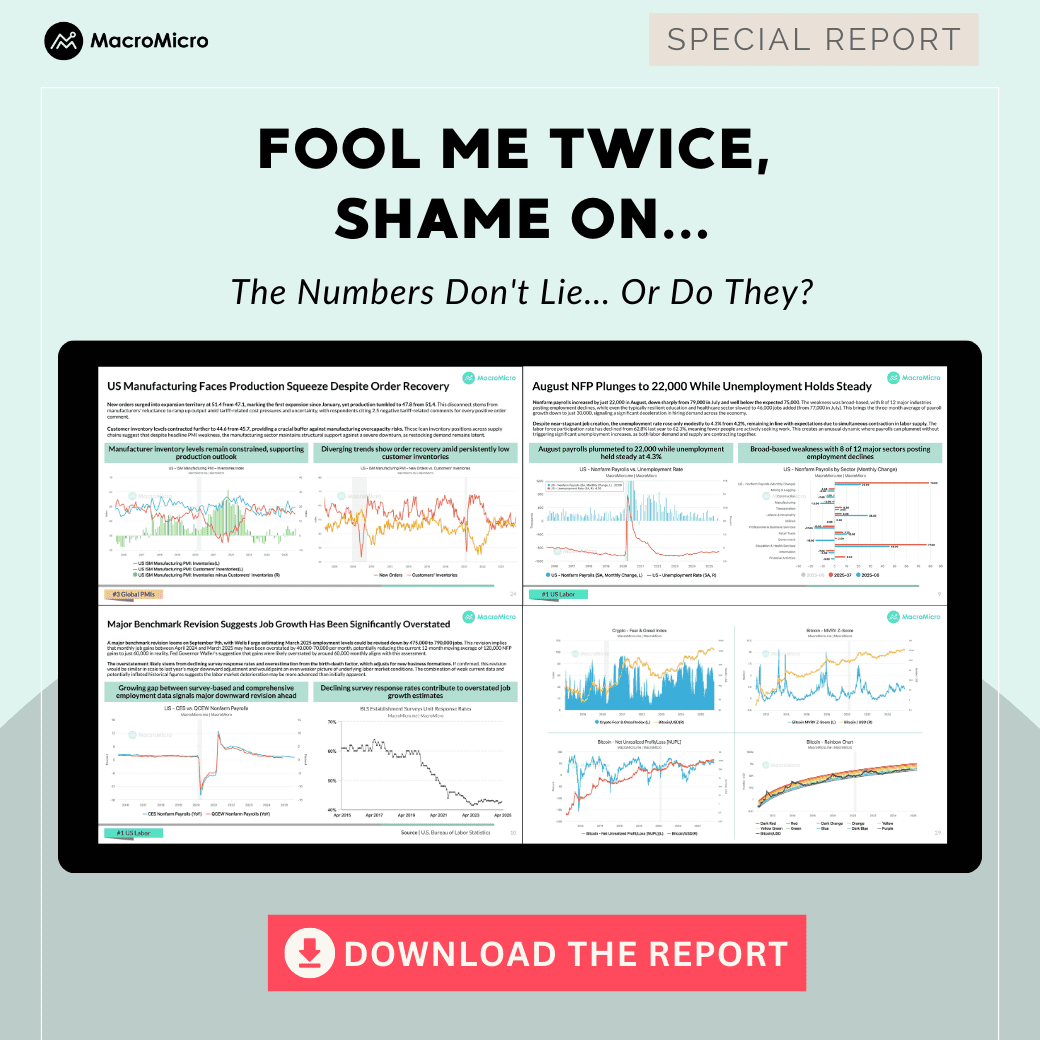
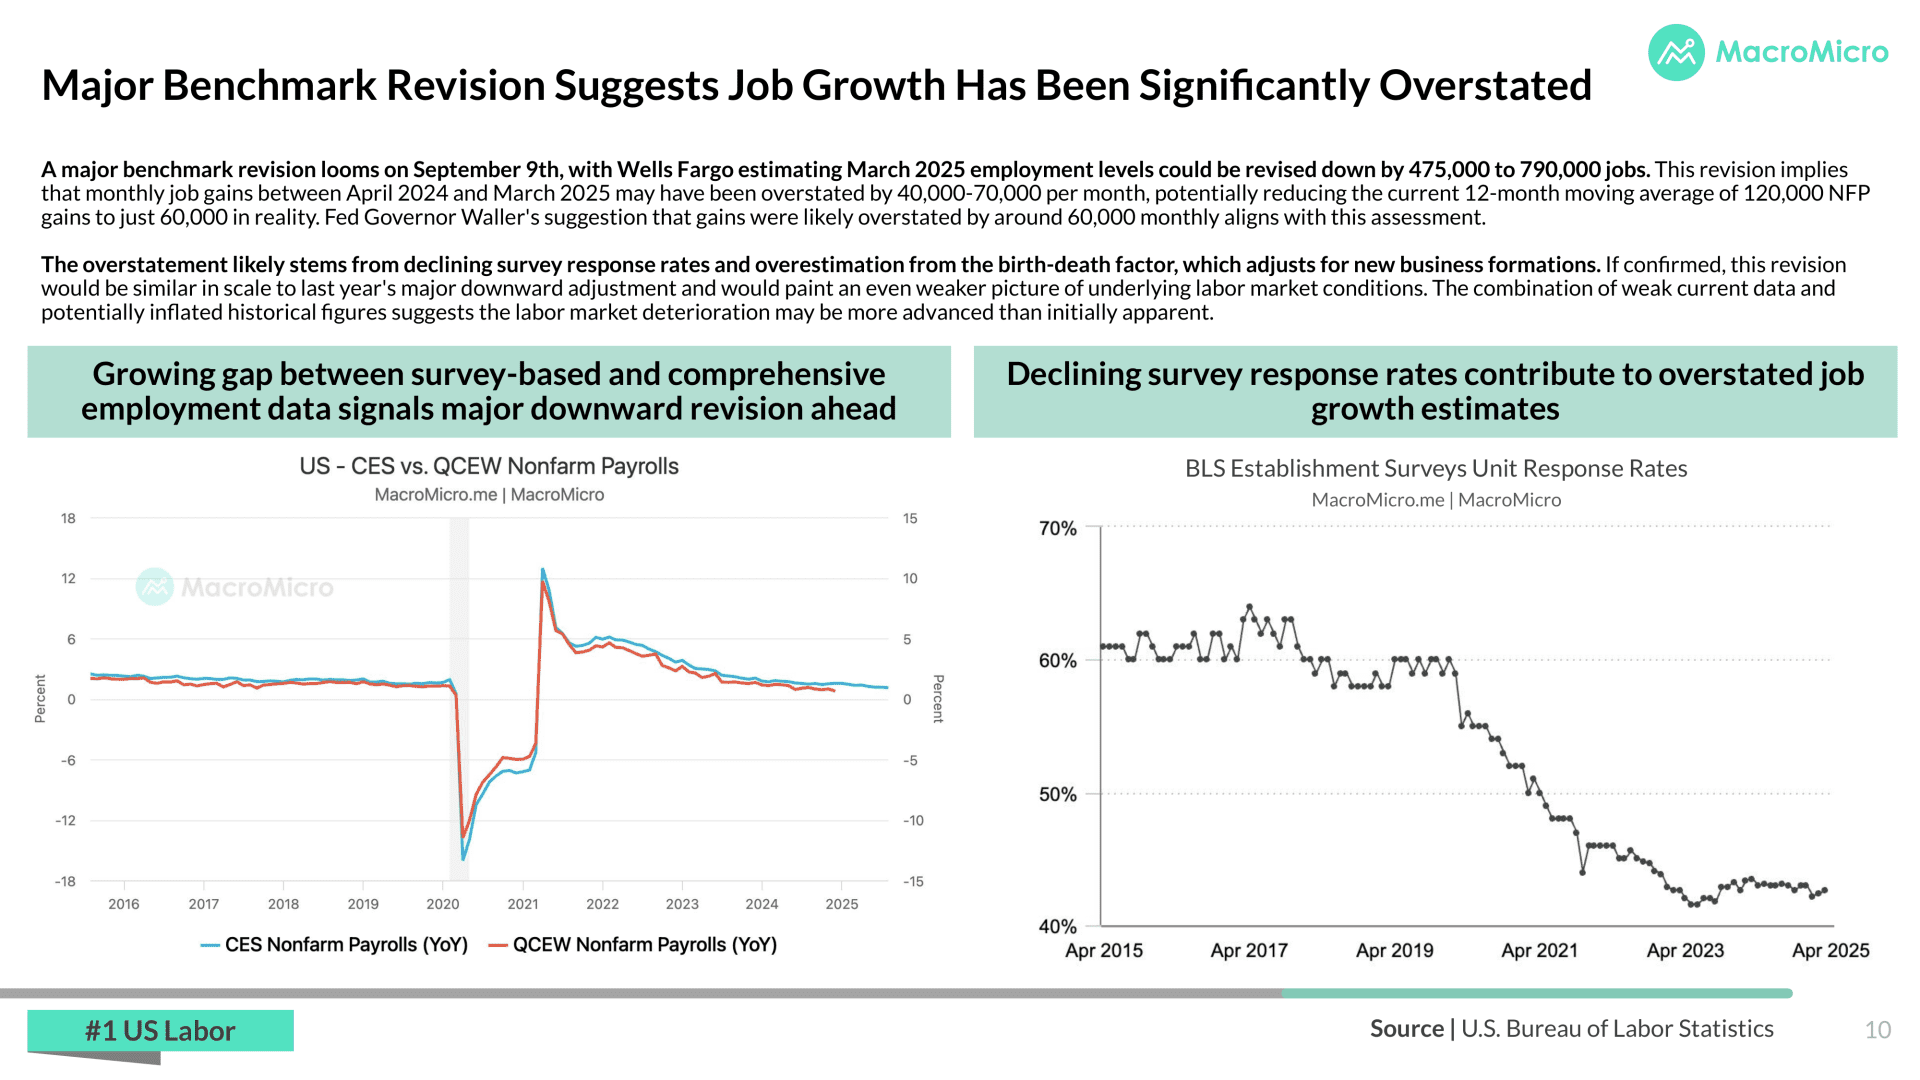
Is the non-farm payroll report misleading us again? August's job growth came in at a surprisingly low 22,000, falling well short of expectations. What's more, the report's numbers continue to be revised downward. The revised June non-farm payroll figure was actually a negative 13,000—the first negative reading since 2020. This week brings another major event: the non-farm payroll benchmark revision, which could see a downward adjustment of nearly 80,000.
Meanwhile, global government bond yields are on the rise, with 30-year bond yields in several countries hitting new highs. We delve into these topics and more in this week's report, offering our analysis and insights.
1. U.S. Job Growth Nearly Stalls, Forcing Fed Toward September Cuts
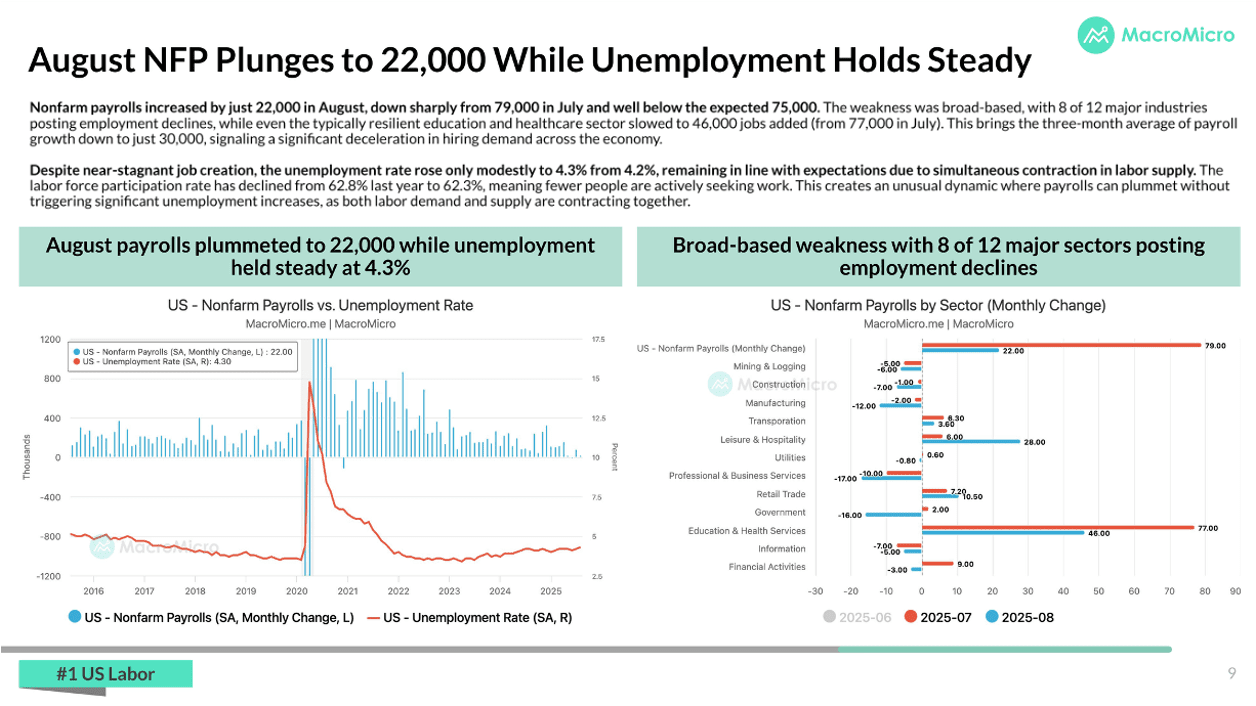
August’s payrolls rose by only 22,000 and far below expectations. Eight of twelve industries cut jobs, and even education and healthcare slowed sharply. The three-month average dropped to just 30,000, underscoring how quickly hiring demand has cooled. Unemployment ticked up to 4.3%, but falling labor force participation kept the rate from rising more sharply, showing both demand and supply are shrinking together. Upcoming benchmark revisions may erase as many as 790,000 past job gains, suggesting the labor market is even weaker than current data shows. With markets now pricing a 90% chance of a September cut, the Fed looks set to act aggressively to counter deteriorating employment conditions.
2. Global Manufacturing Weak but Stabilizing on Policy Support and Tech Demand
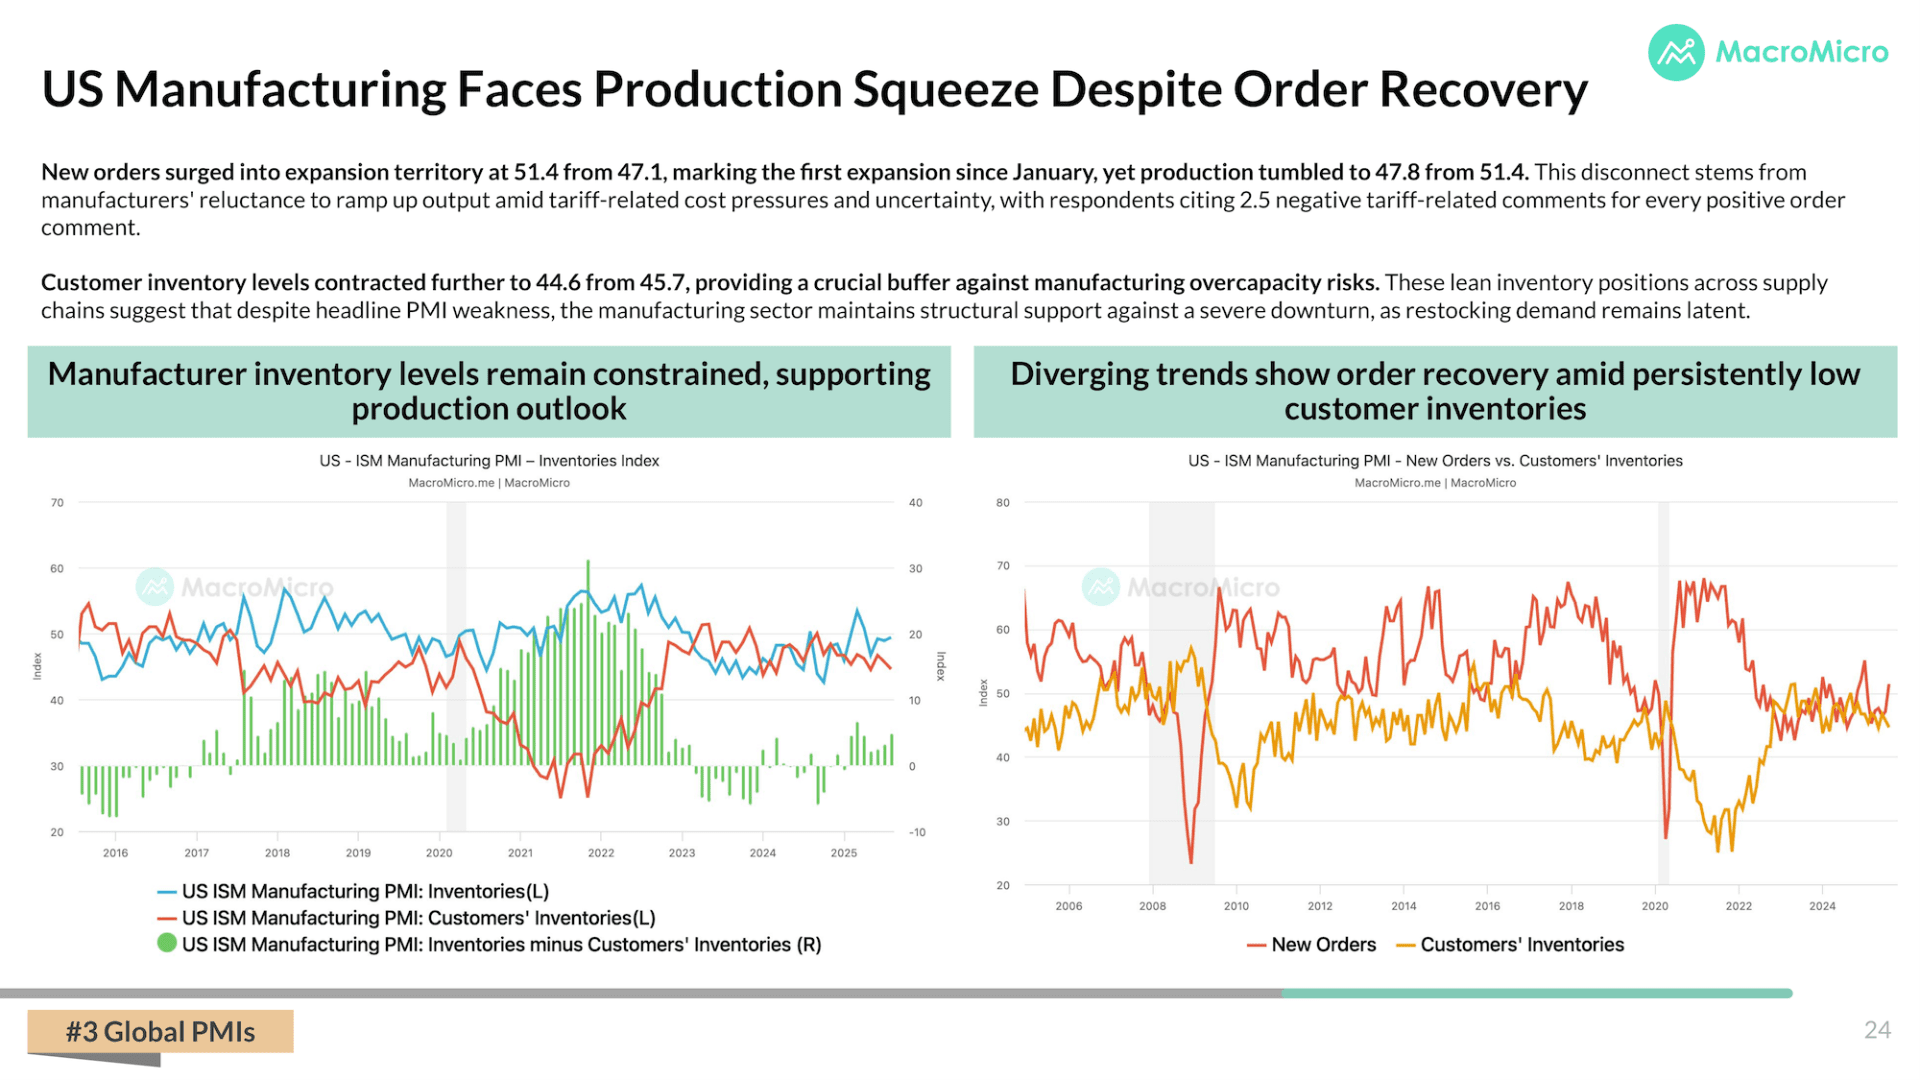
Global manufacturing remains under strain, but key differences are emerging by region. The U.S. PMI improved slightly to 48.7, with new orders rebounding above 50, yet production fell, highlighting cost pressures and tariff uncertainty. Lean inventories remain a stabilizing factor, limiting overcapacity risks. In China, the official PMI edged up to 49.4 and the Caixin index returned to expansion, supported by policy easing, tariff pauses, and strong high-tech output. Taiwan’s PMI slipped to 47.9, with traditional industries hit hard by tariffs, though semiconductor exports surged 87% year-on-year, reflecting resilience from AI demand. The MM Manufacturing Cycle Index weakened to –0.27, but dovish global monetary policy and low inventories suggest the cycle may be bottoming out, with selective strength in advanced sectors preventing a broader collapse.
3. Bond Market in Turmoil: Why Long-Term Yields Are Soaring
Bond markets have faced a sharp sell-off, sending long-term yields to multi-year highs despite central banks maintaining dovish stances. U.S. 30-year Treasuries approached 5%, U.K. gilts surged to 5.7%—their highest since 1998—and German bunds climbed to 3.4%. The key driver is ballooning debt issuance, with global debt surpassing $324 trillion. At the same time, core inflation remains sticky, particularly in the services sector where wage growth persists. Investors are demanding higher inflation risk premiums, while political interference—including threats to Fed independence—has undermined credibility and contributed to widening term spreads. Meanwhile, rising fiscal expenditures in Europe and Japan, coupled with political instability, have further fueled long-term bond yields.
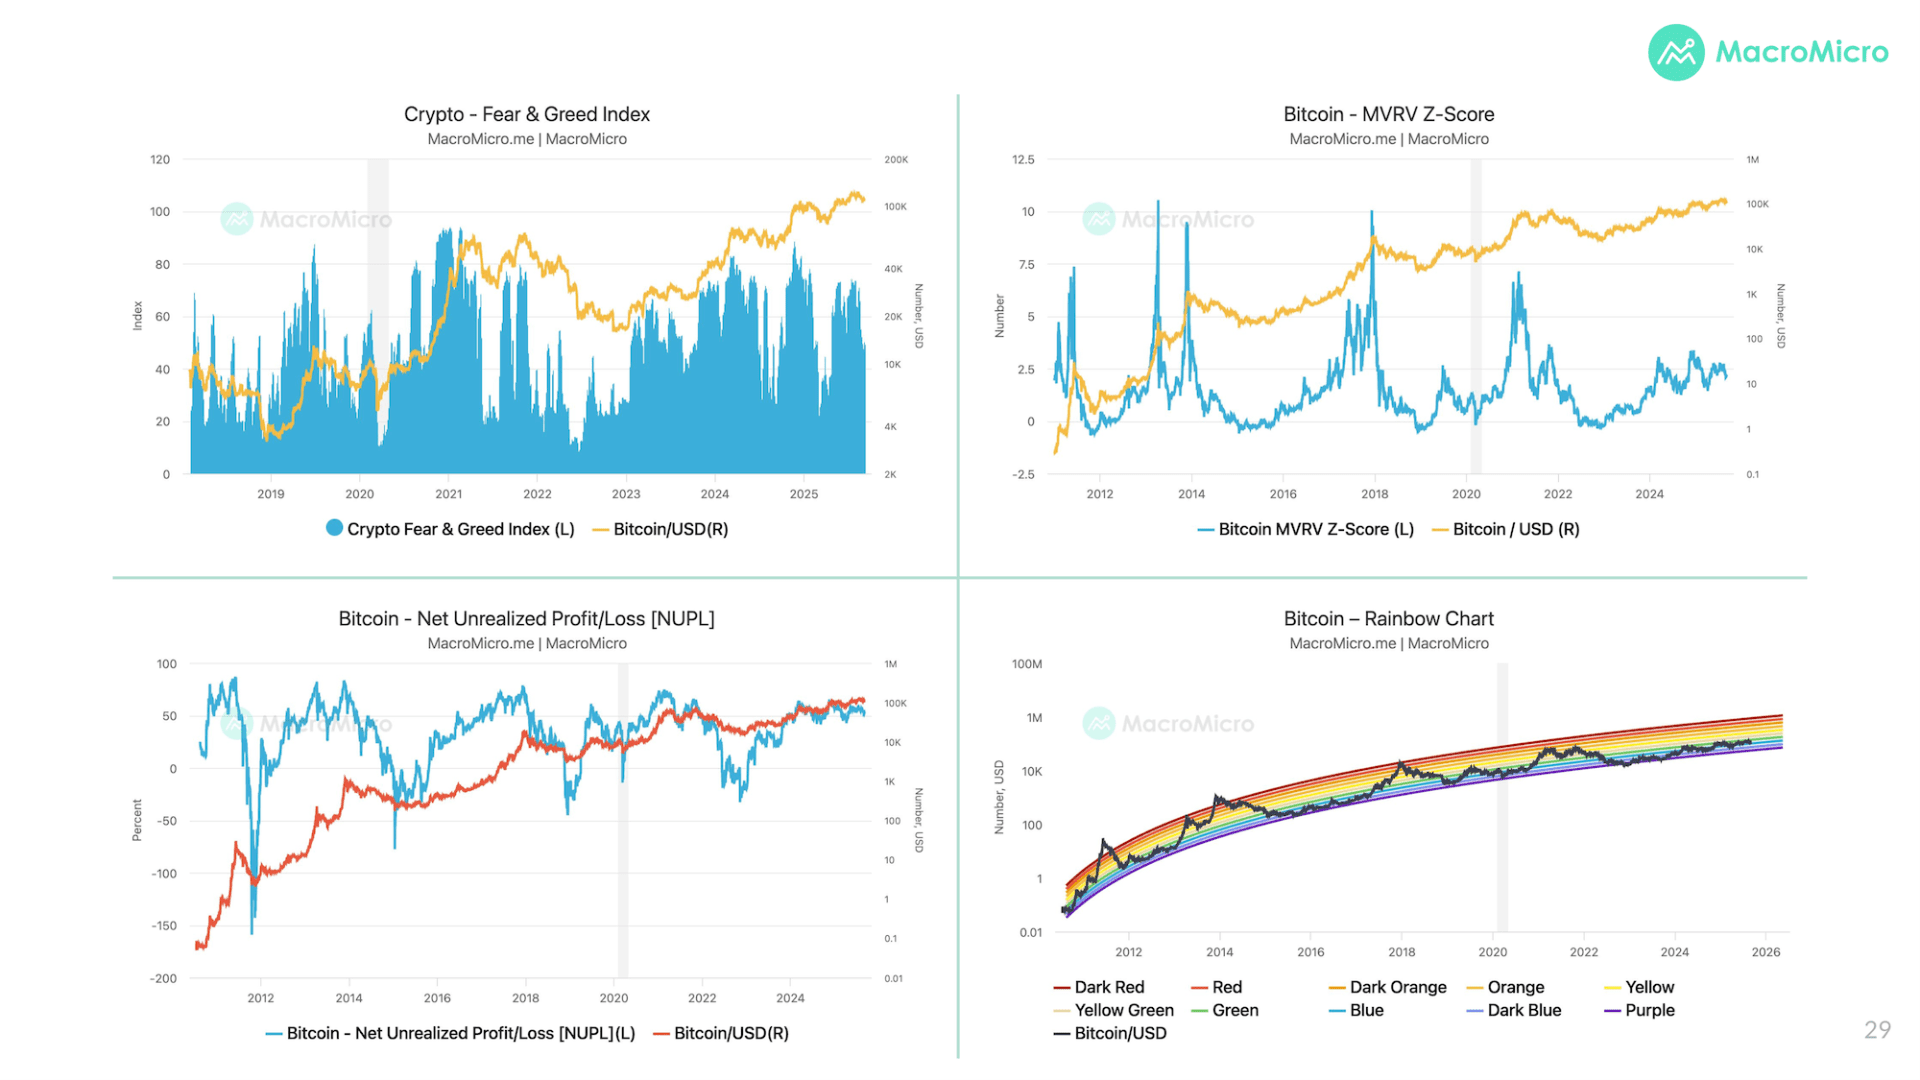
4. 5 Charts to Monitor Bitcoin
Bitcoin and broader crypto markets have shifted into a consolidation phase after months of overheating. The share of top tokens above their 200-day moving average fell from 77% in August to 50%, a level that historically reflects neutrality rather than excess. Readings above 70–80% often warn of vulnerability, while 20–30% mark capitulation points before rebounds. The current midpoint shows investors pausing to reassess risk-reward dynamics. Complementary tools reinforce this picture: the Crypto Fear & Greed Index highlights sentiment cooling, Bitcoin’s MVRV Z-Score shows valuations closer to fair value, and NUPL suggests balanced holder behavior. The Bitcoin Rainbow Chart also signals long-term stability rather than speculative extremes. Together, these indicators point to consolidation as a healthy reset, allowing the market to build a stronger base for future moves rather than signaling collapse.
Already a subscriber? Click here to log in.
Full Access to Our Services

Comprehensive data at your service
with key indicators for investment insights

Exclusive flash reports
on key events and data

Create your own charts and analysis
including performance backtesting

Hub of professionals to engage
in meaningful discussions and insights
