Global markets continue to rise as August 1 approaches, widely referred to as “Liberation Day 2.0.” The US has secured new tariff agreements with major economies including the EU and Japan, while trade negotiations with China are now underway in Sweden. On the surface, momentum appears positive.
However, one critical question remains: have markets fully accounted for the lasting impact of elevated tariffs? Even after recent deals, the post–August 1 tariff structure will remain among the highest in decades—a reality that may not yet be fully reflected in asset prices.
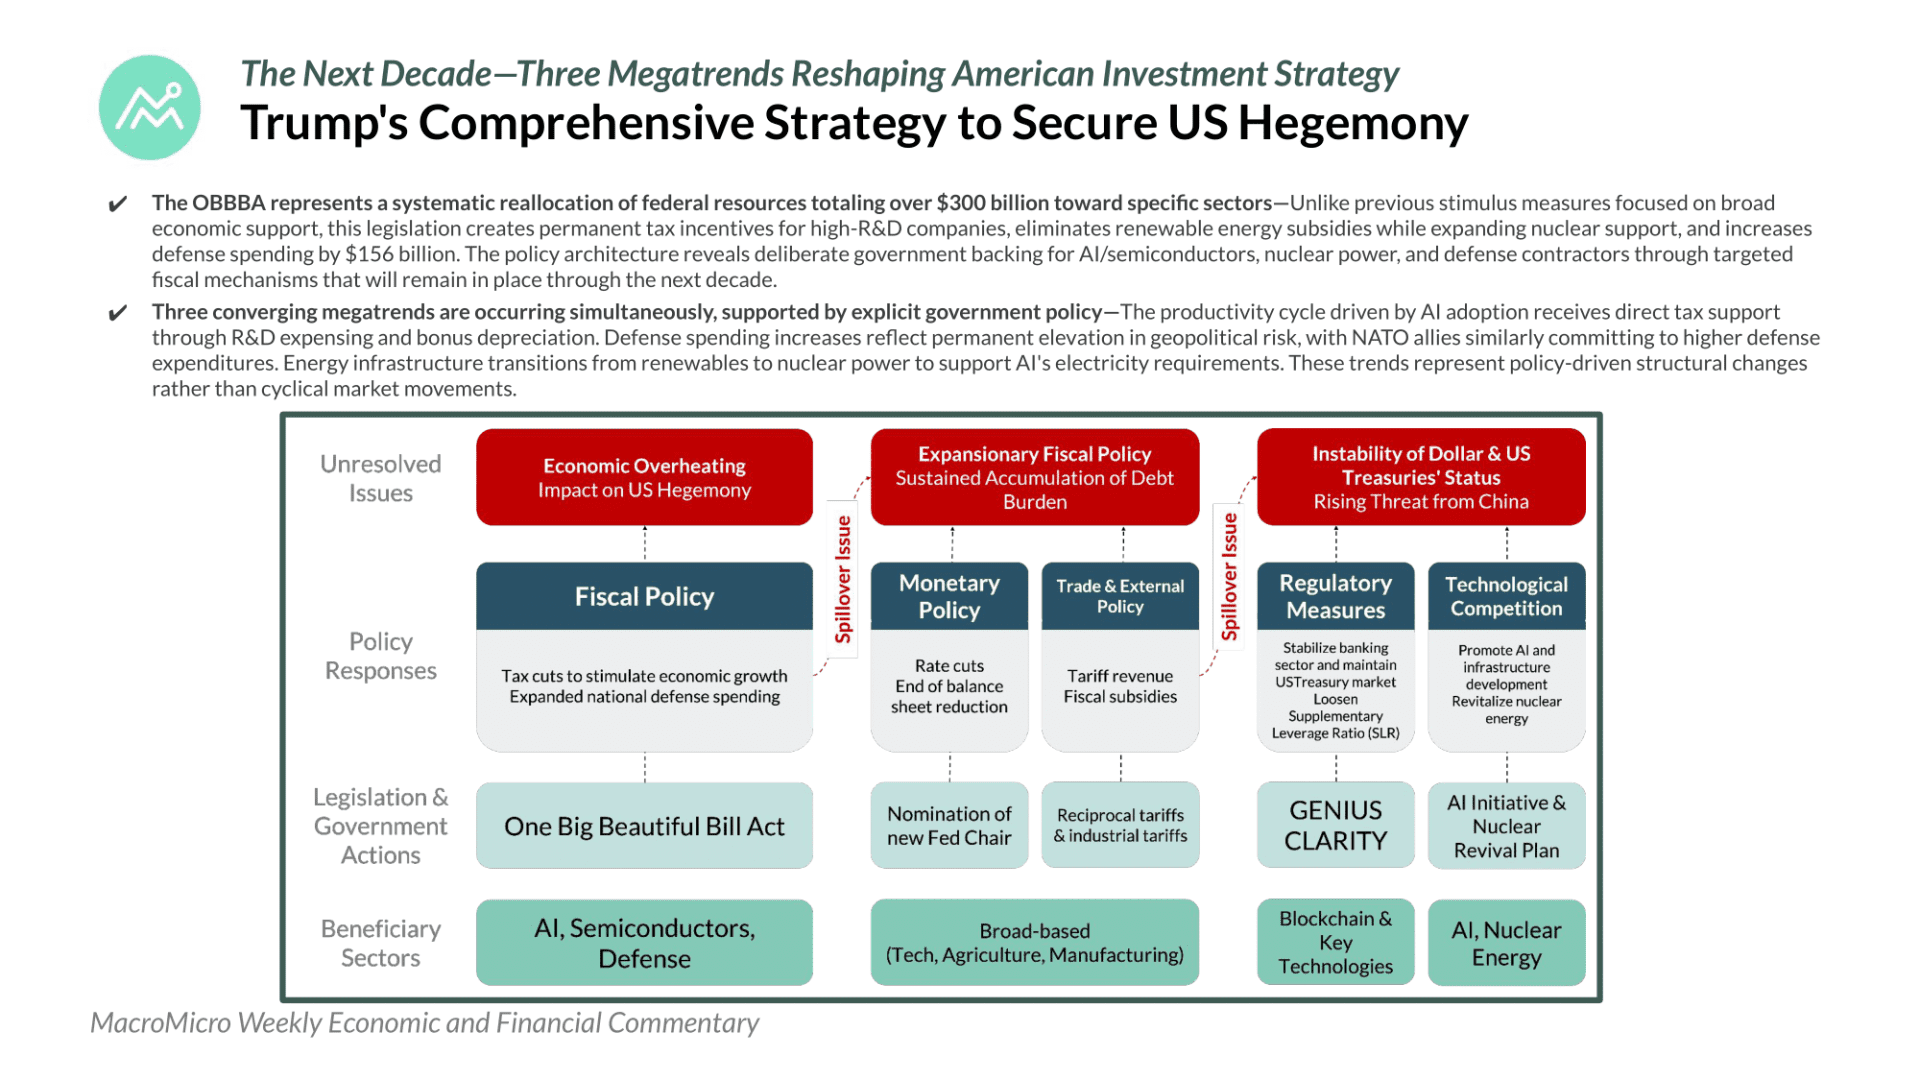
Beyond the trade narrative, several long-term investment themes are quietly emerging—many embedded within the broader direction of Trump’s economic policy. In this week’s WEFC, we take a closer look at the deeper implications shaping global markets beneath the surface.
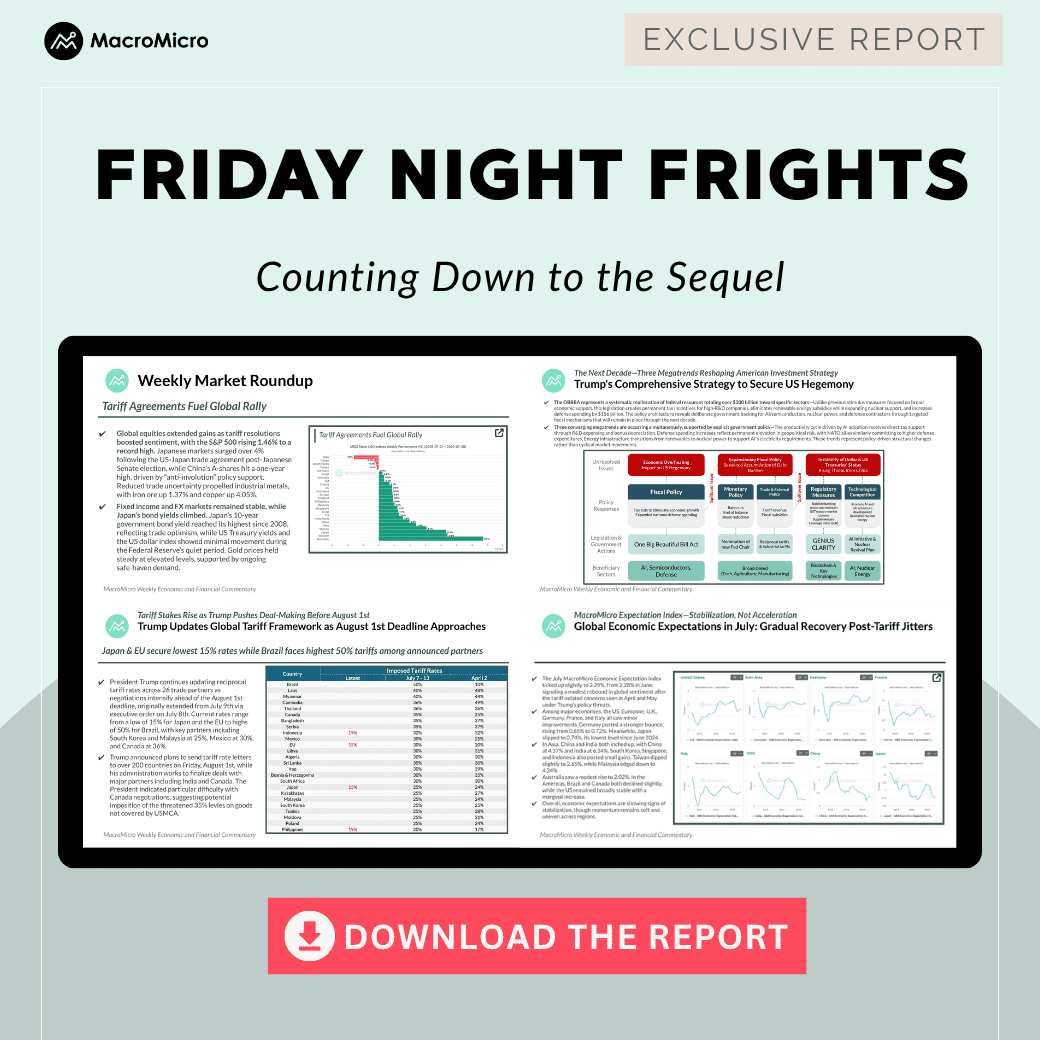
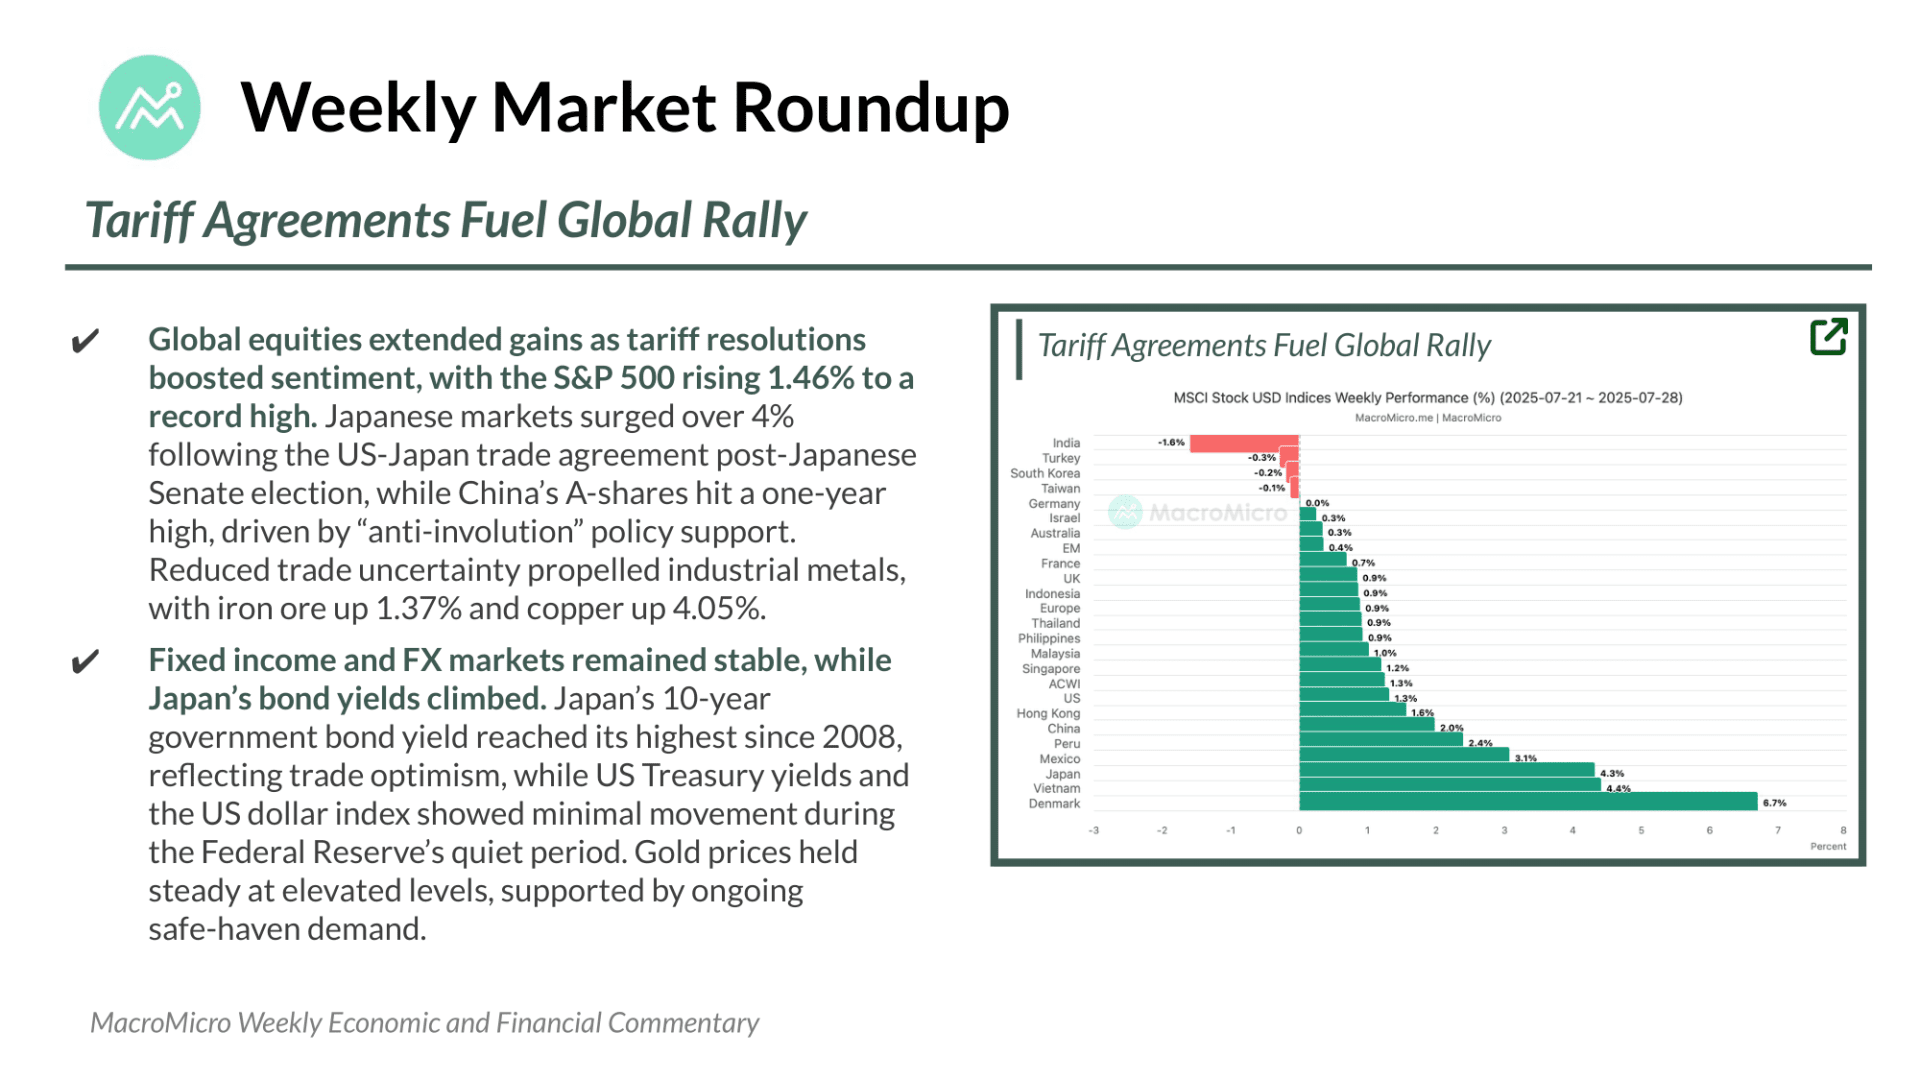
1. Global Markets Surge Ahead of ‘Liberation Day 2.0’
Global markets rallied strongly ahead of August 1—nicknamed “Liberation Day 2.0” by investors—as Trump’s revised tariff framework takes effect. The S&P 500 hit a record high, rising 1.46%, while Japan’s Nikkei surged more than 4% following a post-election trade breakthrough with the US. In China, targeted stimulus lifted A-shares to a one-year peak. Industrial metals like copper and iron ore also climbed, signaling renewed confidence in post-tariff global growth. While bond and FX markets held steady, Japan’s 10-year yield reached its highest level since 2008. Gold prices remained strong on safe-haven demand. Markets are increasingly betting that restructured trade deals and clearer policy direction will reduce disruption and unlock new growth momentum.
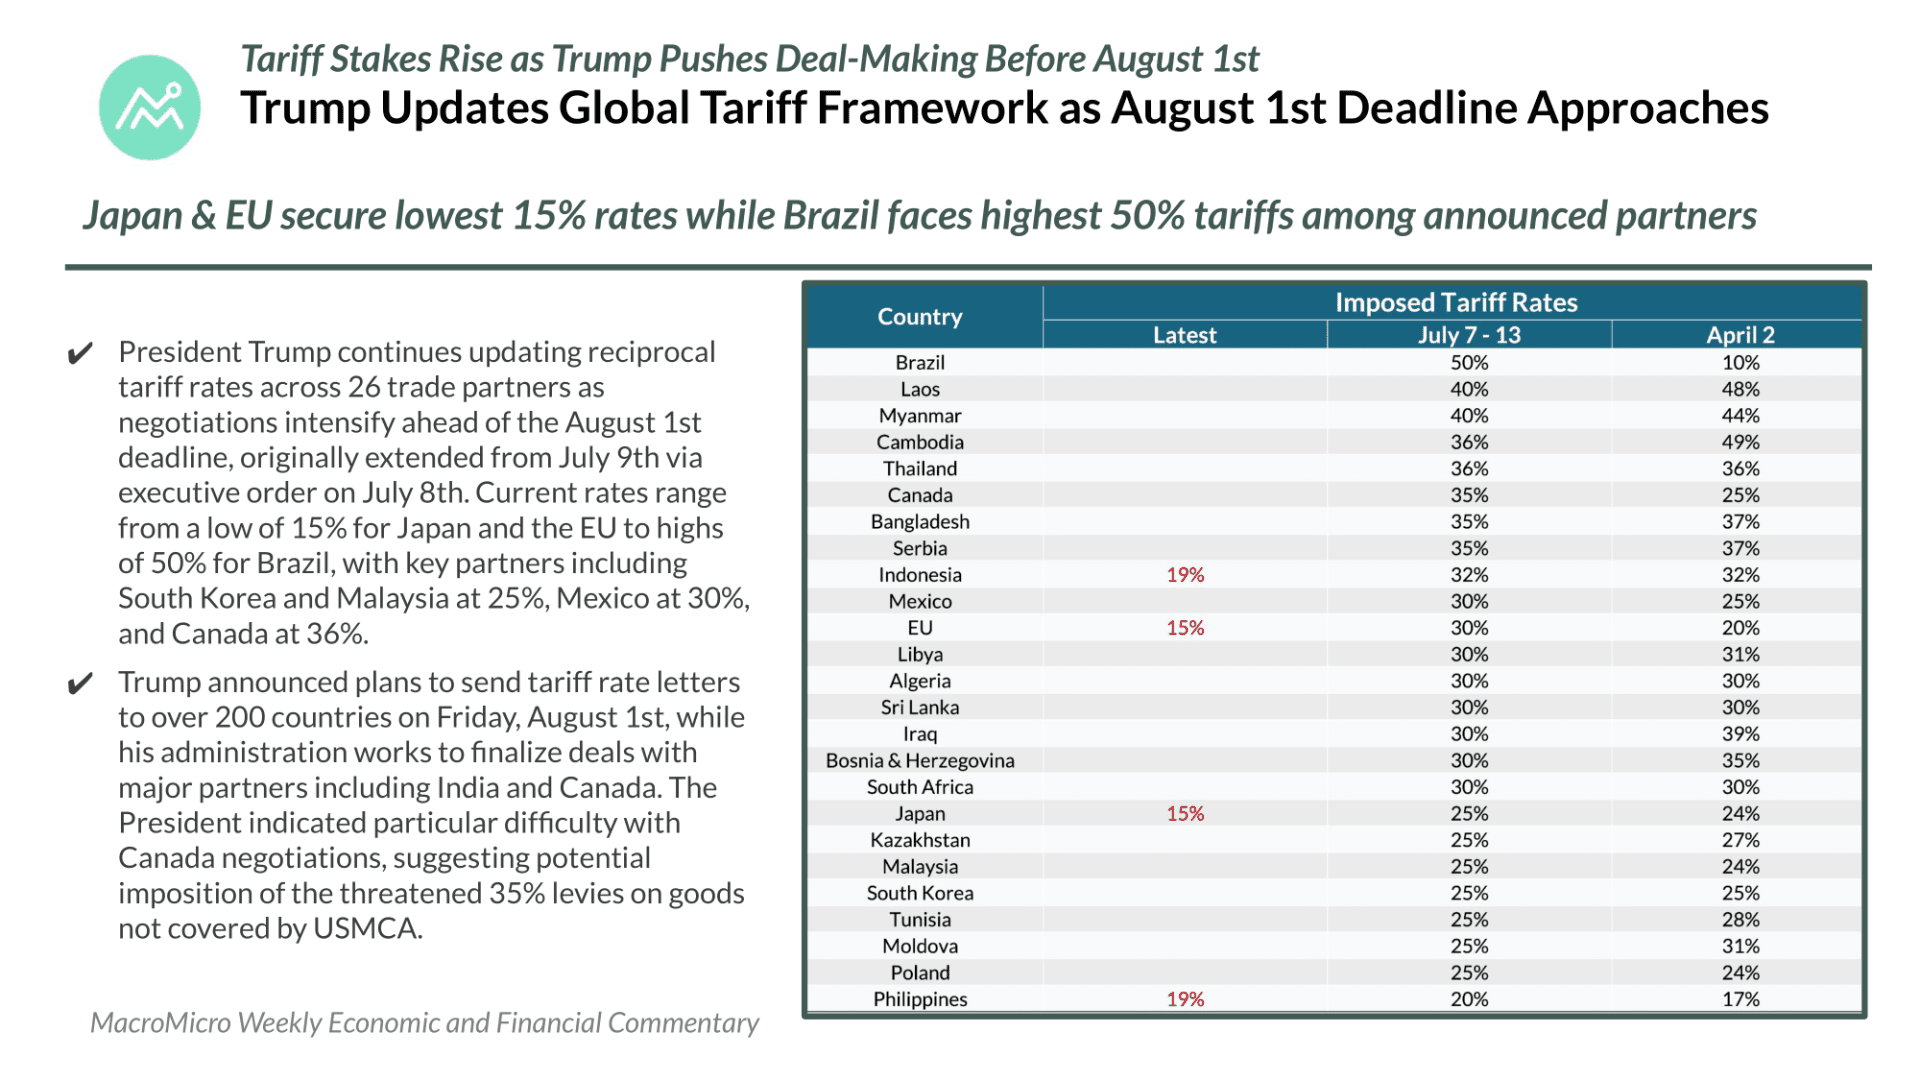
2. US–EU Tariff Deal Sets the Tone for Global Trade Reset
On July 27, the US and EU struck a major trade agreement, cutting tariffs from 30% to 15%. The EU also pledged to purchase $750 billion in US energy and invest another $600 billion. Including this deal, 26 countries have now updated their tariff terms with the US. Japan and the EU lead with the lowest rates at 15%, followed by the Philippines and Indonesia at 19%, and South Korea, Malaysia, Mexico, and others ranging between 25% and 36%. Brazil remains the highest at 50%. Negotiations with key partners are increasingly landing in the 10–20% range, reflecting a broader shift toward de-escalation. Talks with China continue in Switzerland, marking a potential turning point for global trade realignment.
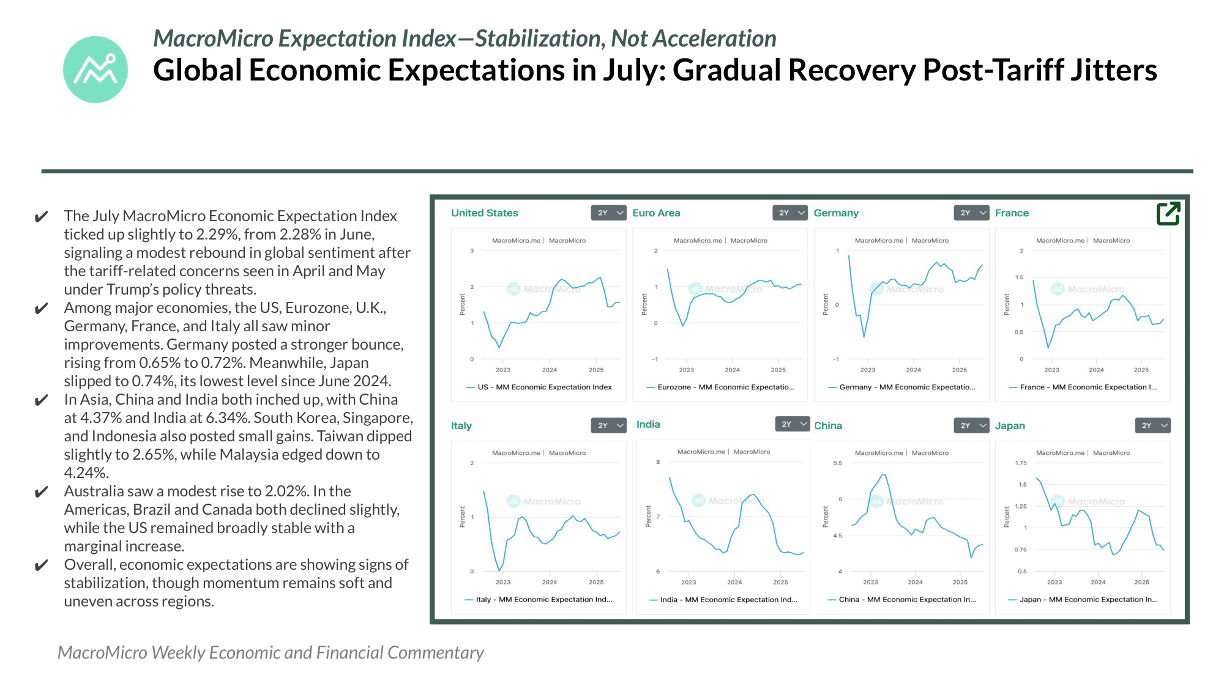
3. Global Economic Outlook Shows Signs of Stabilizing
July saw a mild rebound in global sentiment as trade uncertainty began to ease. MacroMicro’s global expectation index edged up to 2.29%, from 2.28% in June. The US, Eurozone, and Germany saw slight improvements, while Japan fell to a one-year low. China and India posted moderate gains, continuing to lead Asia. Taiwan and Malaysia declined slightly, while Australia ticked up. In the Americas, the US held steady, Brazil and Canada slipped. Overall, the data suggests sentiment is firming, but growth expectations remain uneven across regions, still cautious after months of policy turbulence.
4. Super Week: GDP, Fed, Big Tech, PMI and Liberation Day 2.0 in Focus
Markets are gearing up for a pivotal week. US Q2 GDP, due July 30, is expected to show 2.5% annualized growth, rebounding from Q1’s contraction. The Fed is expected to hold rates steady, but investors will closely watch inflation and labor data for early rate cut signals. June PCE is projected at 2.5%, with unemployment creeping up to 4.2%. In Japan, rising living costs may lead to upward inflation revisions and a more hawkish tone. China and US PMIs will offer a fresh look at manufacturing sentiment, with easing tariff pressure likely to support a rebound. Meanwhile, Big Tech earnings from Meta, Microsoft, Apple, and Amazon will be key in gauging corporate outlooks post-Liberation Day 2.0, especially in terms of capex plans and supply chain normalization.
Already a subscriber? Click here to log in.
Full Access to Our Services

Comprehensive data at your service
with key indicators for investment insights

Exclusive flash reports
on key events and data

Create your own charts and analysis
including performance backtesting

Hub of professionals to engage
in meaningful discussions and insights
