The Gulf war has entered its 16th day, and the Strait of Hormuz — the jugular of global energy — is suffocating. With Iran's Revolutionary Guard threatening transit, 16 vessels have been attacked in two weeks, sending oil above $100. In a rare move, Trump called on allies to deploy naval escorts, only to be met with a collective shrug from the international community. The Enemy of My Enemy is Apparently Not My Friend.
Financial stocks remain under pressure as private credit anxieties linger — but is this the beginning of systemic stress, or an isolated blowup? And with Trump relaunching Section 301 investigations, markets are bracing for the possibility that the tariff wars are back.
We dig into all of it in this week's WEFC.
Track every US–Iran shockwave. Redeem your MM Max trial code to unlock the full report — limited time only.

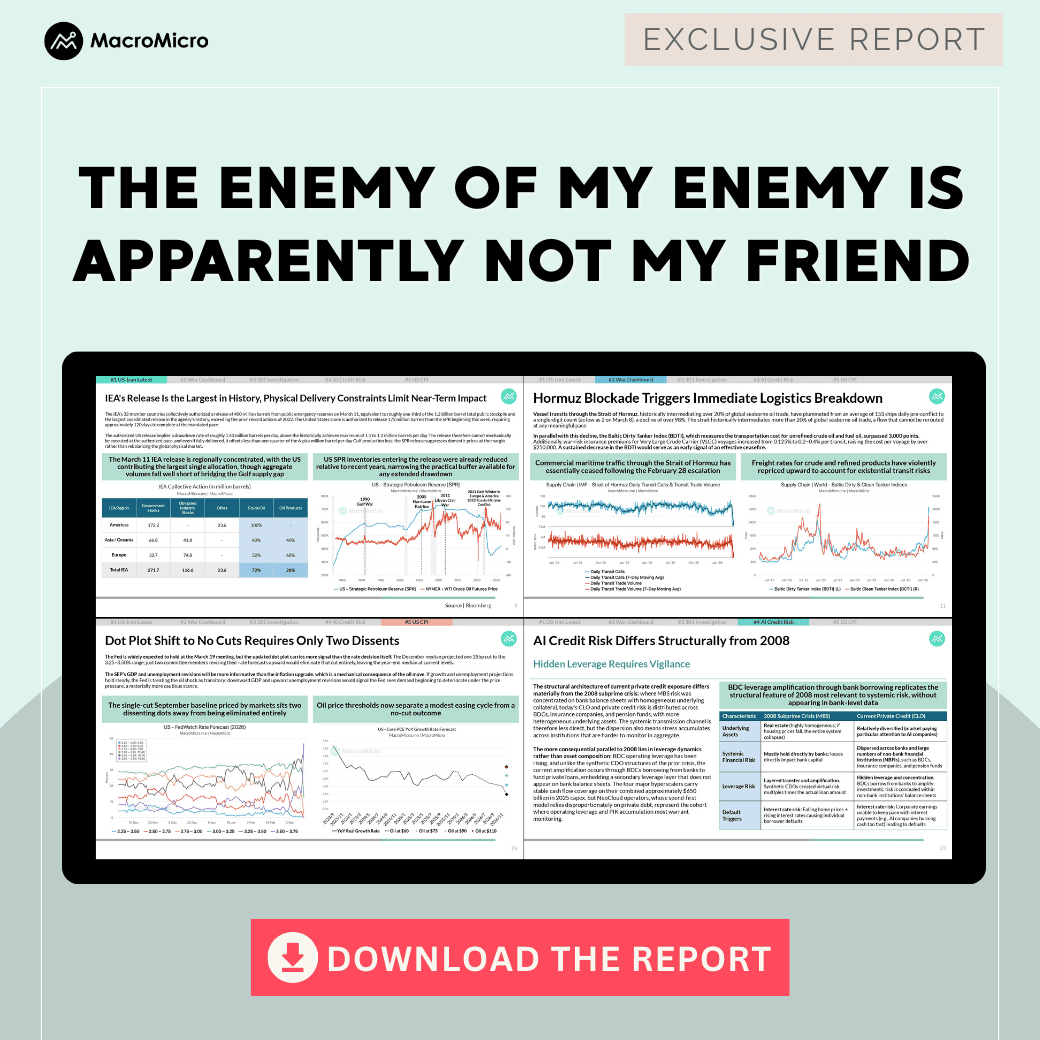
1. US-Iran War Update: 14-Indicator Dashboard Launched
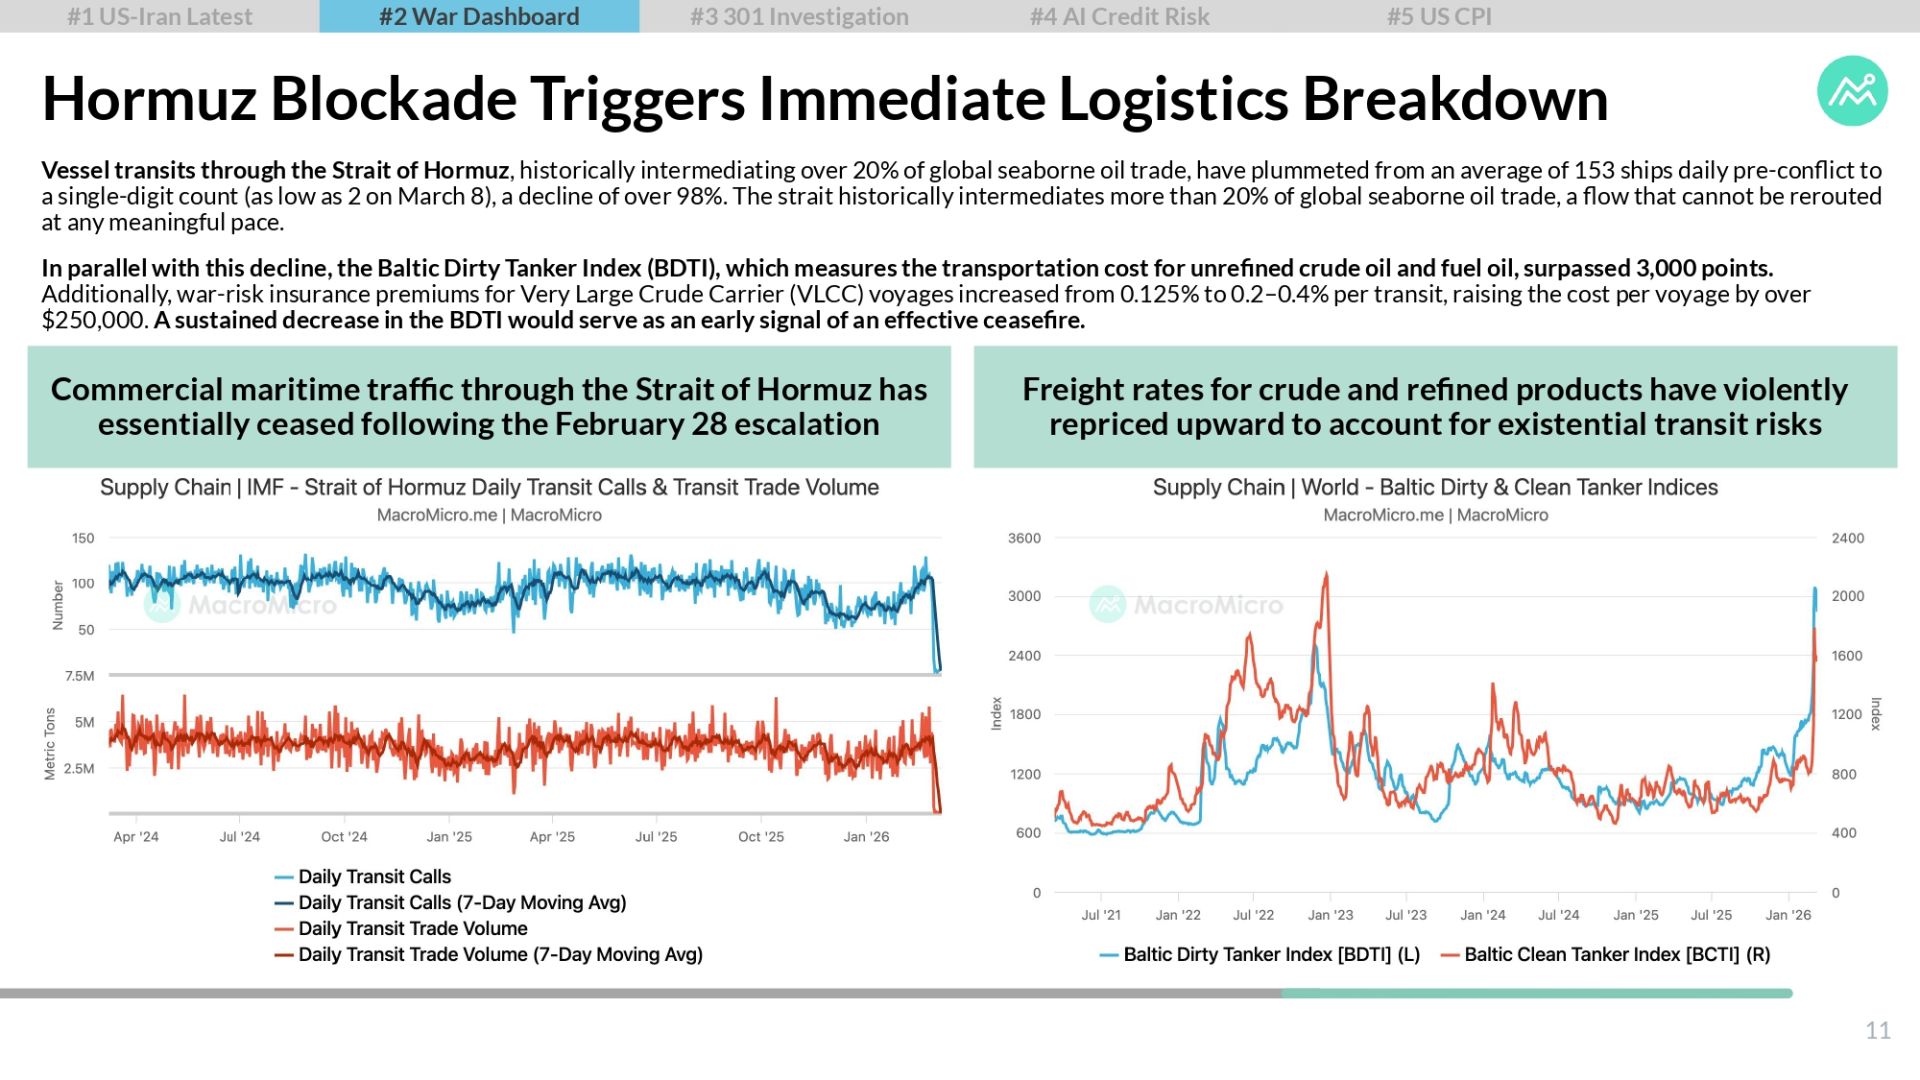
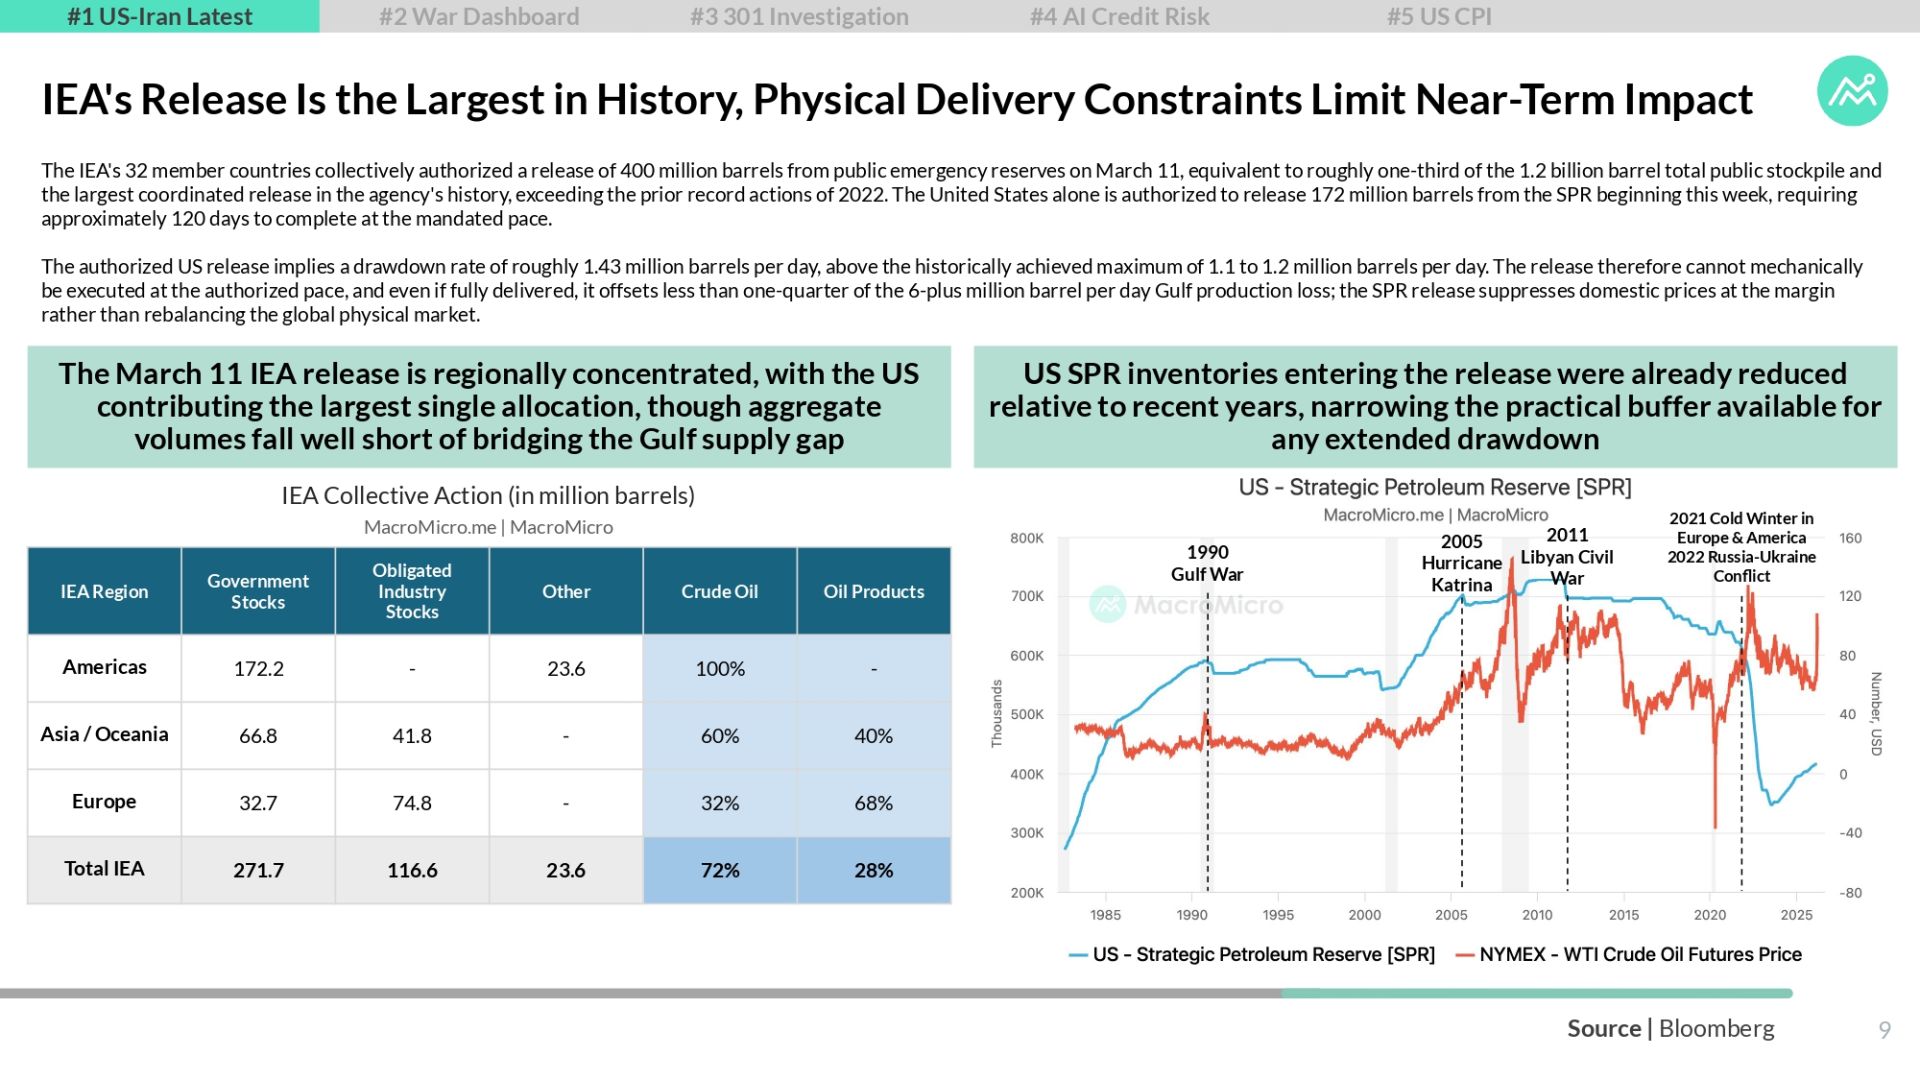
The US-Iran conflict has entered its second week with no de-escalation in sight. Hormuz vessel transits have collapsed 98% to single digits, with Gulf production losses exceeding 6 million barrels per day — approaching 1973/1979 crisis severity. The IEA authorized a record 400 million barrel emergency release, but this offsets less than one-quarter of the supply gap. Brent and WTI remain above $90, the OVX volatility index has breached 100, and freight rates have surged. Prediction markets assign 70% probability to a ceasefire before June 30, with the March 31 Trump-Xi summit a key near-term catalyst. A new US-Iran Conflict Dashboard tracking 14 key indicators across supply chains, tanker flows, and macro impacts has just been launched.
2. China Frontloads Exports Ahead of Section 301 Investigation
China's January–February exports surged 21.8% year-over-year, producing a record $213.6 billion trade surplus. Growth was driven by genuine demand — IC exports up 66.5%, autos up 67% — but heavily amplified by frontloading ahead of Trump's tariff actions, adding an estimated 0.4–0.6pp to US GDP as American importers stockpiled. A Supreme Court ruling temporarily lowered effective tariffs on Chinese goods to 24%, extending the export window. Geographic rebalancing is accelerating: despite an 11% drop in US-bound shipments, exports to Africa soared ~50%, ASEAN gained 29%, and EU shipments rose 28%, underscoring China's reduced dependence on the American market.
3. Private Credit Stress: Isolated, Not Systemic
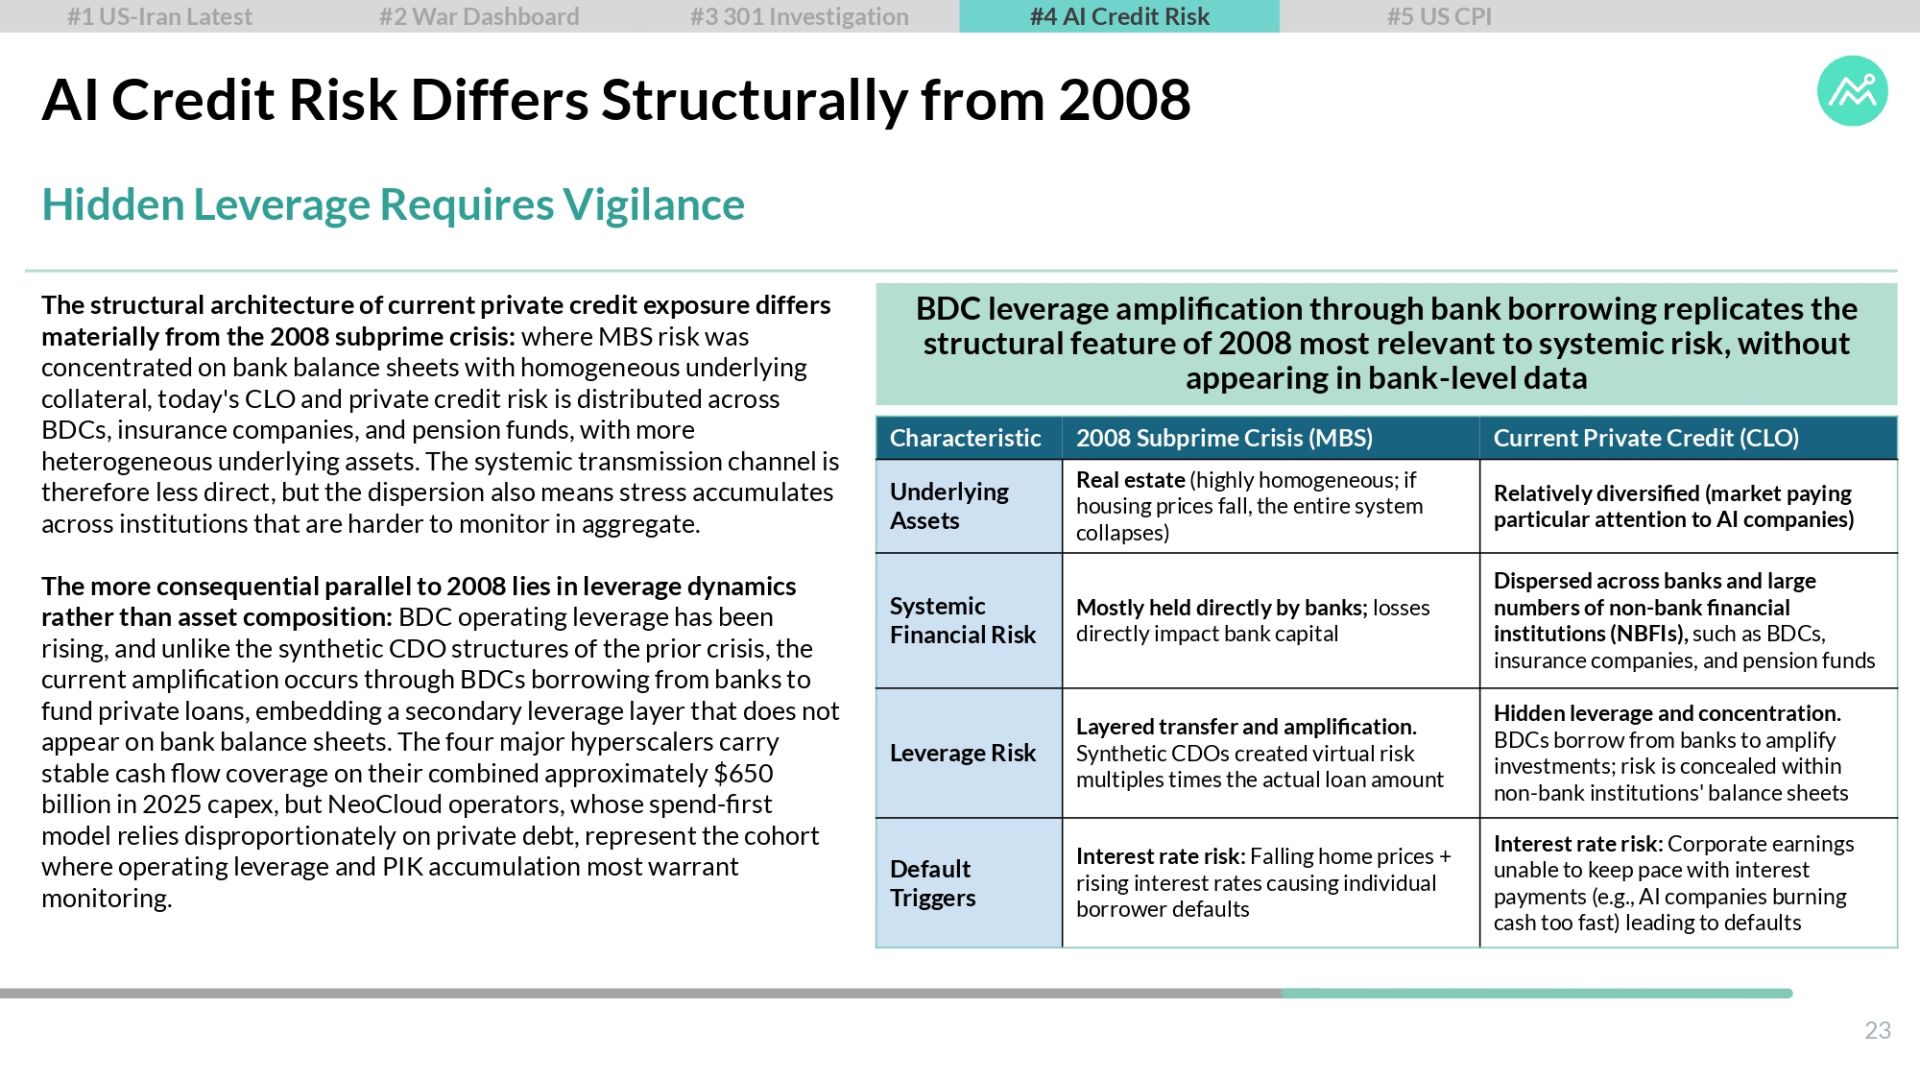
Following Market Financial Solutions' February 27 bankruptcy, the KBW Bank Index fell 6% intraday but quickly recovered, signaling idiosyncratic stress rather than systemic contagion. Redemption pressures at Blue Owl, BlackRock, and Blackstone reflect pockets of strain, but no cascading transmission has materialized. Among the top 20 US bank lenders to NBFIs, most carry exposure below 20% of assets, and NDFI default rates held flat at 0.14% in Q4 2025. The key early-warning signal is PIK interest rates: sustained ratios above 10–15% would flag cash flow stress building inside BDCs ahead of formal defaults. Unlike 2008's concentrated MBS risk, today's stress is more dispersed — but BDC leverage amplification through bank borrowing replicates a structurally similar dynamic worth watching closely.
4. February CPI Benign, But March Reacceleration Is Now Baseline
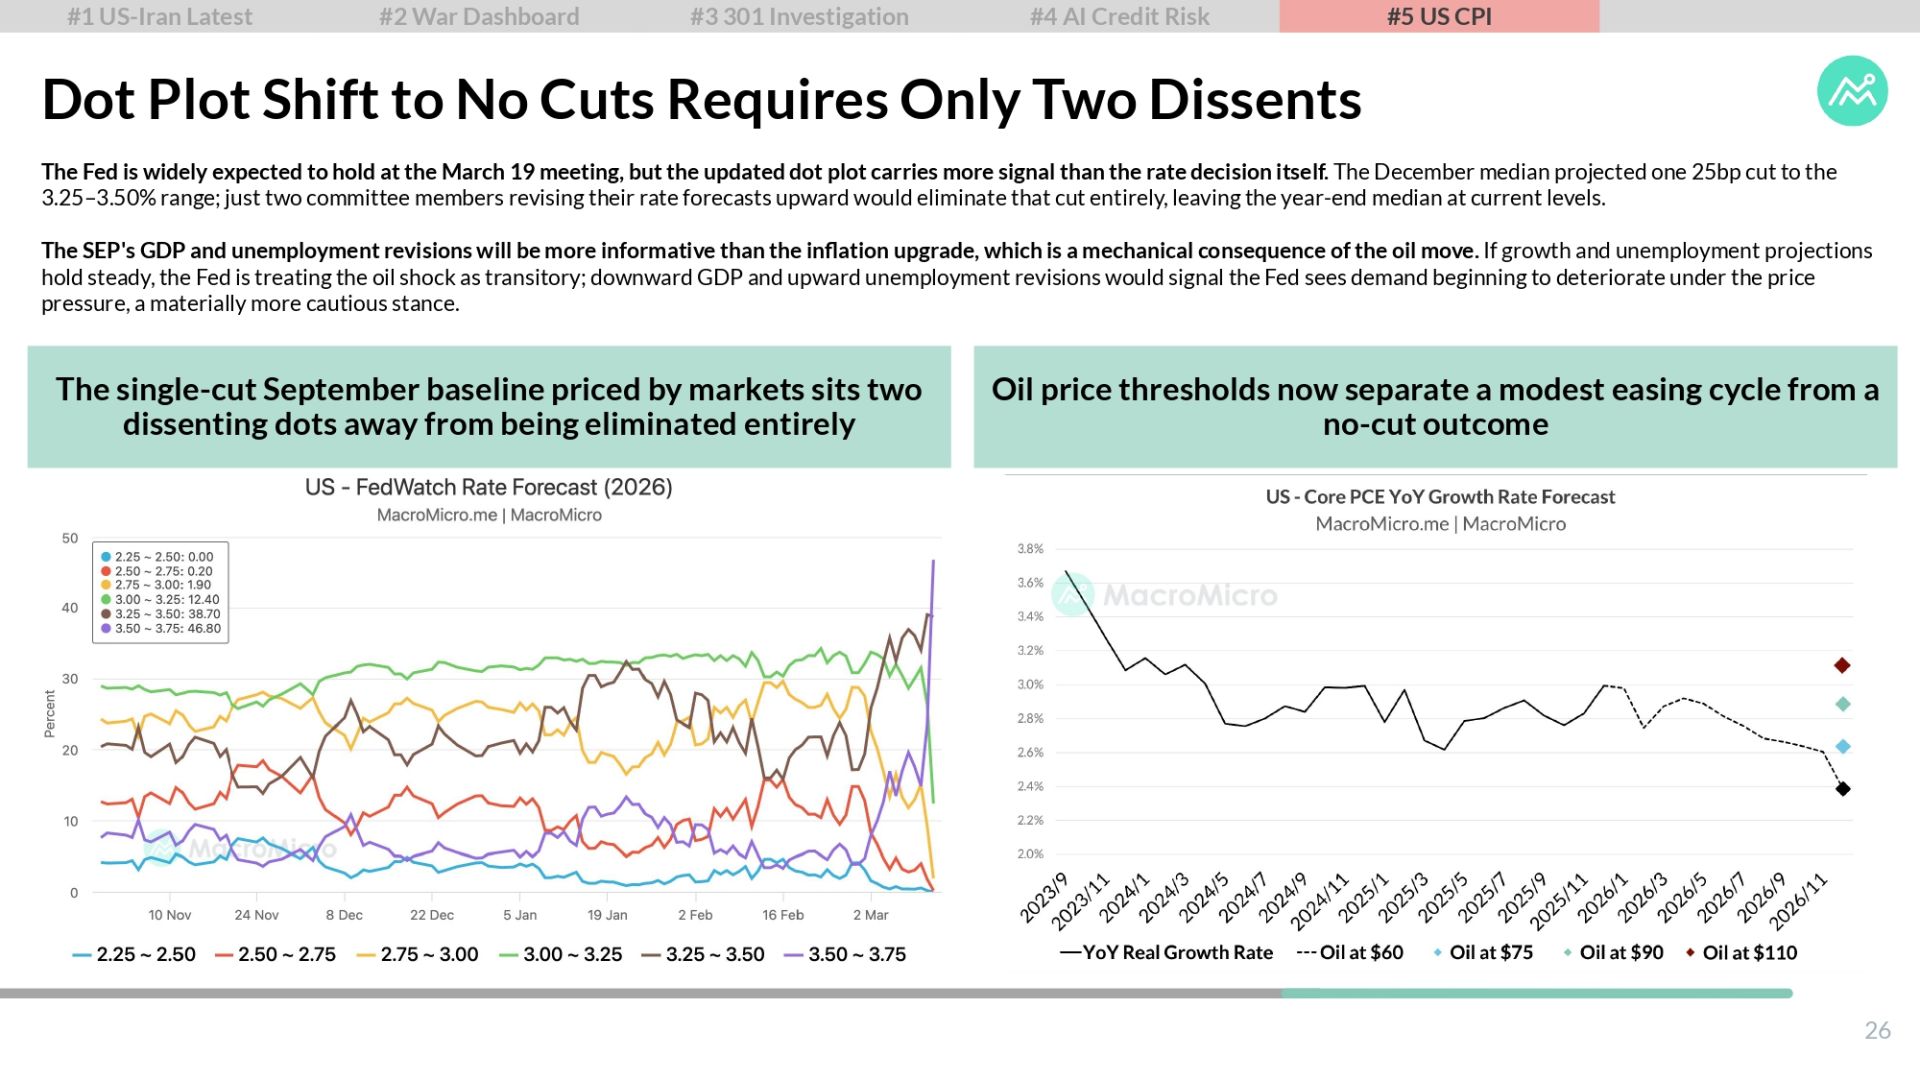
February core CPI eased to 2.47% — its lowest since 2021 — as shelter, goods, and services all decelerated. But the survey period closed before the oil spike: gasoline prices are up ~18% since late February, implying roughly 8% monthly energy inflation in March versus 0.6% in February. Combined with an unfavorable Q2 base effect, a material March CPI reacceleration is now the base case, not a tail risk. Fed Funds futures have repriced to just one 25bp cut this year, starting September. WTI sustained above $90 would hold year-end core near 2.9%, effectively closing the easing window. At the March 19 FOMC, the key watch is whether the dot plot shifts to zero cuts, and whether Powell commits to maintaining the $40 billion/month bond purchase pace as a liquidity bridge.
About Weekly Economic and Financial Commentary (WEFC)
The MacroMicro WEFC cuts through the noise, delivering rigorous analysis and in-depth insights on the most critical market-moving events. These topics cover equities, foreign exchange, bonds, commodities, global central banks, international political economy, and more.
At the core of WEFC is a concise Chart Pack, enabling you to grasp market trends at a glance.
Already a subscriber? Click here to log in.
Full Access to Our Services

Comprehensive data at your service
with key indicators for investment insights

Exclusive flash reports
on key events and data

Create your own charts and analysis
including performance backtesting

Hub of professionals to engage
in meaningful discussions and insights
 Get answers from MM AI.
-
What is the current status of the US-Iran conflict and its impact on oil prices?
💡The US-Iran conflict has entered its second week with no de-escalation, severely impacting oil prices. Brent and WTI remain above $90, and the OVX volatility index has breached 100, reflecting heightened market anxiety. Prediction markets assign a 70% probability to a ceasefire before June 30, with the upcoming March 31 Trump-Xi summit identified as a crucial near-term catalyst for potential de-escalation. The ongoing conflict has also led to a significant emergency release of 400 million barrels by the IEA, offsetting less than one-quarter of the current supply gap.
-
How has the Strait of Hormuz conflict affected global oil supply and tanker transits?
💡The Strait of Hormuz conflict has drastically impacted global oil supply and tanker transits, with vessel transits collapsing by 98% to single digits. Gulf production losses have exceeded 6 million barrels per day, a severity comparable to the 1973 and 1979 oil crises. In addition to the direct supply disruptions, freight rates have surged, further increasing the cost of oil transportation and contributing to the elevated oil prices. The IEA's emergency release of 400 million barrels aims to mitigate these losses but only partially addresses the substantial supply gap.
-
Why did China's January–February exports surge, and what role did Section 301 investigations play?
💡China's January–February exports surged 21.8% year-over-year, generating a record $213.6 billion trade surplus. This growth was driven by genuine demand, with IC exports up 66.5% and auto exports up 67%, but was heavily amplified by frontloading ahead of Trump's Section 301 tariff investigations. This frontloading added an estimated 0.4–0.6 percentage points to US GDP as American importers stockpiled goods. A Supreme Court ruling temporarily lowered effective tariffs on Chinese goods to 24%, further extending the export window and contributing to the export surge.
-
Is the current private credit stress considered systemic or isolated within the financial sector?
💡The current private credit stress is considered isolated, not systemic, following Market Financial Solutions' February 27 bankruptcy, as the KBW Bank Index quickly recovered after an initial 6% intraday fall. While redemption pressures at Blue Owl, BlackRock, and Blackstone indicate pockets of strain, no cascading transmission has materialized across the broader financial system. Most of the top 20 US bank lenders to Non-Bank Financial Institutions (NBFIs) maintain exposure below 20% of their assets, and NBFI default rates held flat at 0.14% in Q4 2025, reinforcing the view that the stress remains idiosyncratic.
-
How does current private credit risk differ from the 2008 financial crisis?
💡Current private credit risk differs from the 2008 financial crisis in its dispersion and underlying asset type. Unlike 2008's concentrated Mortgage-Backed Securities (MBS) risk, today's stress is more dispersed across various private credit portfolios, reducing the immediate threat of a single point of failure. However, a structurally similar dynamic exists through Business Development Company (BDC) leverage amplification via bank borrowing. This mechanism allows BDCs to increase their lending capacity by using bank funds, replicating a pathway for potential systemic risk if BDC-held assets broadly deteriorate. This interconnectedness warrants close monitoring.
-
Why is a March CPI reacceleration now considered the baseline scenario for inflation?
💡A March CPI reacceleration is now considered the baseline scenario for inflation due to several factors. The February core CPI survey closed before the significant oil price spike, which has seen gasoline prices rise approximately 18% since late February. This surge is expected to translate into roughly 8% monthly energy inflation in March, a substantial increase from February's 0.6%. Additionally, an unfavorable Q2 base effect will further contribute to higher year-over-year inflation readings. These combined pressures make a material reacceleration of overall CPI highly probable.
-
How has the oil price spike impacted expectations for March energy inflation?
💡The recent oil price spike has significantly impacted expectations for March energy inflation. Gasoline prices have increased approximately 18% since late February, which is projected to result in roughly 8% monthly energy inflation in March. This represents a substantial acceleration compared to the 0.6% energy inflation recorded in February. The surge in oil prices will be a primary driver of the overall CPI reacceleration expected in March, underscoring the strong influence of commodity markets on broader inflationary trends and household energy costs. This will push overall inflation higher.
-
What are the implications of sustained WTI prices above $90 for year-end core CPI?
💡Sustained WTI prices above $90 would have significant implications for year-end core CPI, effectively closing the easing window for monetary policy. If WTI remains consistently above this threshold, it is projected to hold year-end core CPI near 2.9%. Such elevated energy costs would continue to exert upward pressure on overall inflation, making it challenging for the Federal Reserve to achieve its target and justify interest rate cuts. This sustained commodity price strength would likely necessitate a more hawkish stance from the central bank, pushing back against any plans for monetary easing.
-
How have Fed Funds futures repriced in response to recent economic data?
💡Fed Funds futures have repriced significantly in response to recent economic data, particularly the anticipated March CPI reacceleration and sustained high oil prices. The market now forecasts just one 25 basis point interest rate cut this year, with the first cut expected to occur in September. This repricing reflects a more hawkish outlook from investors, who previously anticipated multiple cuts. The shift indicates market participants believe the Federal Reserve will maintain higher interest rates for longer to combat persistent inflationary pressures, thereby pushing back the timeline for monetary policy easing.
-
What key decisions are anticipated from the FOMC regarding interest rate cuts and bond purchases?
💡At the March 19 FOMC meeting, key decisions anticipated revolve around the dot plot and the bond purchase pace. The primary watch is whether the dot plot shifts to indicate zero interest rate cuts for the year, a more hawkish stance than previously expected. Additionally, observers will be keen to see if Chair Powell commits to maintaining the current $40 billion/month bond purchase pace, which acts as a critical liquidity bridge. These decisions will provide crucial insights into the Federal Reserve's updated economic outlook and its strategy for managing inflation and market liquidity amidst evolving economic conditions.

