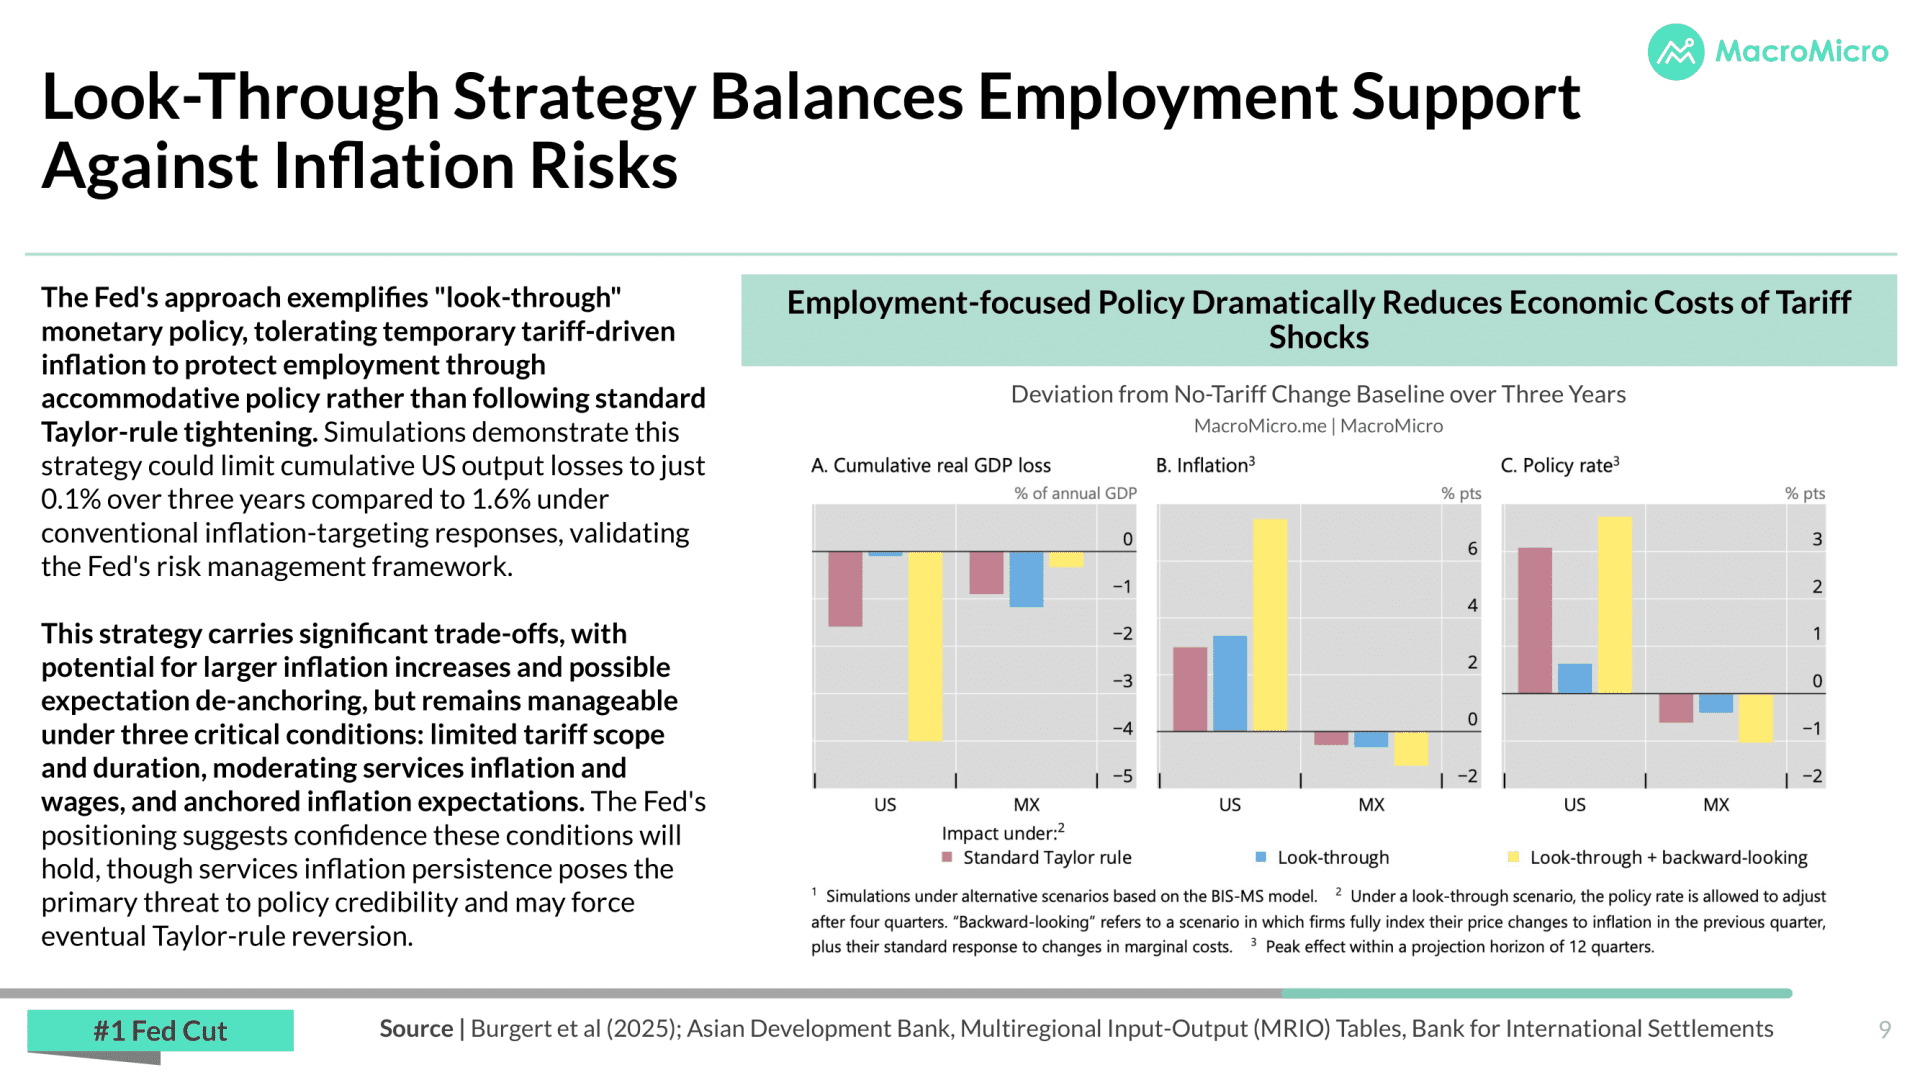
At its September meeting, the Fed cut rates by a quarter point, but its new economic projections were confusing. The Fed raised its forecasts for growth and inflation while lowering its unemployment outlook. According to the "old Taylor Rule," this should keep rates high, but the dot plot still predicts more rate cuts. This raises the question of whether the Fed is still guided by the Taylor Rule. What is the FOMC's current approach to monetary policy?
Meanwhile, the Bank of Japan will start selling its ETFs. In China, the government is pushing its "new productive forces" policy while also launching an antitrust investigation into Nvidia. What are the impacts on financial markets? We'll break it all down in this week's WEFC report.
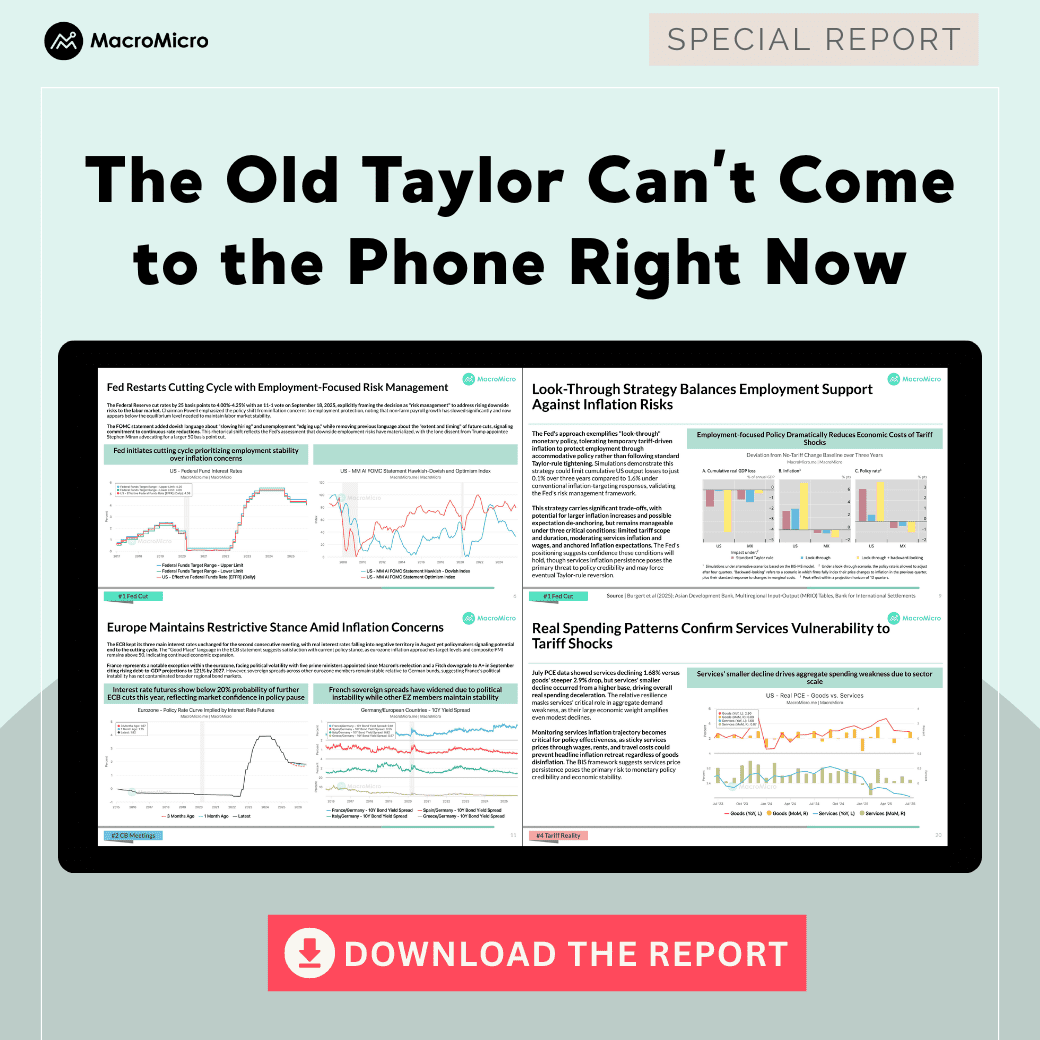
Fed Shifts Toward Employment-Focused Easing
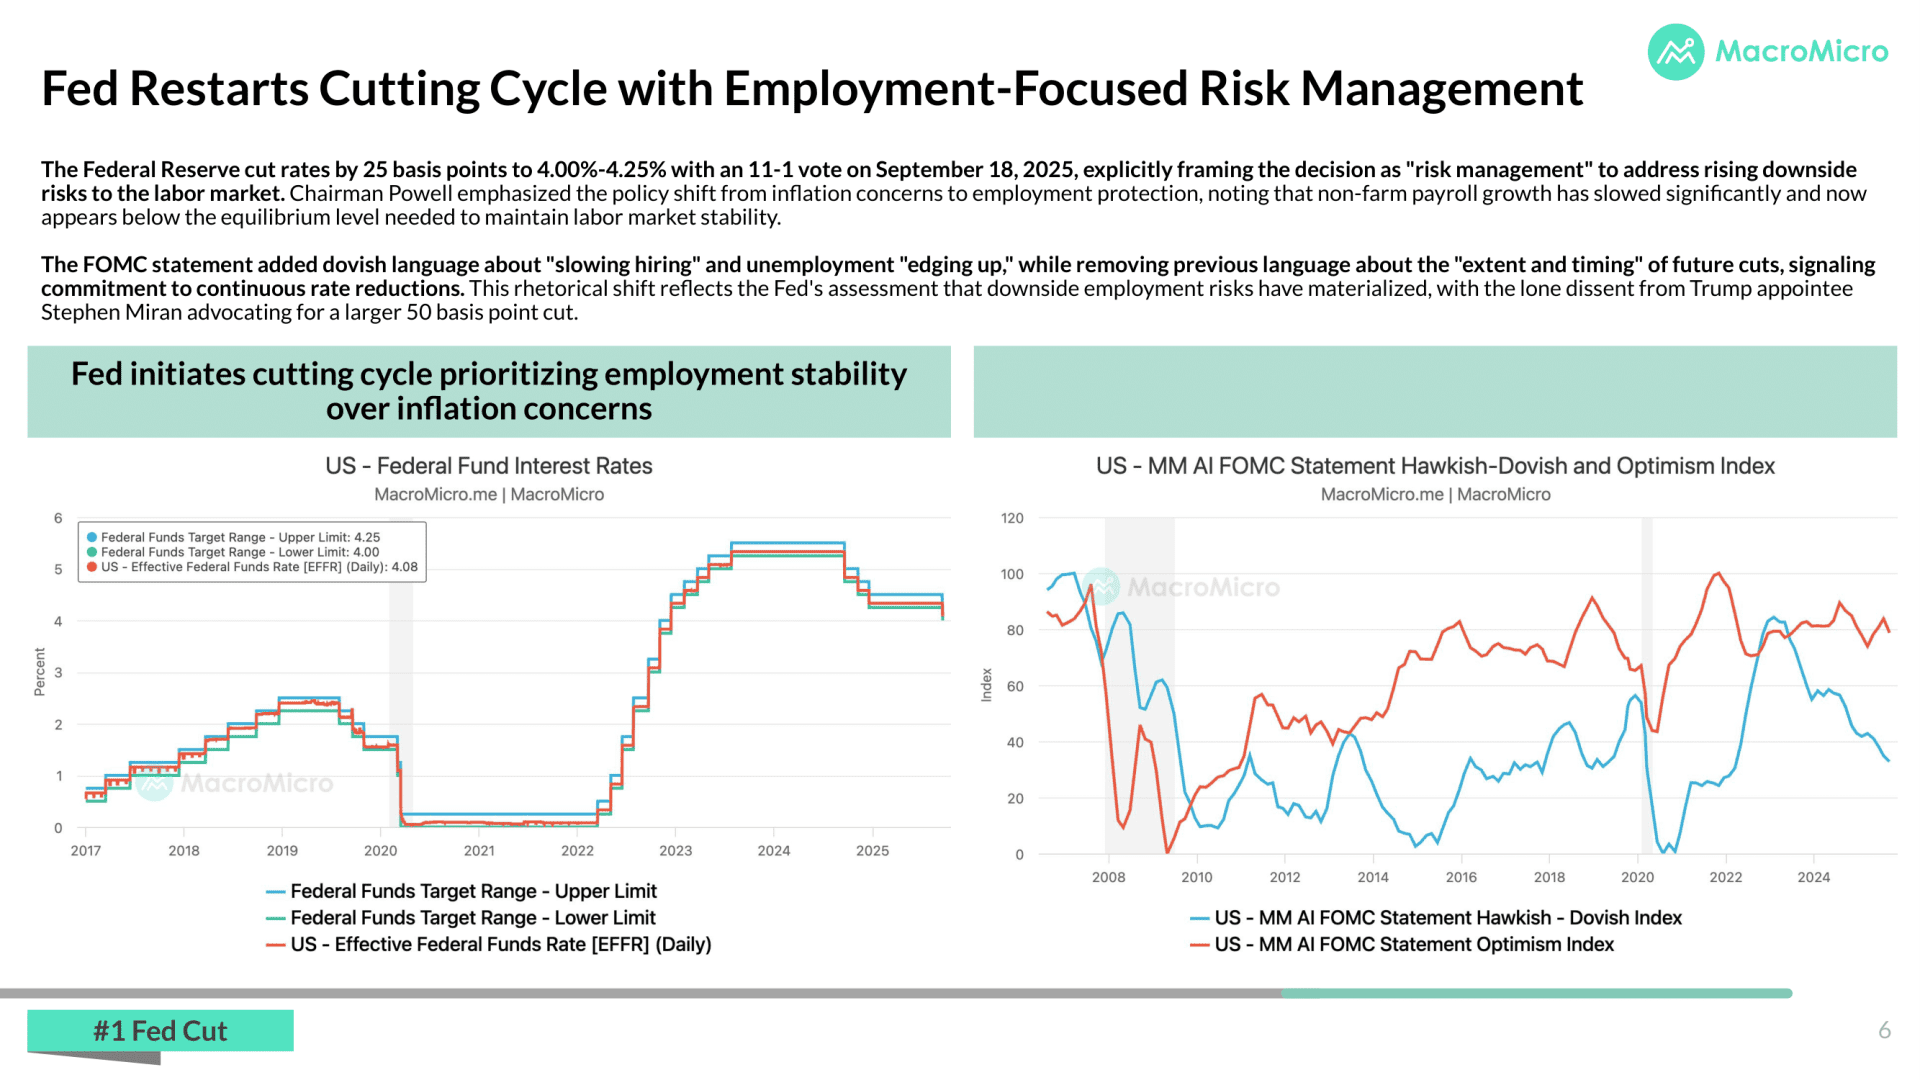
The Federal Reserve cut its key interest rate by 25 basis points to a range of 4.00%-4.25% in September 2025. This was the first cut since December 2024 and was framed as a "risk management" move focused on protecting the labor market. Chairman Jerome Powell highlighted that job growth has slowed and unemployment has edged up, signaling a shift in the Fed's primary concern from inflation to employment stability. The updated dot plot forecasts three rate cuts for 2025, a more aggressive near-term easing path than previously projected, reflecting the Fed's heightened concern about labor market deterioration despite maintaining a more conservative medium-term outlook.
Global Central Banks Diverge After Fed Cut
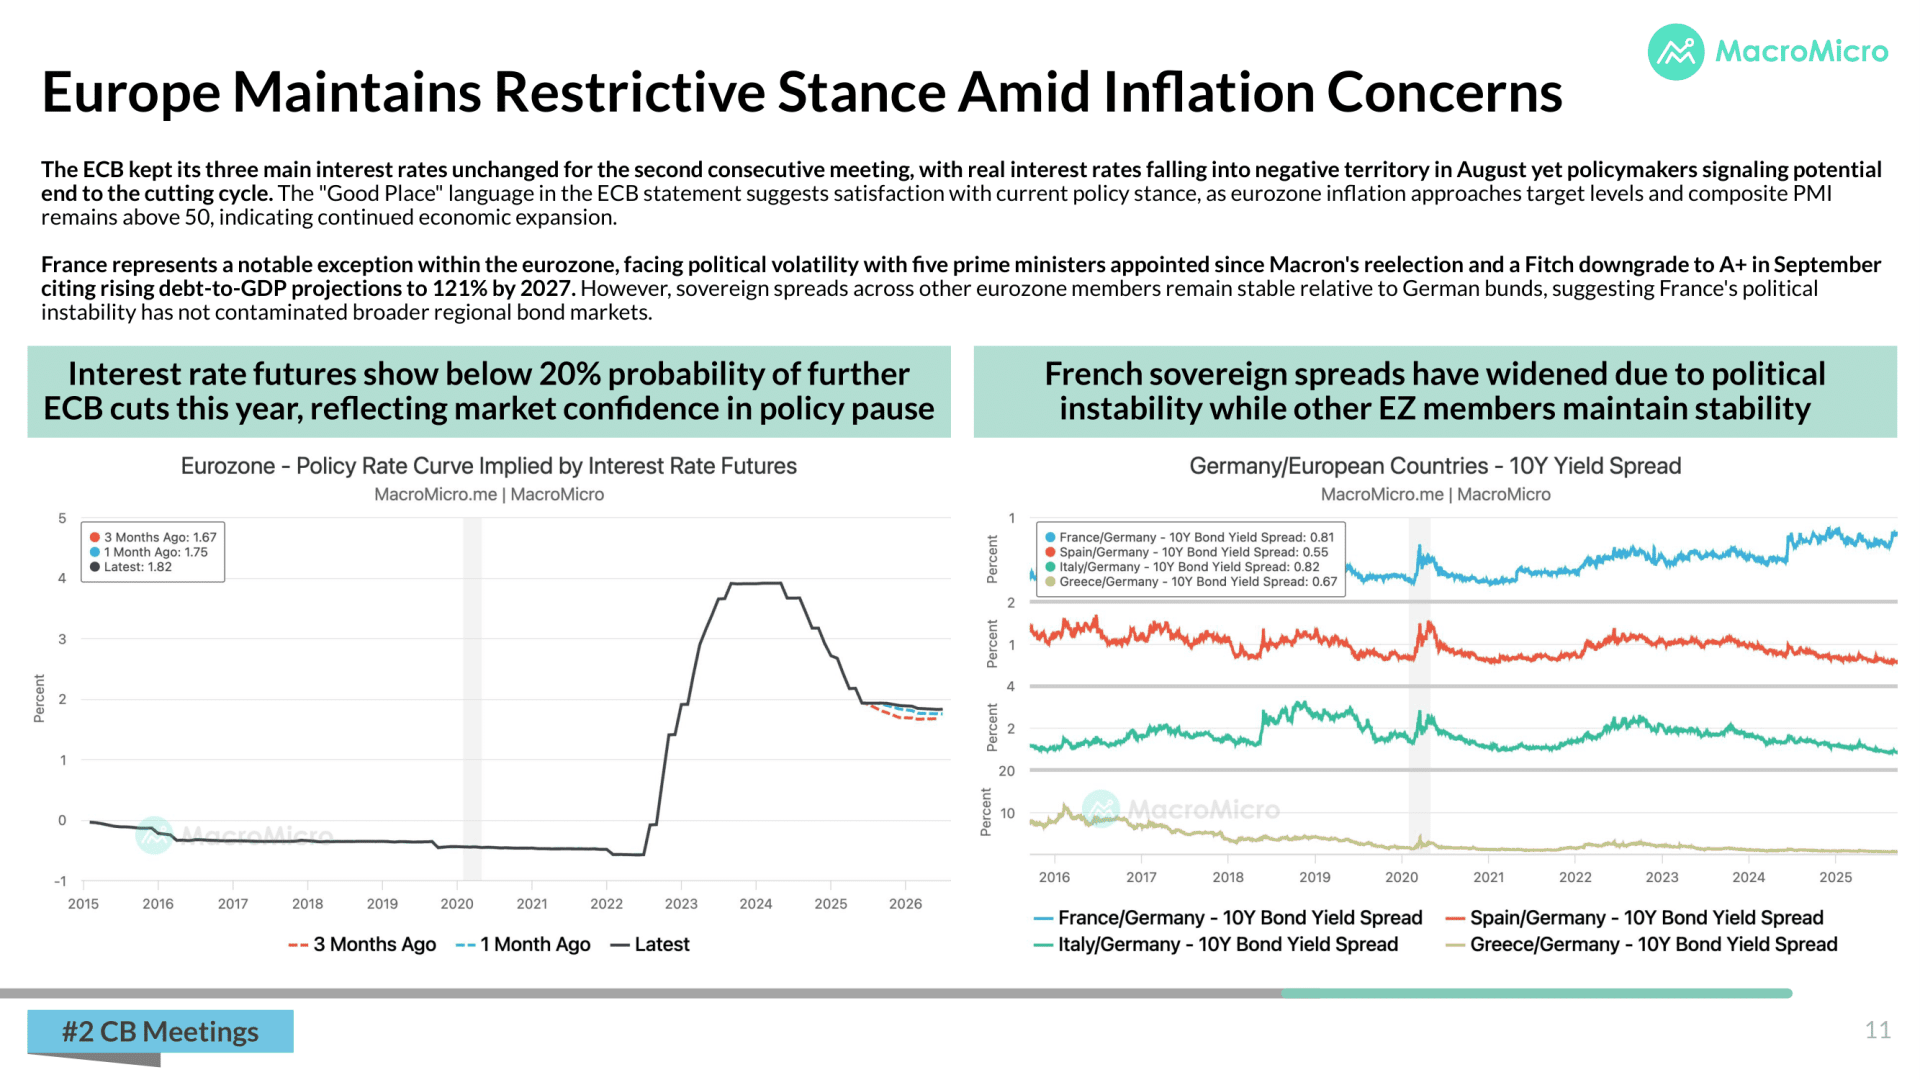
In contrast to the Fed's rate cut, the European Central Bank (ECB) and the Bank of England (BoE) both held their policy rates steady. The ECB cited eurozone inflation being near its target and continued economic expansion. The BoE, while slowing its quantitative tightening, kept rates at 4.0% due to persistent inflation risks, which remained at 3.8% in August. The Bank of Japan (BoJ) also held its rate at 0.5% but showed growing hawkishness, with two members dissenting for a hike and the bank announcing plans to sell ETF holdings.
China’s Equity Rally Driven by High-Tech Strength
Despite a general slowdown in China's overall economy in August, including a deceleration in industrial output and retail sales, the stock market rally was primarily driven by the strong performance of high-tech sectors. Industrial value added slowed to 5.2% year-on-year, but high-tech manufacturing maintained a robust 9.3% growth. Key sectors like servers (86.2%), lithium batteries (44.2%), and new energy vehicles (22.7%) posted impressive gains. This indicates a structural shift in the economy, where investment and growth are concentrating in "new productive forces" such as AI and energy infrastructure, which are seen as a strategic priority. This focus on domestic technological self-sufficiency and strategic investment provided a strong narrative for market optimism.
Treasuries Retain Role but Safe-Haven Status Looks Conditional
US Treasuries temporarily lost their safe-haven appeal earlier in 2025 as tariffs and Fed policy uncertainty pushed investors toward German Bunds. Correlations broke down, with Bunds outperforming thanks to Europe’s fiscal credibility and the ECB’s clear policy stance. However, since June, Treasury demand has rebounded as Fed easing improved clarity and rate spreads narrowed. Foreign selling has reversed and holdings stabilized, suggesting the shift was tactical rather than structural. Treasuries’ unmatched size and liquidity ensure they remain the global anchor for safe-haven flows. While correlations may fluctuate, their dominant role as the world’s largest bond market persists.
Tariffs Indirectly Hit Services, US Data Confirms
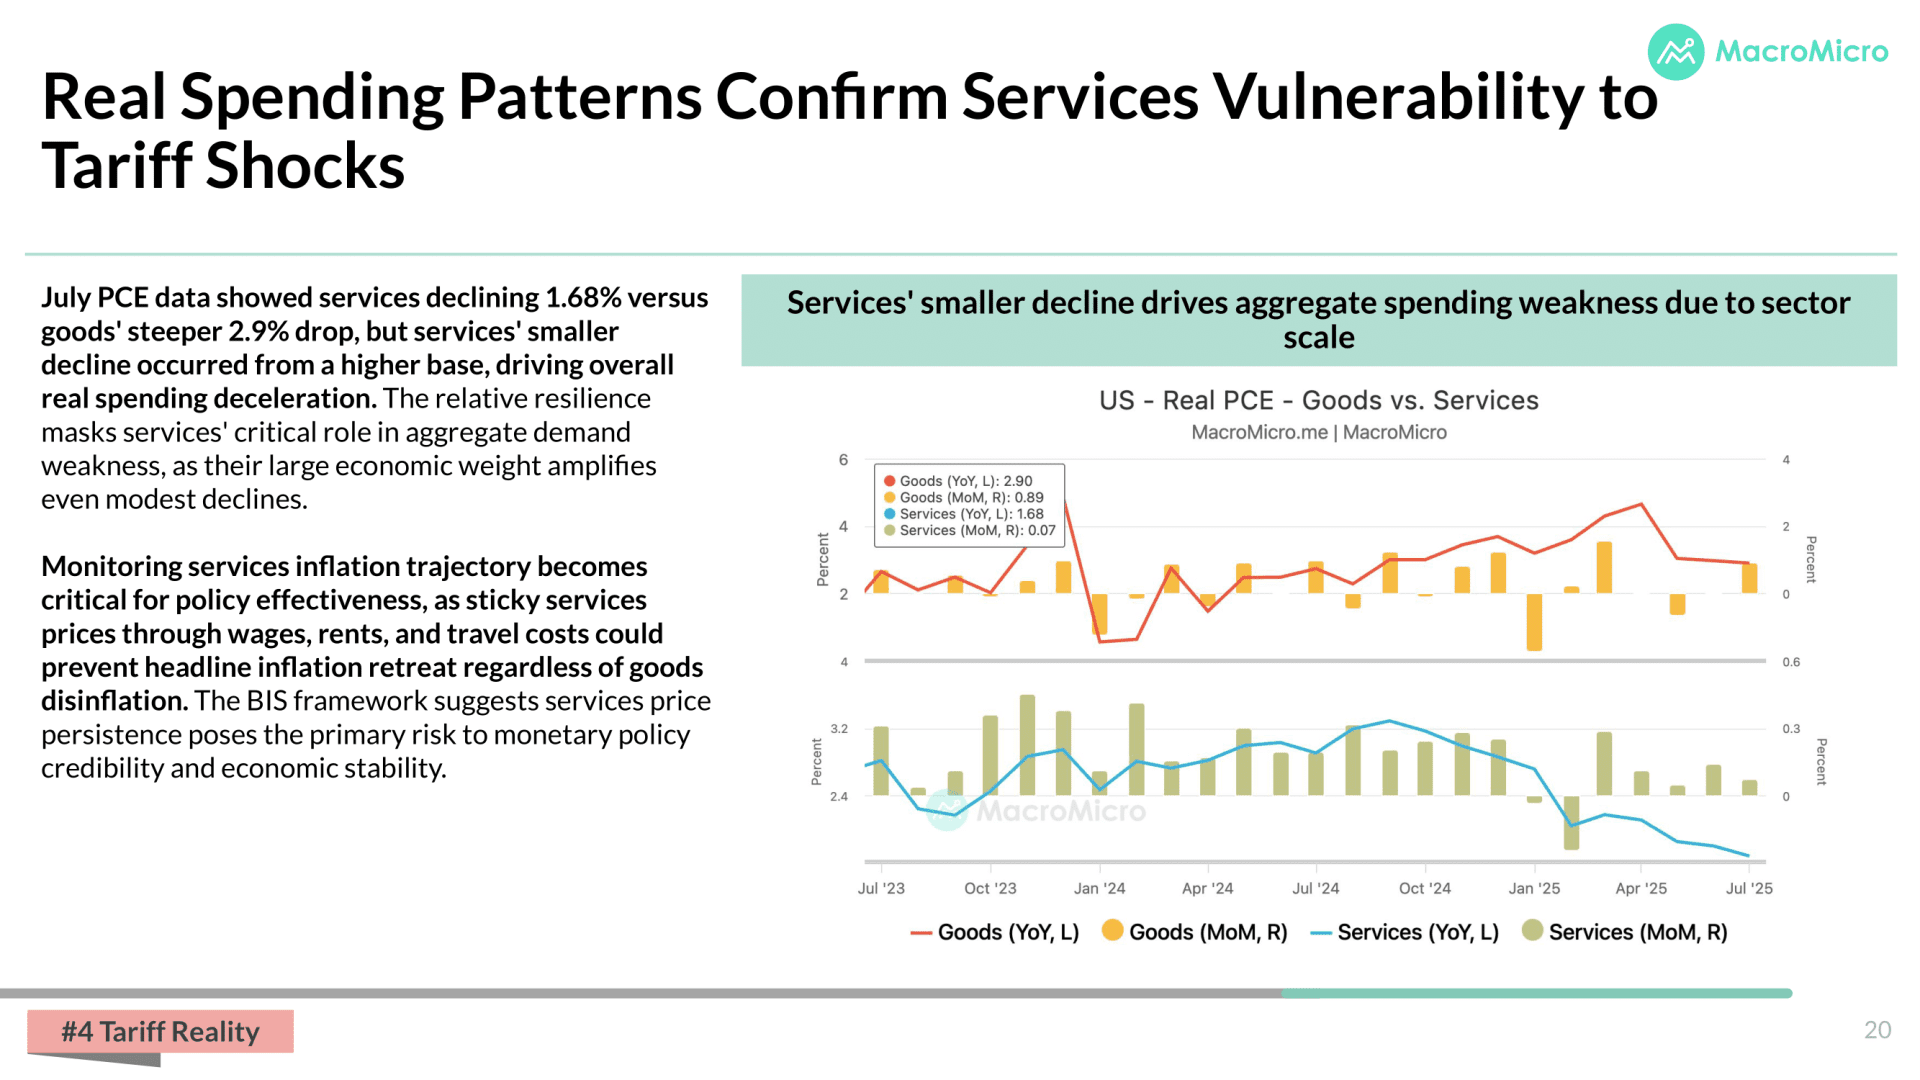
Although tariffs target goods, their impact spreads widely through supply chains and wage costs, making services vulnerable. BIS research finds services account for 30–50% of tariff-related output losses despite no direct exposure. US data validates this: core services CPI rose 3.6% YoY in August, outpacing goods inflation at 1.5%. The ISM services prices index stayed high, signaling persistent cost pressures even as goods disinflated.
Already a subscriber? Click here to log in.
Full Access to Our Services

Comprehensive data at your service
with key indicators for investment insights

Exclusive flash reports
on key events and data

Create your own charts and analysis
including performance backtesting

Hub of professionals to engage
in meaningful discussions and insights
