Global equity markets mostly advanced last week. Despite the ongoing stalemate in the Strait of Hormuz, softer-than-feared US inflation data and a sharp rise in expectations that the Federal Reserve will not hike rates this year supported risk assets. The S&P 500, Nasdaq and Philadelphia Semiconductor Index all posted gains. The 10-year Treasury yield climbed and consolidated near a high of 4.7%, pressured by elevated rates at long-end auctions and the New York Fed’s pause in reserve management purchases.
See this week’s WEFC analysis for details.
This Week's WEFC Preview
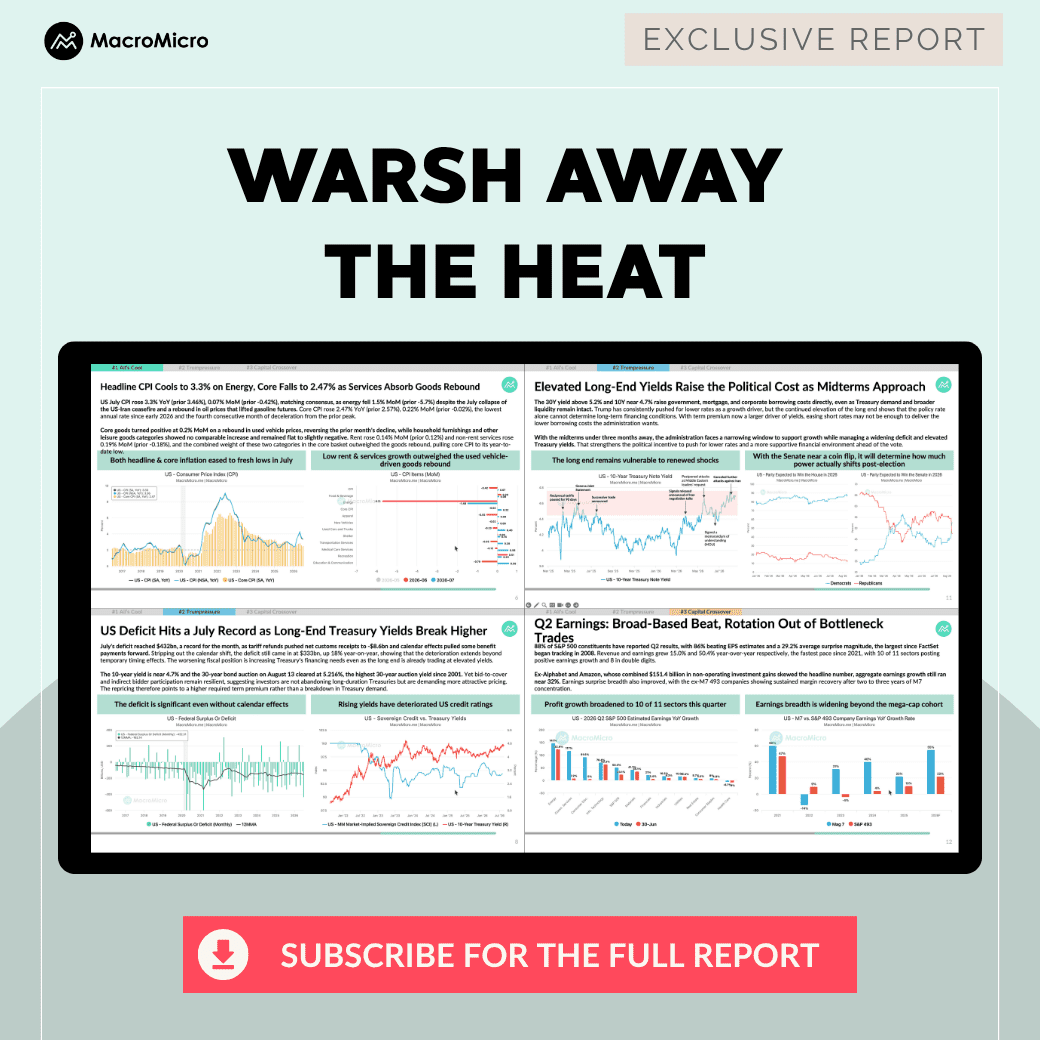
1. Weekly Market Roundup: Soft Inflation Lifts Risk Assets
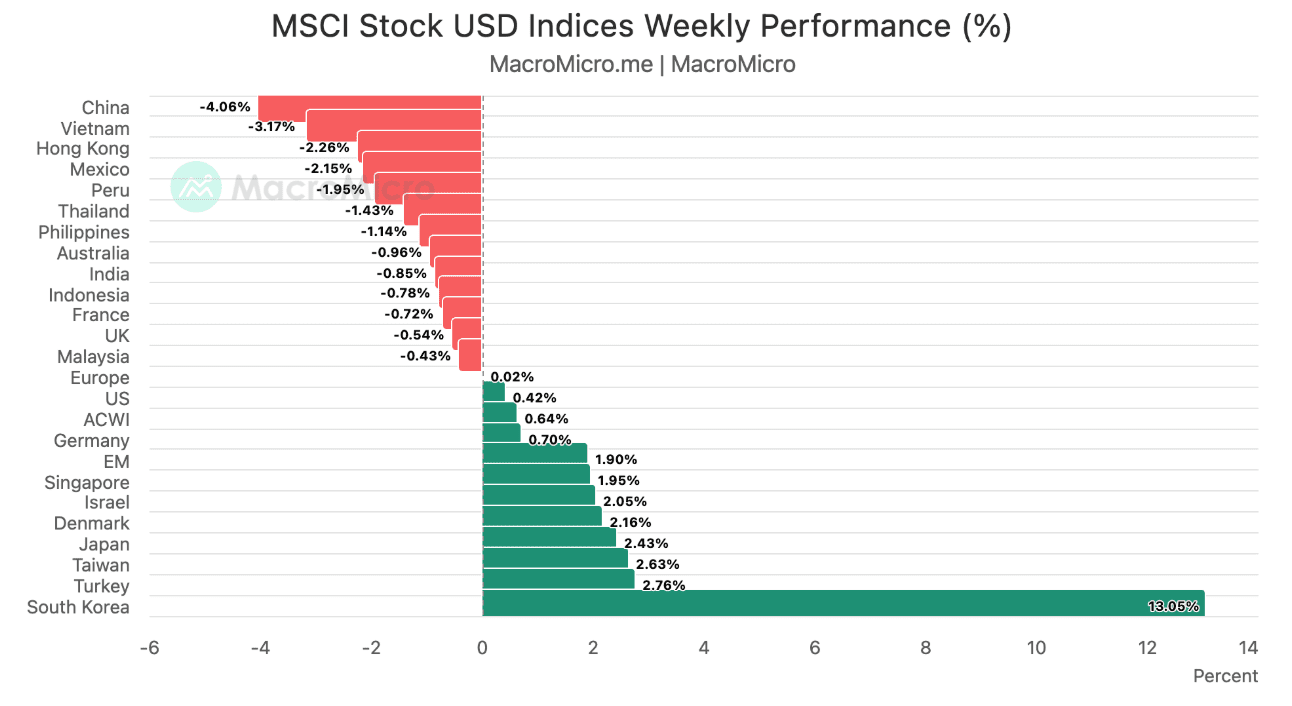
- Global equities mostly advanced, with Asia leading the rebound. Softer-than-feared US inflation and a sharp rise in expectations that the Fed will not hike this year supported risk assets, despite the ongoing stalemate in the Strait of Hormuz. The S&P 500, Nasdaq and Philadelphia Semiconductor Index all gained, while European equities lagged with more muted advances.
- The 10-year Treasury yield climbed and consolidated near a high of 4.7%. Elevated rates at long-end auctions and the New York Fed's pause in reserve management purchases kept pressure on the long end. The US dollar index traded sideways.
- Commodities broadly recovered. WTI crude reclaimed the $80/barrel level, while gold, copper and agricultural prices also bounced. Wheat (+5.35%) and corn (+4.73%) led the weekly move; Henry Hub natural gas fell 4.37%.
- Sector and FX breadth confirmed the risk-on tone. Utilities (+2.59%) and energy (+2.56%) led S&P 500 sectors while consumer discretionary (-2.24%) lagged. TWD (+0.58%) and AUD (+0.44%) firmed against a softer dollar.
▌Related Charts: Forex market, Commodity market, Bond market
2. All's Cool: Inflation Cools and September Hike Odds Slip Below 50%
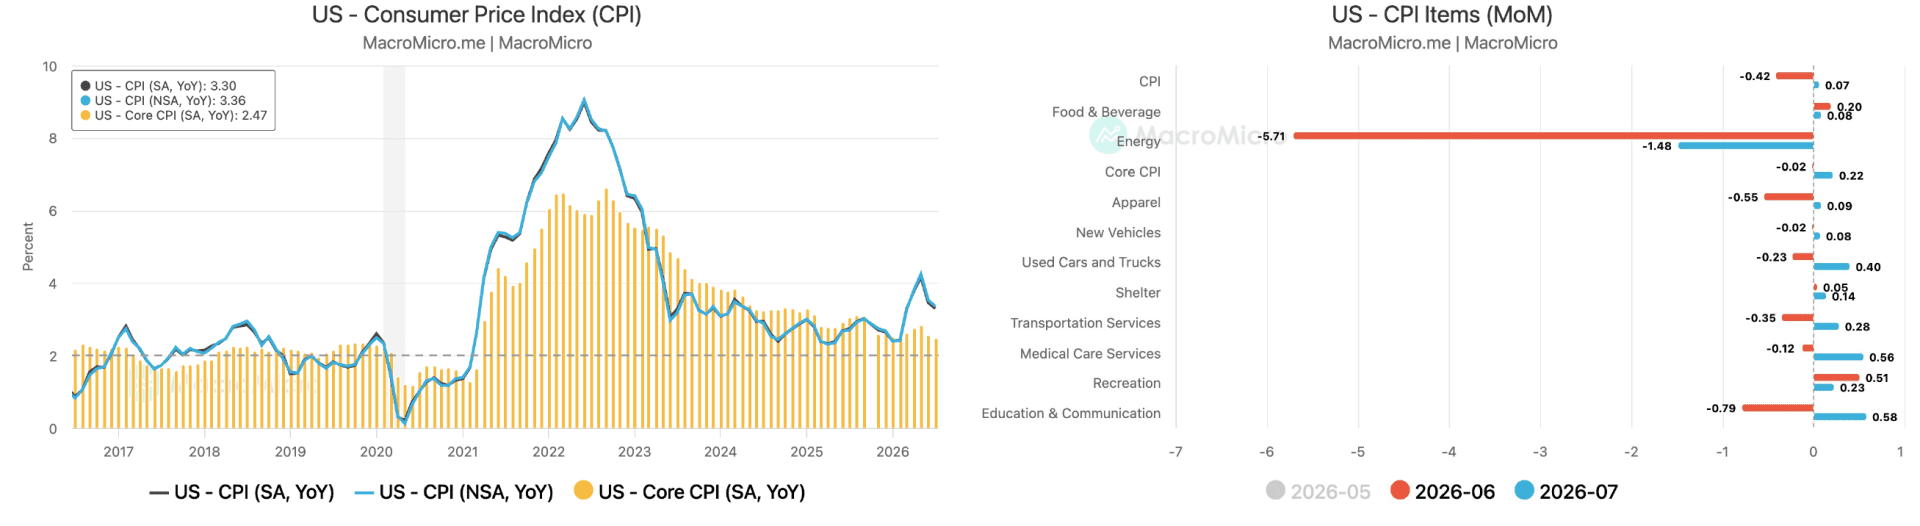
- Headline CPI rose 3.3% YoY and 0.07% MoM, matching consensus. Energy fell 1.5% MoM (prior -5.7%) despite the July collapse of the US-Iran ceasefire and a rebound in oil prices that lifted gasoline futures.
- Core CPI eased to 2.47% YoY and 0.22% MoM, the lowest annual rate since early 2026 and the fourth consecutive month of deceleration from the prior peak.
- Rent and services outweighed a goods rebound. Core goods turned positive at 0.2% MoM on used vehicles, but rent rose only 0.14% MoM and non-rent services 0.19% MoM; their combined weight pulled core CPI to its year-to-date low.
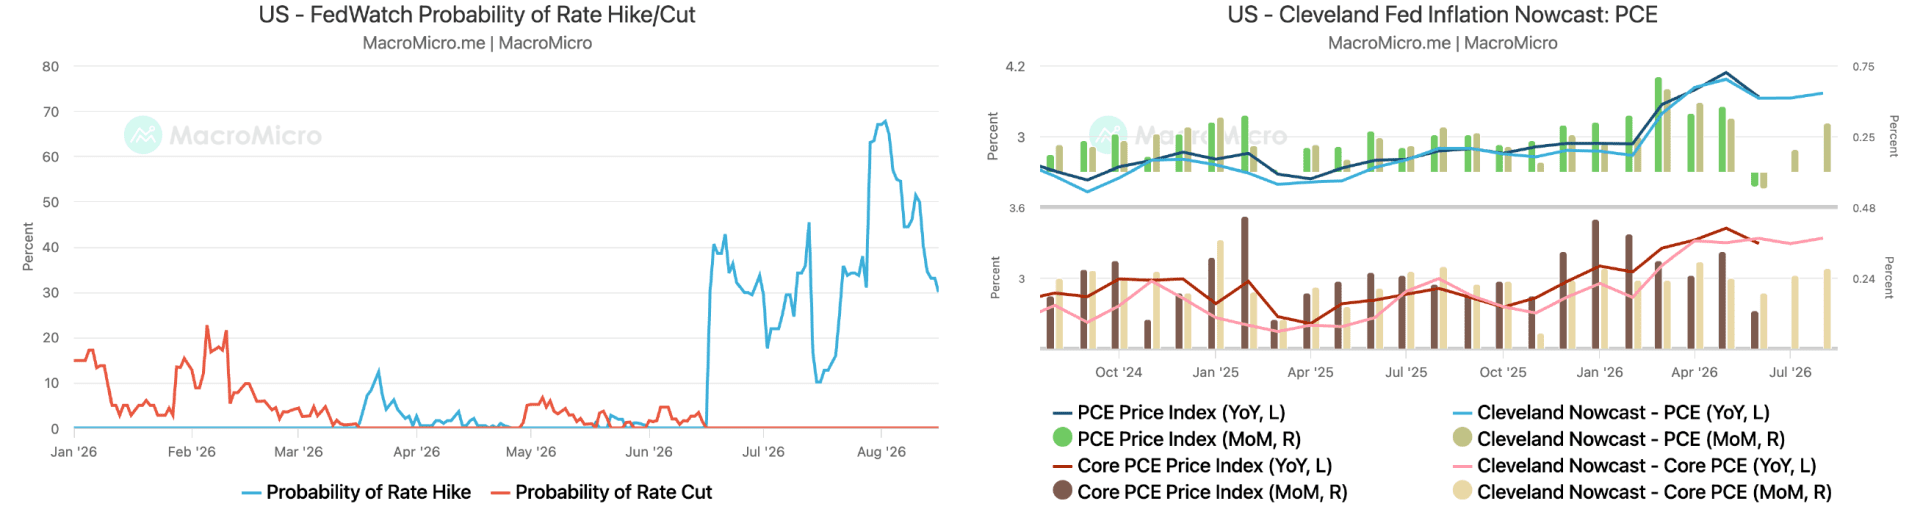
- FedWatch odds of a September hike fell below 50% after the CPI release, extending a decline that began with the prior month's weaker-than-expected payrolls. US equity futures rose overnight on the combination.
- July core PCE, due at month-end, is the next test. A monthly print above the 0.2% threshold that has anchored the Fed's disinflation timeline would raise the risk of an upward revision to rate expectations.
▌Related Charts: CPI items MoM, Cleveland Fed inflation nowcast — PCE
3. Trumpressure: A Fiscal Surge Meets a Higher Cost of Long-Term Capital
- July's deficit reached a record $432bn for the month. Tariff refunds pushed net customs receipts to -$8.6bn and calendar effects pulled some benefit payments forward; stripping out the shift still leaves $333bn, up 18% year-on-year.
- The long end is repricing term premium, not Treasury demand.

Subscribe Now to Download the Full Report
About Weekly Economic and Financial Commentary (WEFC)
The MacroMicro WEFC is published weekly, delivering rigorous analysis and in-depth insights on the most critical market-moving events. Coverage spans equities, foreign exchange, bonds, commodities, global central banks, geopolitics, and the international political economy.
At its core is a concise, roughly 20-page Chart Pack designed to help you grasp market trends at a glance. Subscribe Now » to download the full PDF report, lock in the current offer before prices rise and secure your future upgrade to Max AI with full AI access.
Already a subscriber? Click here to log in.
Full Access to Our Services

Comprehensive data at your service
with key indicators for investment insights

Exclusive flash reports
on key events and data

Create your own charts and analysis
including performance backtesting

Hub of professionals to engage
in meaningful discussions and insights
 Get answers from MM AI.
-
How did softer US inflation data impact global equity markets and risk assets?
💡Softer-than-feared US inflation data, combined with a sharp rise in expectations that the Federal Reserve will not hike rates this year, significantly supported risk assets, leading to a broad advance in global equity markets. This positive sentiment occurred despite an ongoing stalemate in the Strait of Hormuz, indicating that domestic economic data played a more dominant role in market direction.
-
What factors caused the 10-year Treasury yield to climb near 4.7%?
💡The 10-year Treasury yield climbed and consolidated near a high of 4.7% due to elevated rates at long-end auctions and the New York Fed's pause in reserve management purchases. These factors collectively exerted upward pressure on long-term Treasury yields, reflecting a repricing of term premium rather than a lack of demand.
-
How did commodities perform, specifically WTI crude, wheat, and corn prices?
💡Commodities broadly recovered last week, with WTI crude reclaiming the $80/barrel level. Agricultural prices also bounced significantly, led by wheat which rose 5.35% and corn which increased by 4.73%, indicating a general risk-on sentiment in the commodities market, although Henry Hub natural gas fell 4.37%.
-
What was the impact of the CPI release on FedWatch odds for a September interest rate hike?
💡The CPI release significantly impacted FedWatch odds for a September interest rate hike, causing them to fall below 50%. This decline extended a trend that began with weaker-than-expected payrolls from the prior month, leading to an overnight rise in US equity futures as market participants anticipated a less hawkish Federal Reserve stance.
-
How did the August 13 auction for 30-year Treasury yields perform compared to historical levels?
💡The August 13 auction for 30-year Treasury yields performed at 5.216%, which was the highest 30-year auction yield since 2001. Despite this elevated yield, bid-to-cover ratios and indirect bidder participation remained resilient, indicating that the long end is repricing term premium rather than reflecting a lack of Treasury demand.
-
What is the significance of the Fed's Reserve Management Purchases (RMP) pause for Treasury demand?
💡The Fed's Reserve Management Purchases (RMP) pause removes roughly $30 billion of expected T-bill demand from mid-August to mid-September. However, this impact is manageable as Treasury's planned $100 billion Q4 Treasury General Account (TGA) reduction is expected to more than offset it, with money-market fund assets remaining near historical highs.
-
What was the average EPS surprise magnitude for S&P 500 companies?
💡The average EPS surprise magnitude for S&P 500 companies was 29.2%, the largest since FactSet began tracking in 2008, with 86% of reporters beating estimates and 88% of the S&P 500 having reported. Revenue and earnings grew by 15.0% and 50.4% year-over-year, respectively, marking the fastest pace since 2021.
-
Which S&P 500 sectors showed widened breadth and significant growth?
💡Breadth widened to 10 of 11 S&P 500 sectors, with 8 sectors showing double-digit growth. Excluding Alphabet and Amazon, whose combined $151.4 billion in non-operating investment gains skewed the headline, aggregate growth still ran near 32%, with the ex-M7 493 exhibiting sustained margin recovery.

