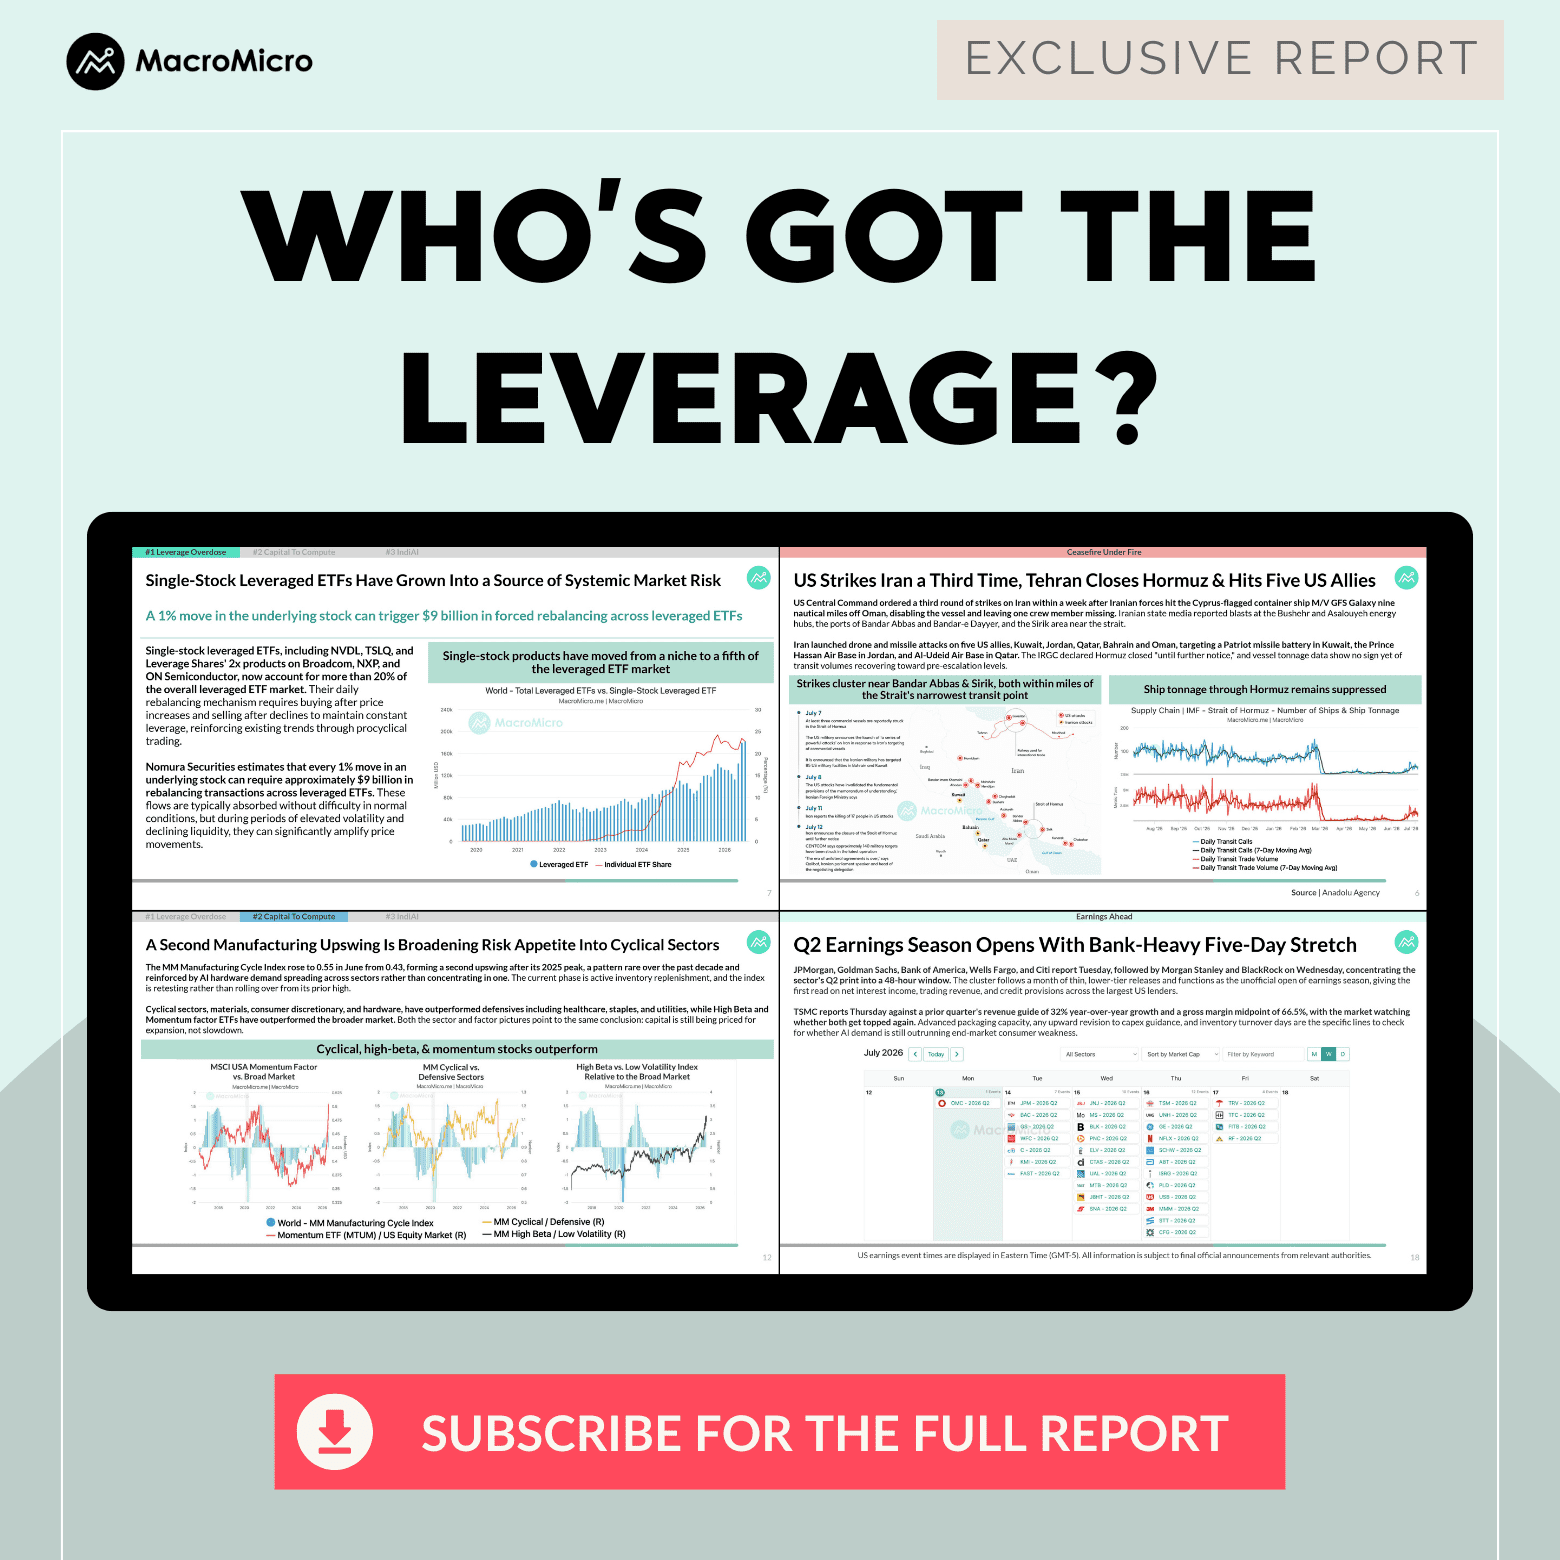
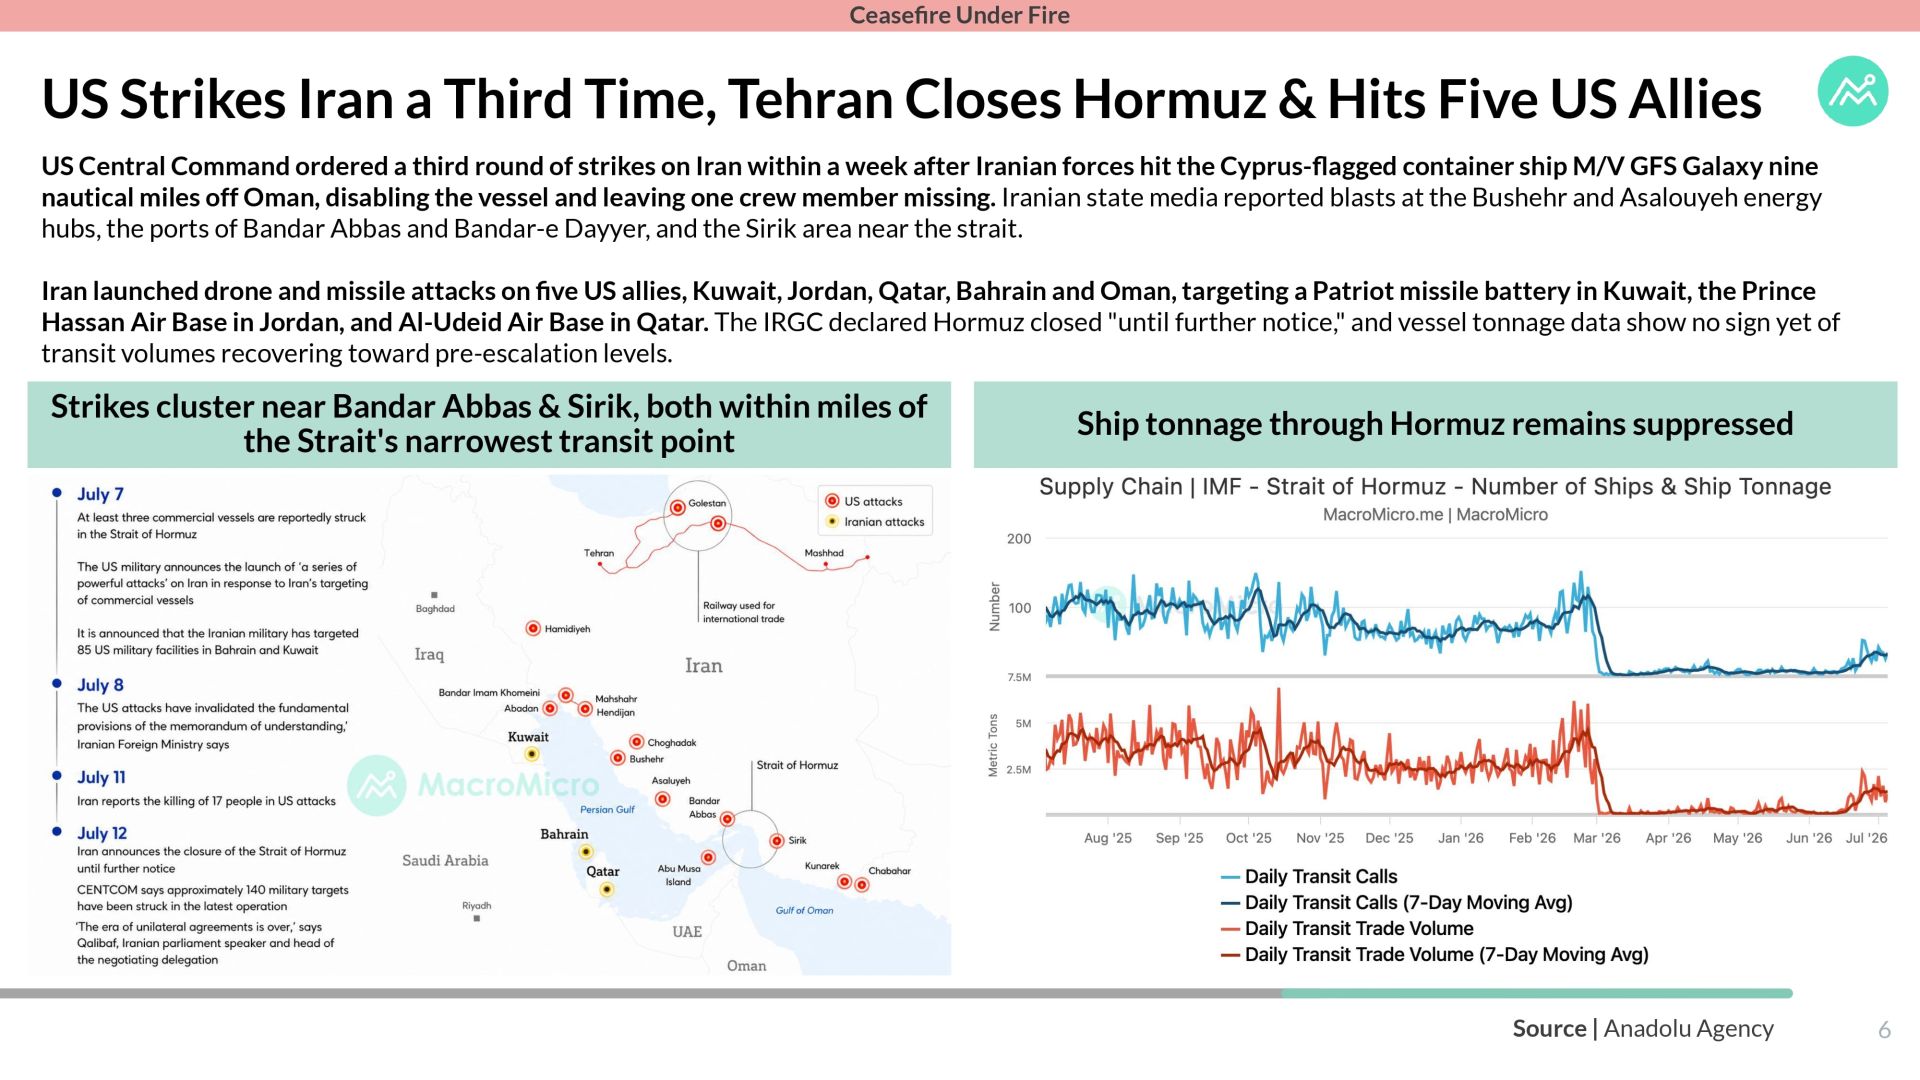
Global markets absorbed a third round of US strikes on Iran and a Hormuz closure without much drama, but the real volatility was homegrown: South Korea's newly approved single-stock leveraged ETFs on Samsung and SK Hynix produced a sixth circuit breaker in H1 2026, matching the country's entire prior history combined. Meanwhile, capital within tech is quietly rotating away from the hyperscalers spending on AI toward the suppliers actually cashing in on it. Read the full report for our latest analysis.
Key Focus of This Week’s Report
-
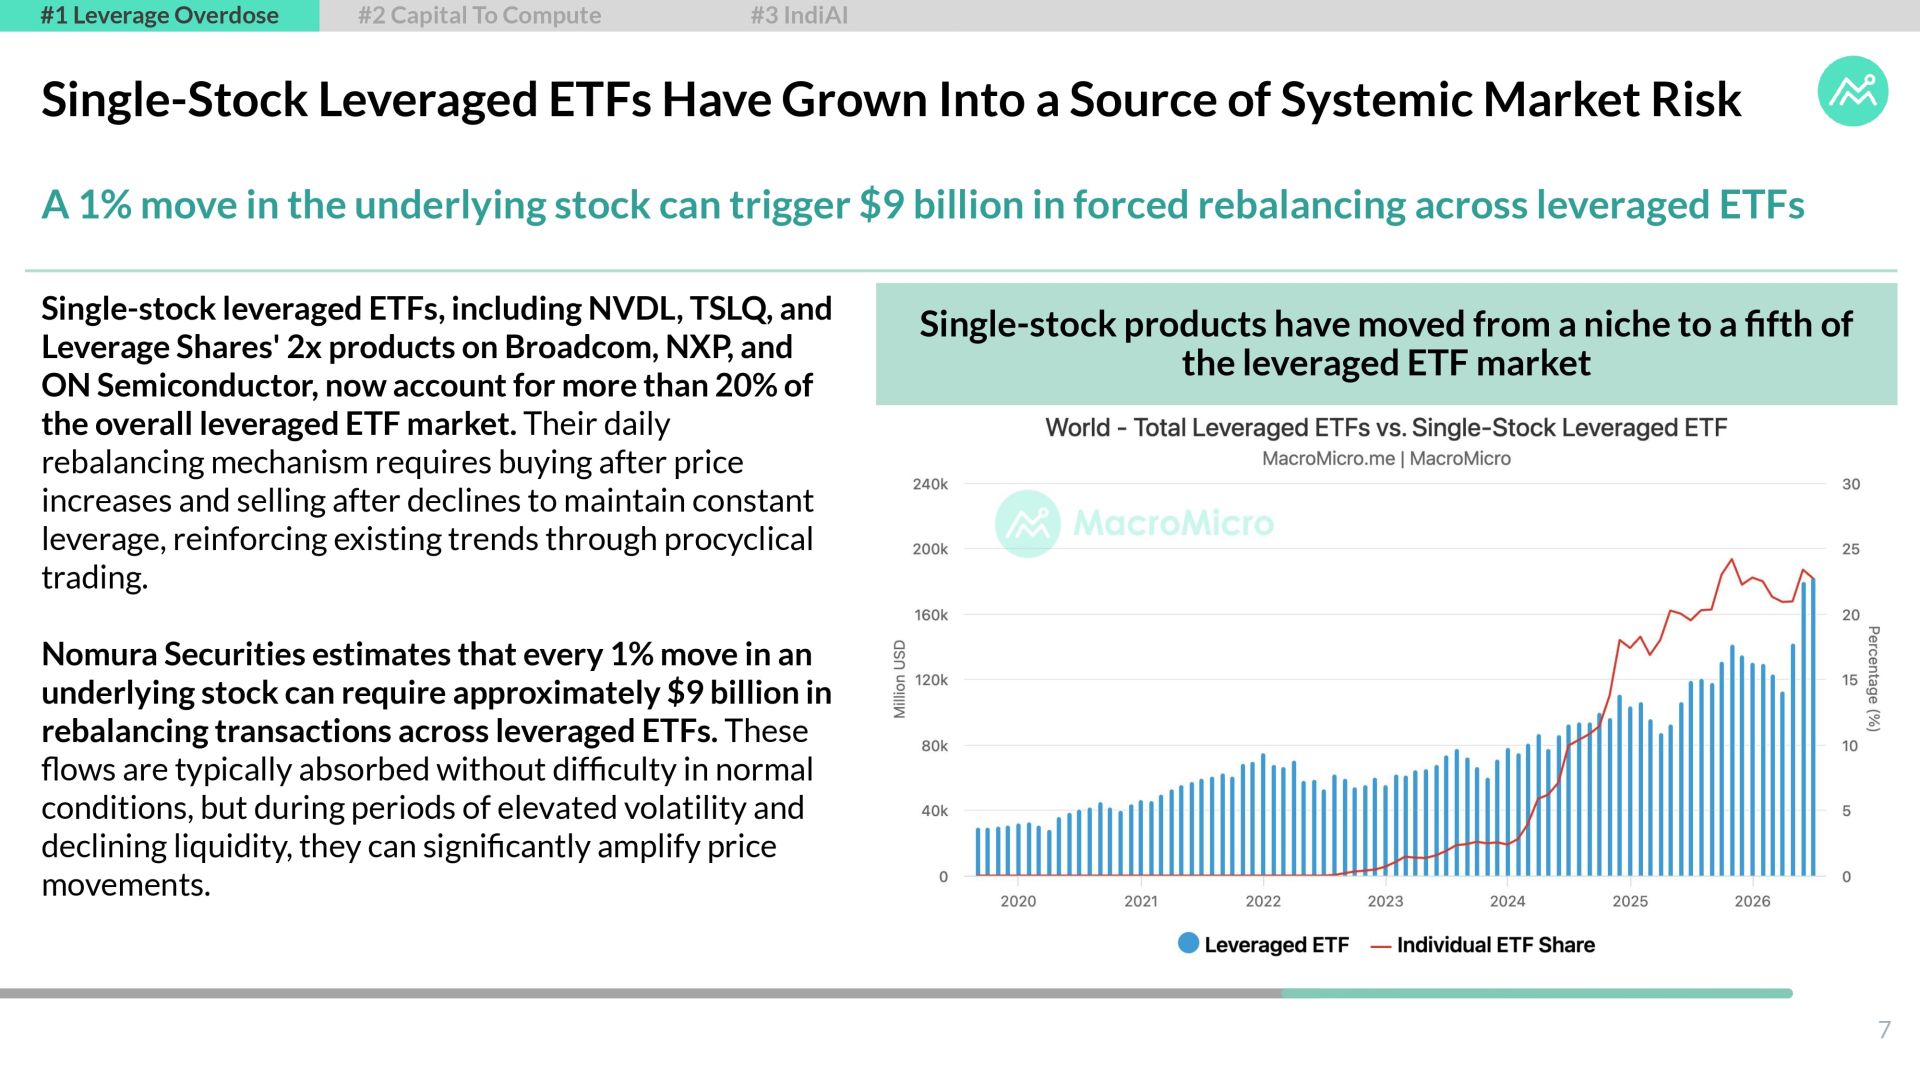
South Korea's Leveraged ETF Boom Has Become a Regulatory Liability: The May 27 approval of 16 single-stock 2x ETFs tied to Samsung and SK Hynix generated KRW 212 trillion in June trading volume alone, and Nomura estimates a 1% move in the underlying stock can now trigger $9 billion in forced rebalancing. The Bank of Korea has flagged the procyclical mechanism directly, and the FSS governor has said he regrets approving the products. Whether a seventh circuit breaker arrives in H2 is now the clearest test of whether this risk is contained or still building.
-
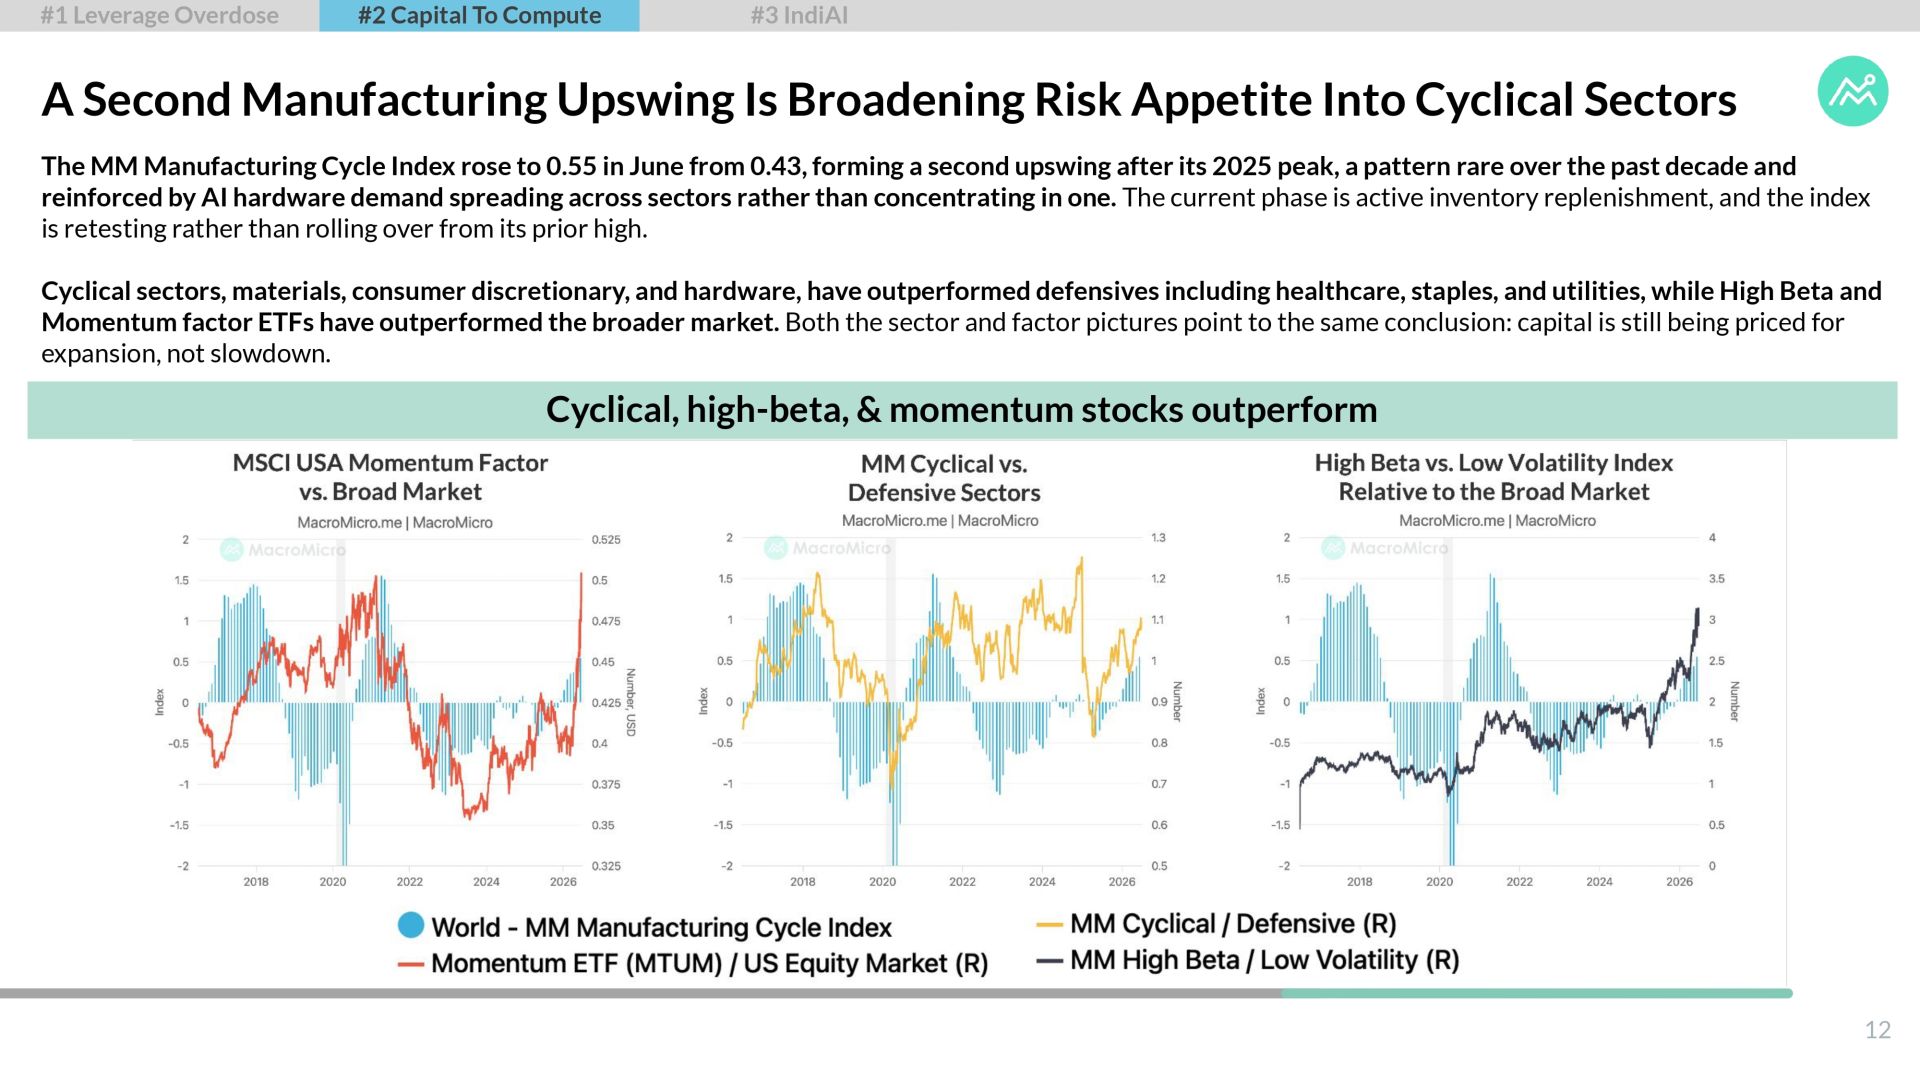
Capital Is Rotating From AI Spenders to AI Earners: The FAANMG Index has fallen roughly 14% from its peak as combined hyperscaler free cash flow declines under capex pressure, while suppliers of servers, cooling, and power equipment see cash flow expand sharply. Free Cash Flow and Quality factor ETFs have outperformed the broader market in H1, and a second manufacturing cycle upswing is broadening risk appetite into cyclicals rather than signaling a slowdown. The AI trade hasn't cooled: it's moved down the supply chain.
-
India's AI Case Rests on Execution, Not Recent Price Action: India's SENSEX remains negative year to date even after a one-month bounce, while Korea has returned 95% and Taiwan 58%. The divergence traces to Korea's instability, not capital rotating into India on fundamentals. India's real edge is structural: data center power costs of 8 cents/kWh undercut every developed market, and Q1 FDI grew 21.6% YoY despite the equity lag. The binding constraint is transformer and grid-equipment supply, where domestic shortages have already forced exemptions for Chinese manufacturers; the variable to watch over the next two to three quarters.
About Weekly Economic and Financial Commentary (WEFC)
The MacroMicro WEFC is published weekly, delivering rigorous analysis and in-depth insights on the most critical market-moving events. Coverage spans equities, foreign exchange, bonds, commodities, global central banks, geopolitics, and the international political economy. At its core is a concise, roughly 20-page Chart Pack designed to help you grasp market trends at a glance.
WEFC Feedback Survey
We value your input! Your feedback helps us enhance our WEFC to better meet your needs. Please take a moment to share your thoughts. Thank you for being a valued reader!
