Executive Summary:
Is the bond selloff the Revenge of the Bond Vigilantes, i.e., a looming debt crisis? Not yet. Despite the recent surge, the 10-year Treasury yield remains below the growth rate of nominal GDP. That points toward an upward repricing of the neutral interest rate. Ed and Elias examine the spectrum of forces behind higher yields, from rising R* to a potential debt-crisis scenario. The real warning sign would be if the yield rises above nominal GDP growth. In addition, they consider two other spectrum scenarios: the war in the Middle East and the yen-carry trade. … Also: The latest labor market data suggest resilient but noninflationary strength… Check out our chart collection.
Bonds I: All the Above
A spectrum of forces from benign to troublesome is pushing US bond yields higher.
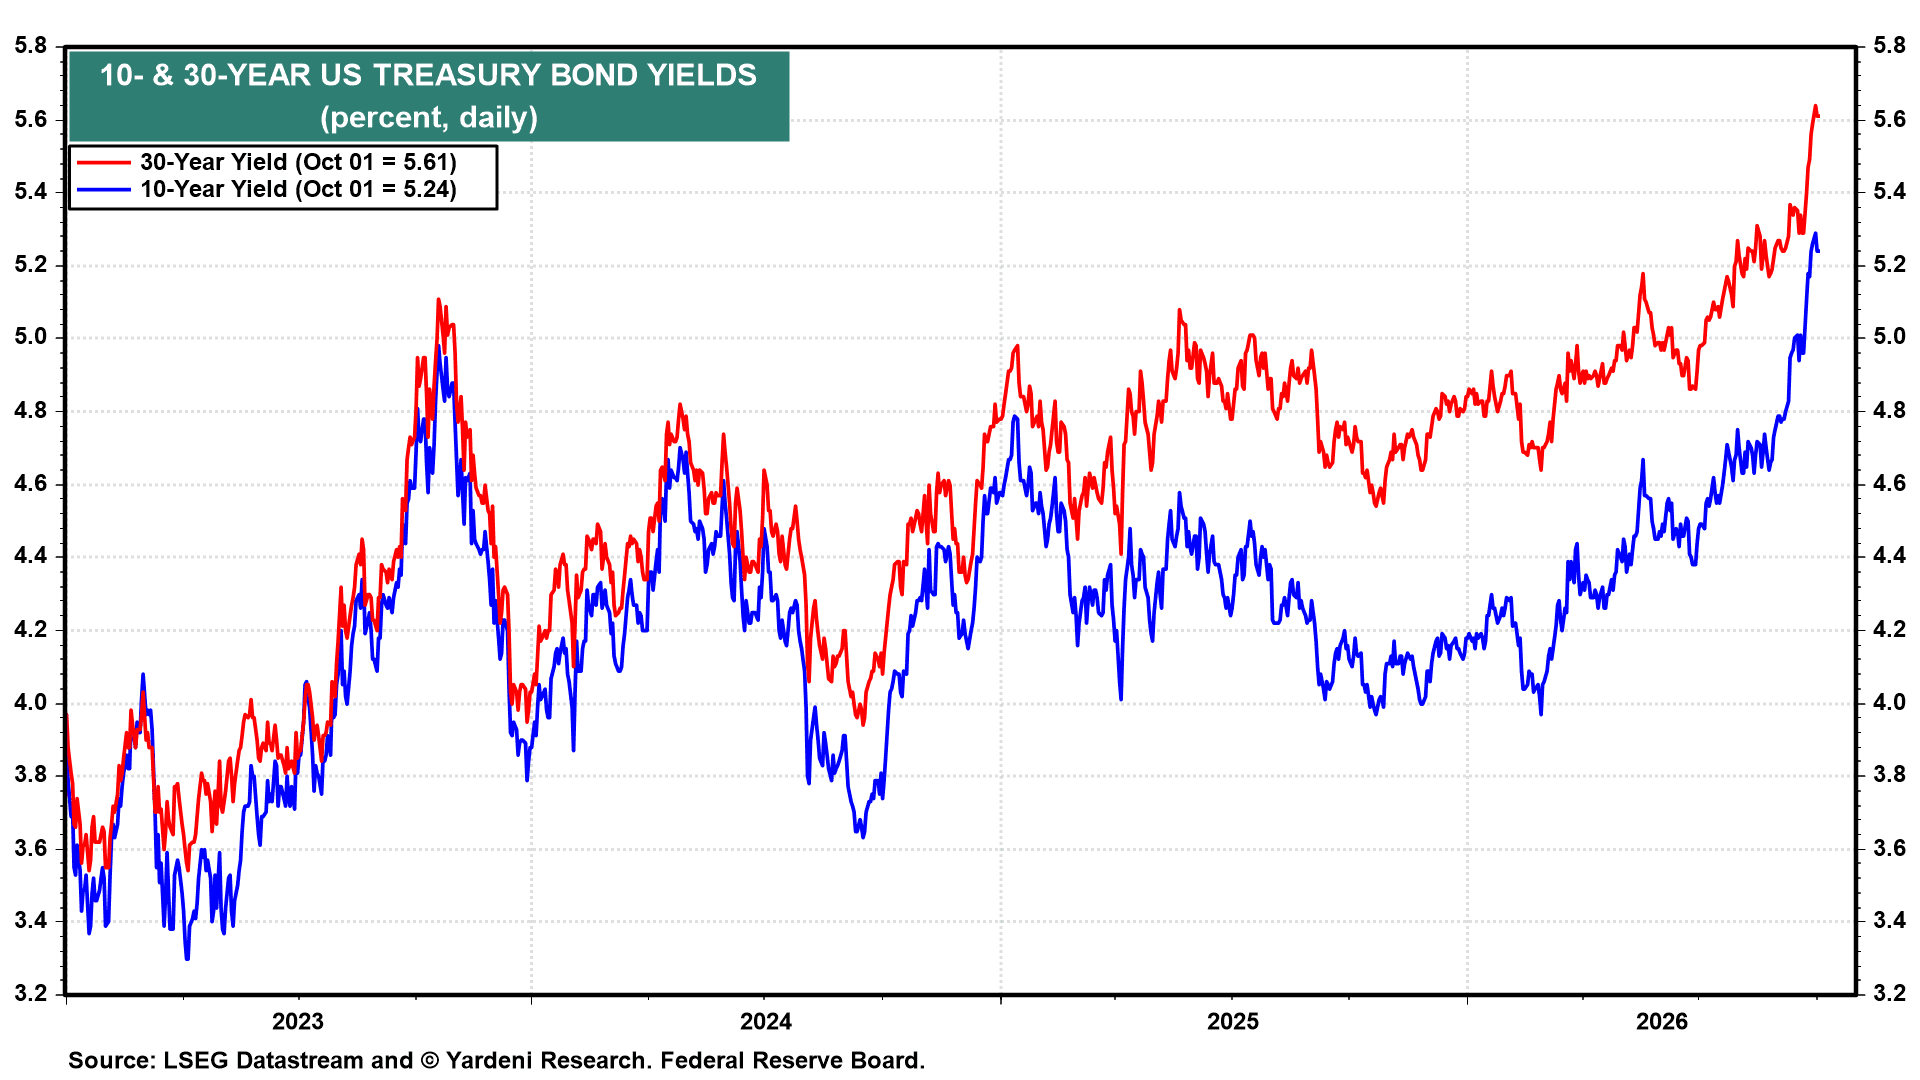 ▌View Related Live Charts: US - Treasury Yields vs. Fed Funds Rate
At the least concerning end of the spectrum is a higher “neutral” interest rate (as mentioned in our September 28 Morning Briefing), a function of stronger economic growth and demand for financial capital. A higher neutral rate means the economy can function just fine with a higher federal funds rate (FFR) and yield curve. At the other end of the spectrum is the debt-crisis scenario: Mounting fiscal deficit and debt concerns raise yields. There are two other important scenarios in between on the spectrum, i.e., the Middle East energy shock and the unwinding of the yen-carry trade. Let’s examine these four spectrum scenarios and their consequences:
(1) Rising R-star: the benign yield hiker. R-star (R), or the “neutral” rate, is the real interest rate that is consistent with low unemployment and price stability. It balances the demand for capital with the supply of savings, leaving monetary conditions neither stimulative nor restrictive. It’s a theoretical rate that’s hard to pin down. Nevertheless, three forces appear to be pushing R higher:
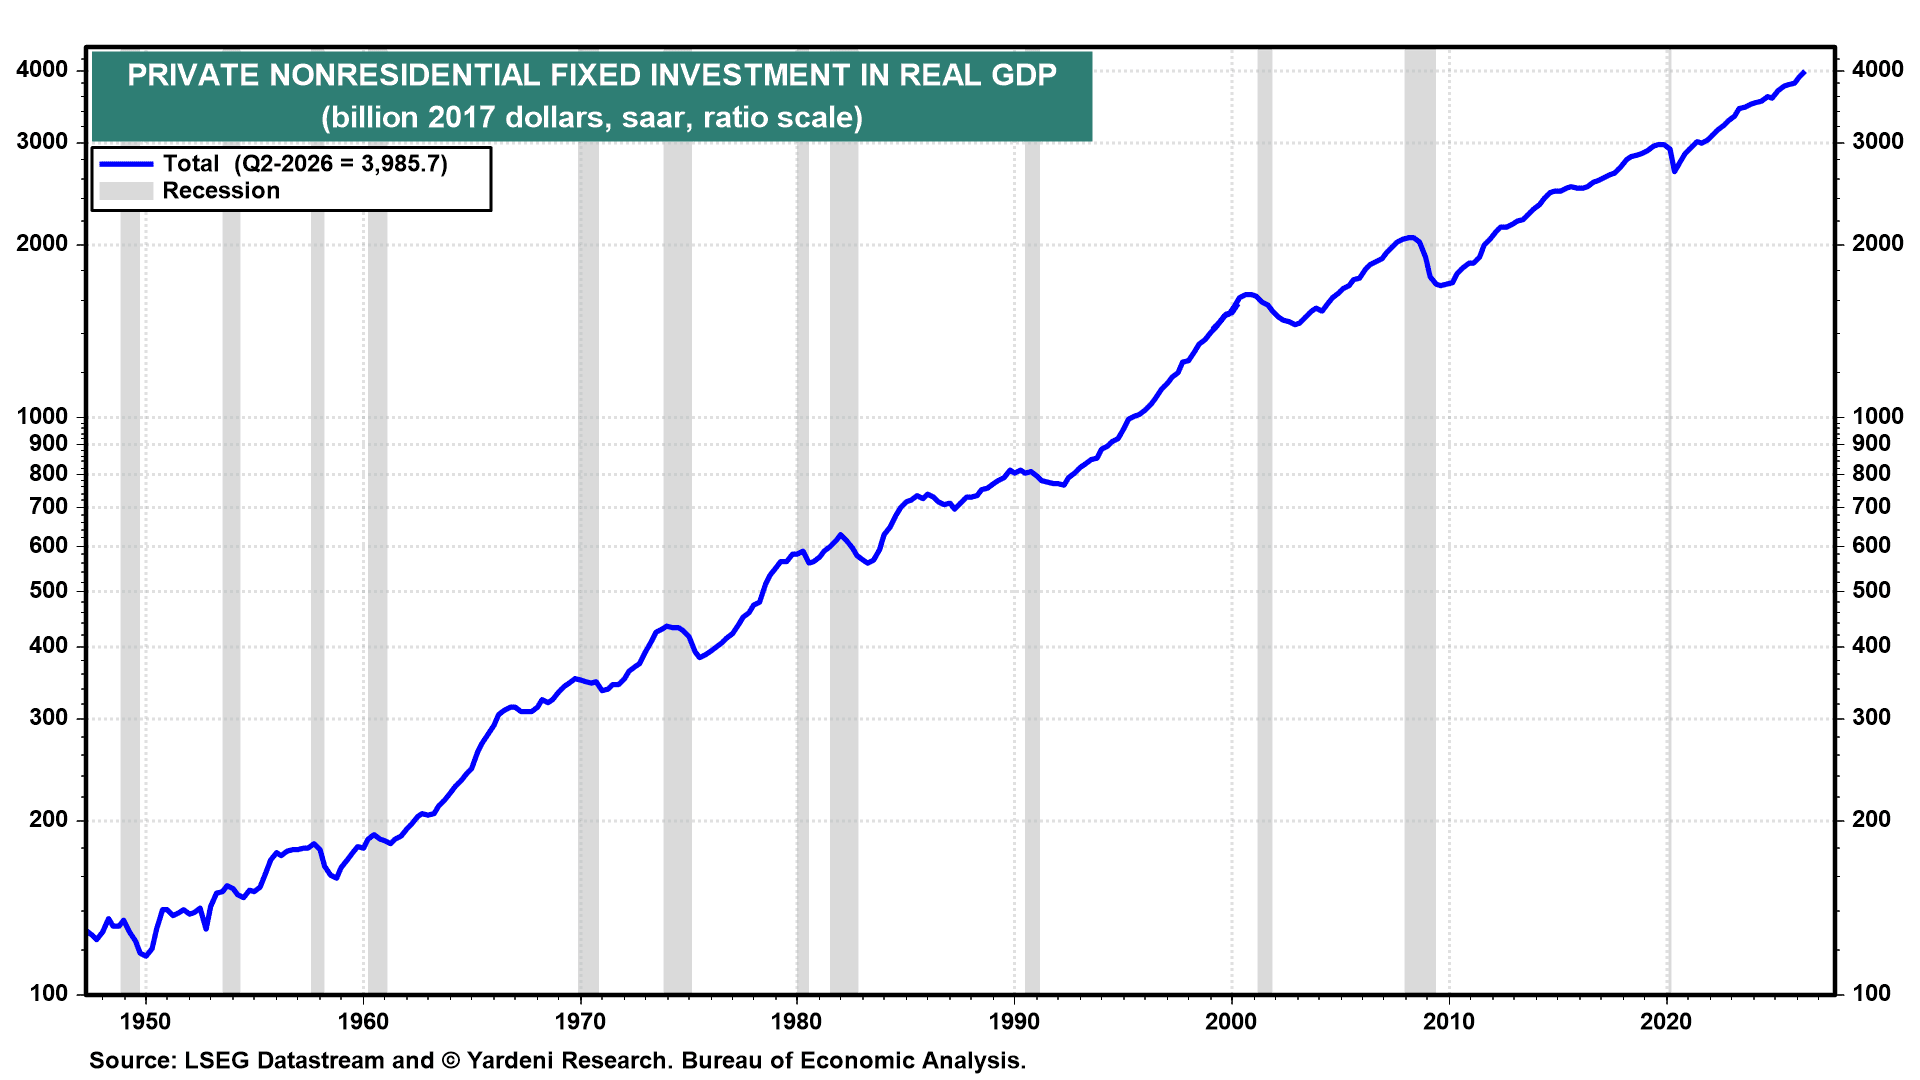
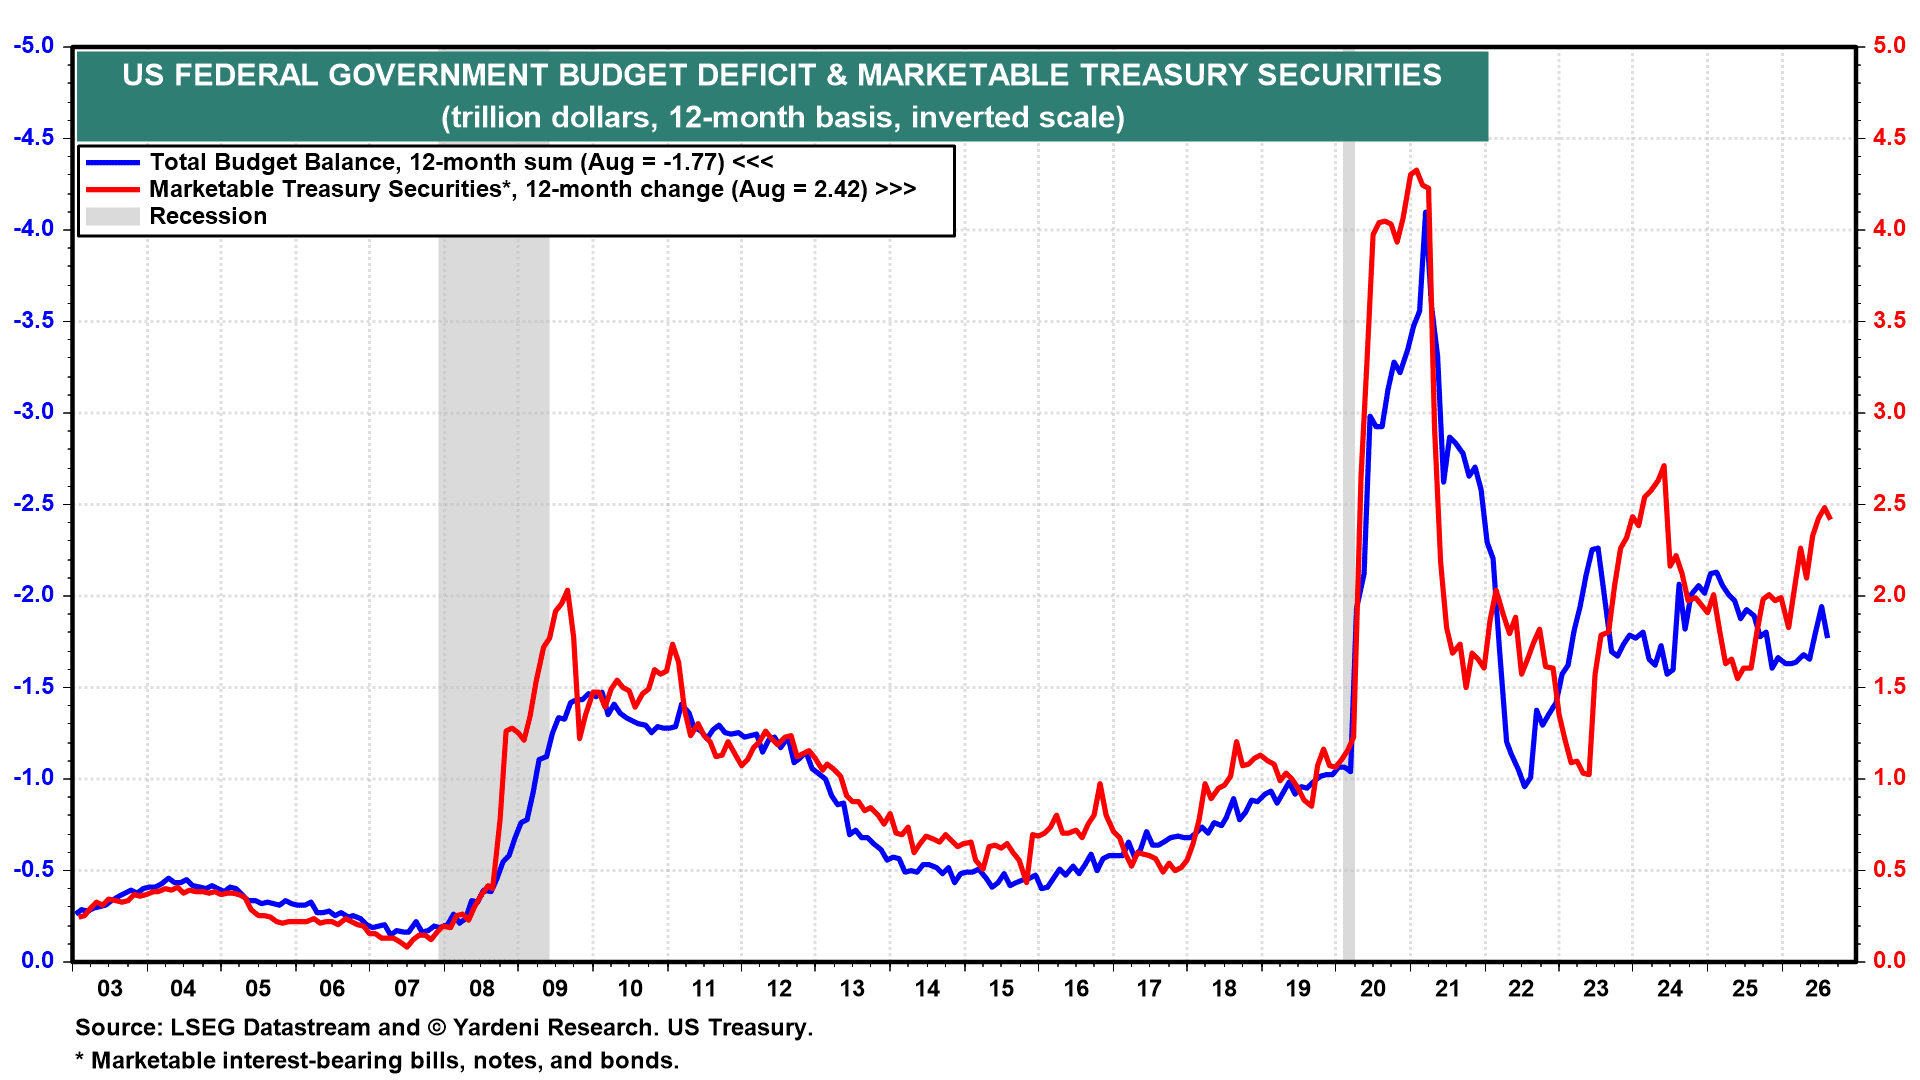
- Demand for financing booming capital spending is exceptionally strong. Real private nonresidential fixed investment rose by 9.0% (saar) in Q2 after surging 10.6% in Q1. AI is driving the enormous wave of capital spending: Hyperscalers are expected to spend roughly $750-$800 billion on capex this year and $1.2 trillion next. Washington is adding to the demand for funds as well, with the Treasury raising $2.4 trillion over the past 12 months through August.
 ▌View Related Live Charts: US - Real GDP Growth by Component (SAAR)
 ▌View Related Live Charts: US - Federal Total Public Debt (% of GDP) vs. Treasury Yield Minus GDP Growth
- National savings faces growing headwinds. Personal savings fell to $990.2 billion (saar) in September, the lowest since December 2022. Demographics are one reason: As...
Already a subscriber? Click here to log in.
Full Access to Our Services

Comprehensive data at your service
with key indicators for investment insights

Exclusive flash reports
on key events and data

Create your own charts and analysis
including performance backtesting

Hub of professionals to engage
in meaningful discussions and insights
 Get answers from MM AI.
-
What forces are driving US bond yields higher across the spectrum?
💡US bond yields are being driven higher by a spectrum of forces, ranging from benign to troublesome. These include a rising 'neutral' interest rate (R-star) due to stronger economic growth and demand for capital, the potential for an energy shock from higher-for-longer oil prices, the unwinding of the yen-carry trade, and at the most worrisome end, the danger of a debt crisis. The current bond selloff is not yet considered the 'Revenge of the Bond Vigilantes' because the 10-year Treasury yield remains below the growth rate of nominal GDP, suggesting an upward repricing of the neutral interest rate as the dominant driver.
-
How does a rising R-star impact US bond yields?
💡A rising R-star, or neutral rate, impacts US bond yields by signaling that the economy can sustain higher interest rates without becoming restrictive. This theoretical real interest rate, consistent with low unemployment and price stability, is increasing due to strong demand for financing, particularly from booming capital spending driven by AI, and growing headwinds to national savings like falling personal savings and Baby Boomer retirements. Evidence suggests R-star has already moved higher, with the economy remaining robust despite aggressive Fed tightening, leading the bond market to reprice the neutral rate upward and keep long-term yields elevated.
-
What role does AI-driven capital spending play in increasing demand for financing?
💡AI-driven capital spending plays a significant role in increasing the demand for financing, pushing R-star higher. Real private nonresidential fixed investment surged by 10.6% in Q1 and 9.0% in Q2, with hyperscalers projected to spend $750-$800 billion on capex this year and $1.2 trillion next, largely fueled by AI. This massive wave of capital expenditure, combined with Washington's demand for funds—raising $2.4 trillion over the past 12 months through August—creates exceptionally strong demand for financial capital, contributing to the upward pressure on bond yields.
-
How does stronger productivity growth contribute to higher real GDP and R-star?
💡Stronger productivity growth contributes to higher real GDP and R-star by enhancing the economy's capacity for non-inflationary growth. As AI adoption spreads, it is expected to raise returns on capital invested, leading to increased productivity. This improvement in efficiency allows for greater economic output without necessarily increasing inflation, thereby lifting the equilibrium real interest rate (R-star) and supporting a higher rate of real GDP growth. The September jobs report suggests solid productivity growth in Q3, with real GDP expected to rise 3.7% (saar) while aggregate hours worked increased only 1.2%.
-
How might sustained higher oil prices affect inflation and Fed interest rate decisions?
💡Sustained higher oil prices could significantly affect inflation and prompt the Fed to raise interest rates more aggressively. Since the war began, Brent crude oil has risen from roughly $72 to $102 per barrel, and US diesel prices climbed from $3.81 to about $6.50 per gallon. If this trend of higher input costs persists, it increases the risk of more persistent inflation across the economy. Such inflationary pressures would likely compel the Federal Reserve to adopt a more hawkish monetary policy, including further interest rate hikes, to bring inflation back to its target.
-
How does the unwinding of the yen-carry trade impact global bond yields?
💡The unwinding of the yen-carry trade impacts global bond yields by forcing investors to sell foreign bonds and buy back yen, thereby exerting upward pressure on yields. This trade, long reliant on ultra-low Japanese interest rates, is cracking as the BOJ has raised its policy rate to 1.25% with further hikes expected, and the yen has become more volatile. These factors reduce the interest-rate advantage and increase currency risk, prompting investors to liquidate their foreign assets, including US bonds, to repay yen-denominated loans, consequently driving up global bond yields.
-
What is the primary driver of the recent rise in US bond yields?
💡The primary driver of the recent rise in US bond yields is the repricing of the bond market to a higher neutral interest rate (R-star) as the economy continues to demonstrate better-than-expected growth. This reassessment suggests that the rate consistent with sustainable growth and stable inflation is higher than previously perceived. While other factors like energy shocks, the yen-carry trade unwinding, and debt crisis concerns contribute to the spectrum of forces, the dominant influence is the market's adjustment to the economy's robust performance despite aggressive Federal Reserve tightening.
-
How did US labor market demand evolve in September?
💡US labor market demand in September showed resilient but less broad-based growth. The economy added 29,000 jobs, falling short of the 84,000 consensus estimate, and prior months' growth was revised down by 60,000. Despite this, the three-month average job creation remained robust at approximately 50,000. Household employment surged by 975,000 over two months, the largest increase since February 2025. Job gains were concentrated in health care, leisure & hospitality, manufacturing, and construction, with the one-month diffusion index falling to 49%, but the three-month index improving to 57.0%.
-
What structural factors constrain US labor supply?
💡Two key structural factors constrain US labor supply: the ongoing retirement of Baby Boomers and a declining foreign-born labor force. The labor-force participation rate for those 65 and older dropped to 18.4%, with seniors now comprising a record 51% of Americans outside the labor force. Simultaneously, the foreign-born labor force has continued to decrease. Despite the civilian labor force expanding by 485,000 in September, these demographic shifts contribute to a shrinking labor force on a year-over-year basis, which fell by 0.6%, posing persistent headwinds to overall labor supply.
-
How balanced are US labor supply and demand currently?
💡US labor supply and demand are almost perfectly balanced currently, with labor supply at 170.3 million and estimated labor demand at 170.2 million in September, based on a framework by former Fed Chair Jerome Powell. This near equilibrium helps explain the subdued wage growth, as average hourly earnings rose by only 0.1% month-over-month and 3.0% year-over-year, the smallest annual increase since May 2021. The unemployment rate inched up to 4.2%, largely due to more people joining the labor force, while the broader U-6 rate dropped to 7.6%, its lowest since January 2025.
