Executive Summary:
The Fed’s monetary policy mandate requires consideration of both inflation and labor market conditions. If the former compels a rate hike next month, would the latter stand in the way? That’s the question of the hour after last week’s jobs report, with a headline that telegraphed “weakness.” Elias and Ed argue that the headline numbers looked deceptively weak because of calendar effects and World Cup related distortions. Indeed, most industries posted job gains. In short, the labor market is well balanced. So, no, it shouldn’t stand in the way of the Fed’s tightening in September … Check out the accompanying chart collection.
US Labor Market I: Stable Enough for Fed Tightening?
The July jobs report was the most consequential economic release of last week. What did it reveal about the health of the US labor market, and does it alter the outlook for monetary policy?
To answer those questions, it is useful to revisit the two scenarios outlined in the June FOMC meeting minutes. In the first, inflation gradually returns to the Fed’s 2.0% y/y target as underlying price pressures fade, causing policymakers to keep rates unchanged or eventually begin lowering them. In the second, inflation remains elevated, driven by factors such as tariffs, elevated energy prices, and the ongoing AI investment boom. Additionally, the labor market remains in balance. Under that scenario, policymakers noted that additional policy tightening could be warranted to ensure inflation returns to target.
Our focus today is on the second scenario. Does the July employment report, together with the broader set of labor market indicators released during the month, suggest that the labor market remains sufficiently in balance at full employment to satisfy one of the key conditions for further policy tightening? Or does the evidence point to a labor market that is losing momentum—removing an important tightening prerequisite, that the labor market is securely stable.
The initial reaction of the yield curve to the jobs report on Friday was to fall across the board. But then interest rates recovered about half their losses by the end of the day. That’s consistent with our conclusion that the report didn’t change much about the outlook for the economy and monetary policy.
US Labor Market II: Payrolls Better Than Headline Suggests
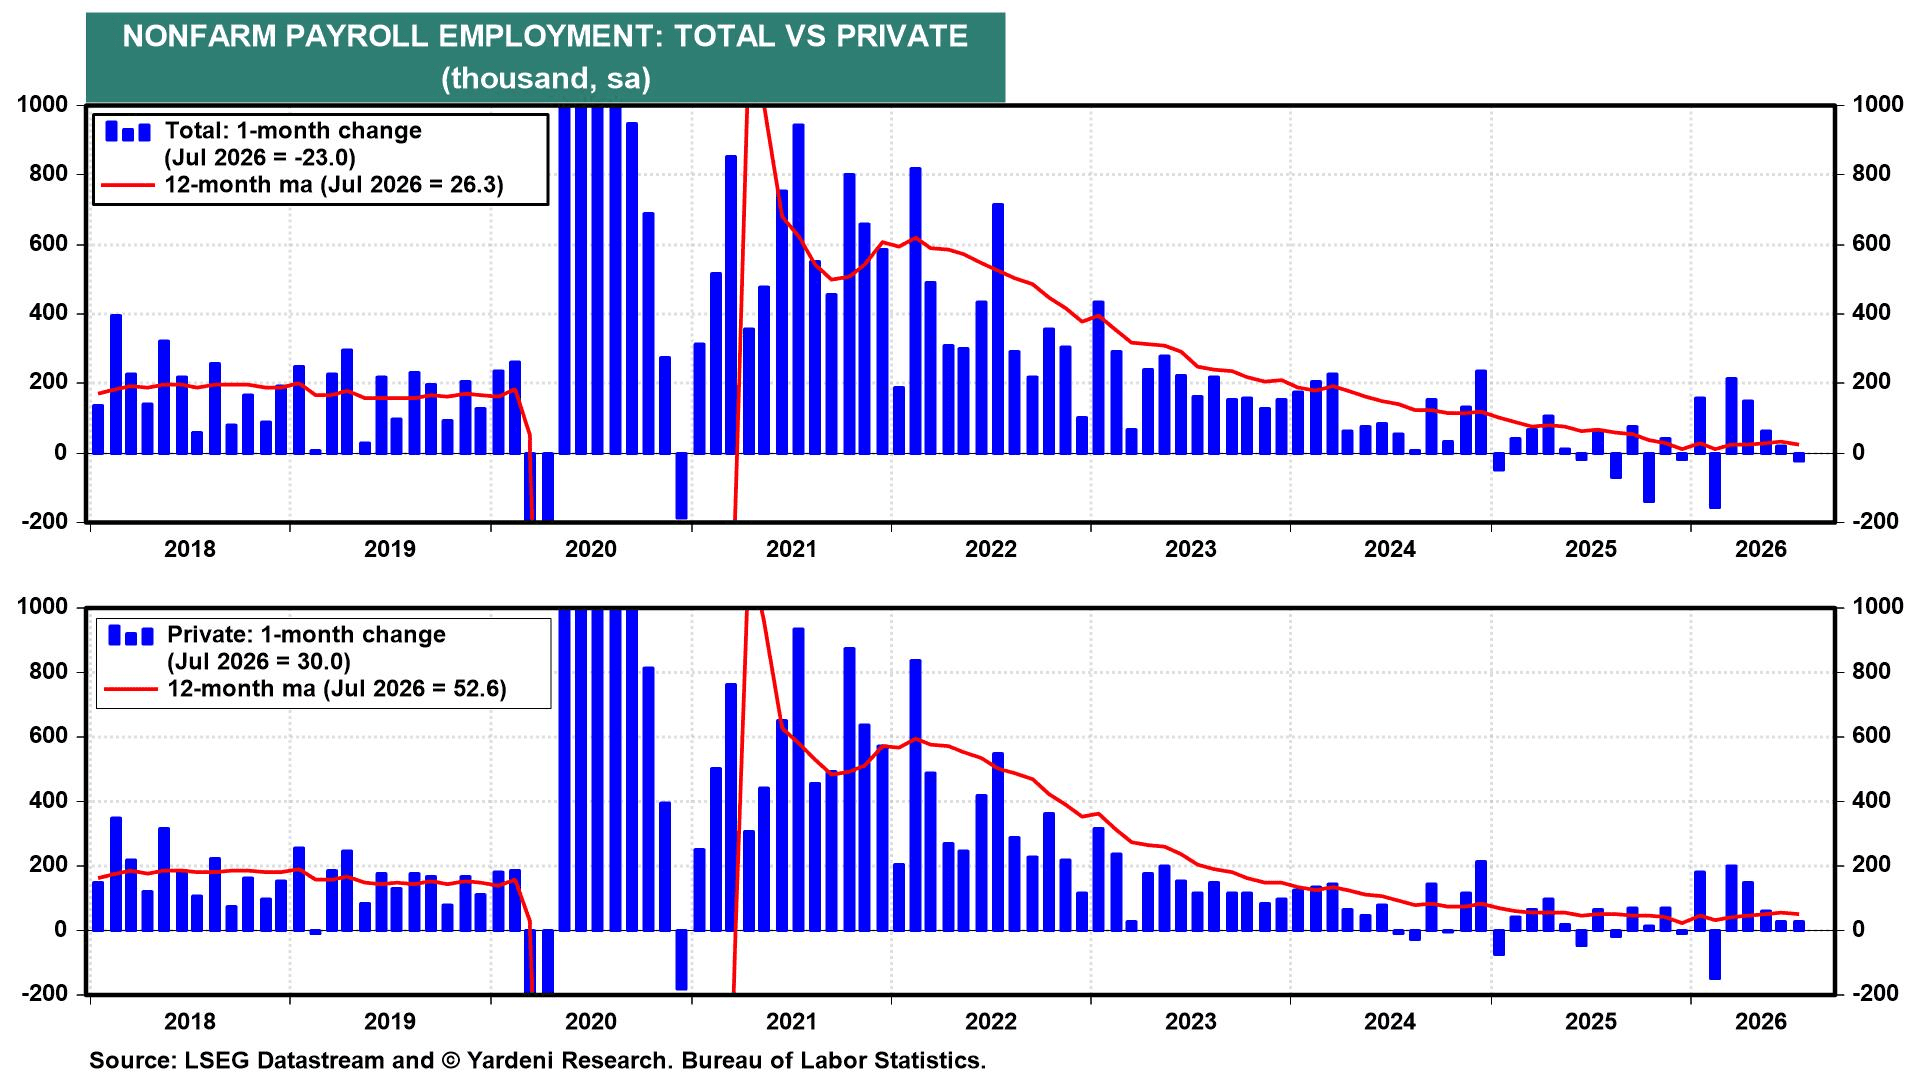
According to the July employment report, total nonfarm payrolls fell by 23,000 after rising 20,000 in June.
 ▌View Related Live Charts: US - Nonfarm Payrolls vs. Unemployment Rate
Payroll gains for May and June were revised down by a combined 103,000. At first glance, that looks troubling, but not when one digs deeper: Two unusual distortions pulled the headline lower:
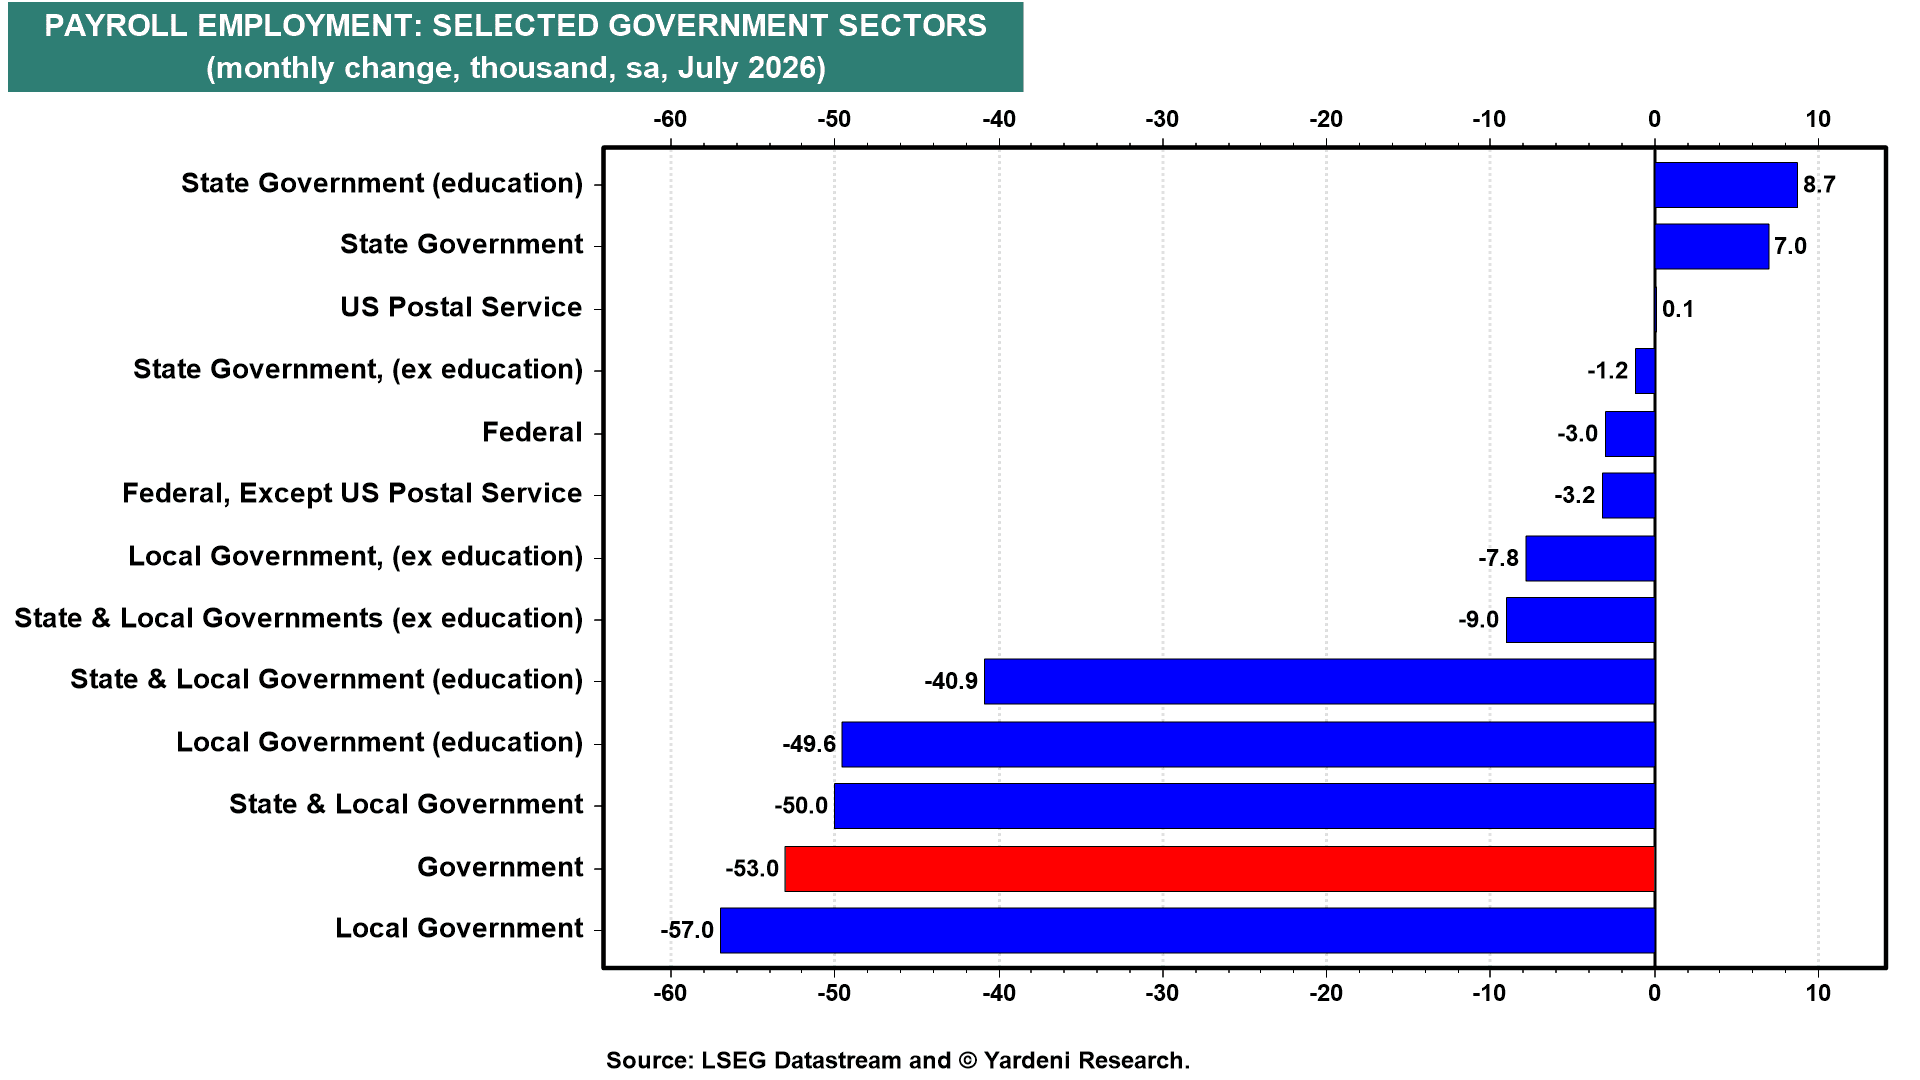
(1) Calendar effects exaggerated the decline in government payrolls. Local government payrolls plunged by 57,000, the largest monthly decline since October 2021.
 ▌View Related Live Charts: US - Nonfarm Payrolls by Sector (Monthly Change)
Local government education employment fell 49,600. The drop reflects a five-week gap between the June and July survey periods—instead of the usual four. This extended window allowed an unusually large number of routine summer school contract expirations to occur before the July cutoff. Much of that decline should reverse as school districts resume seasonal hiring for the new academic year.
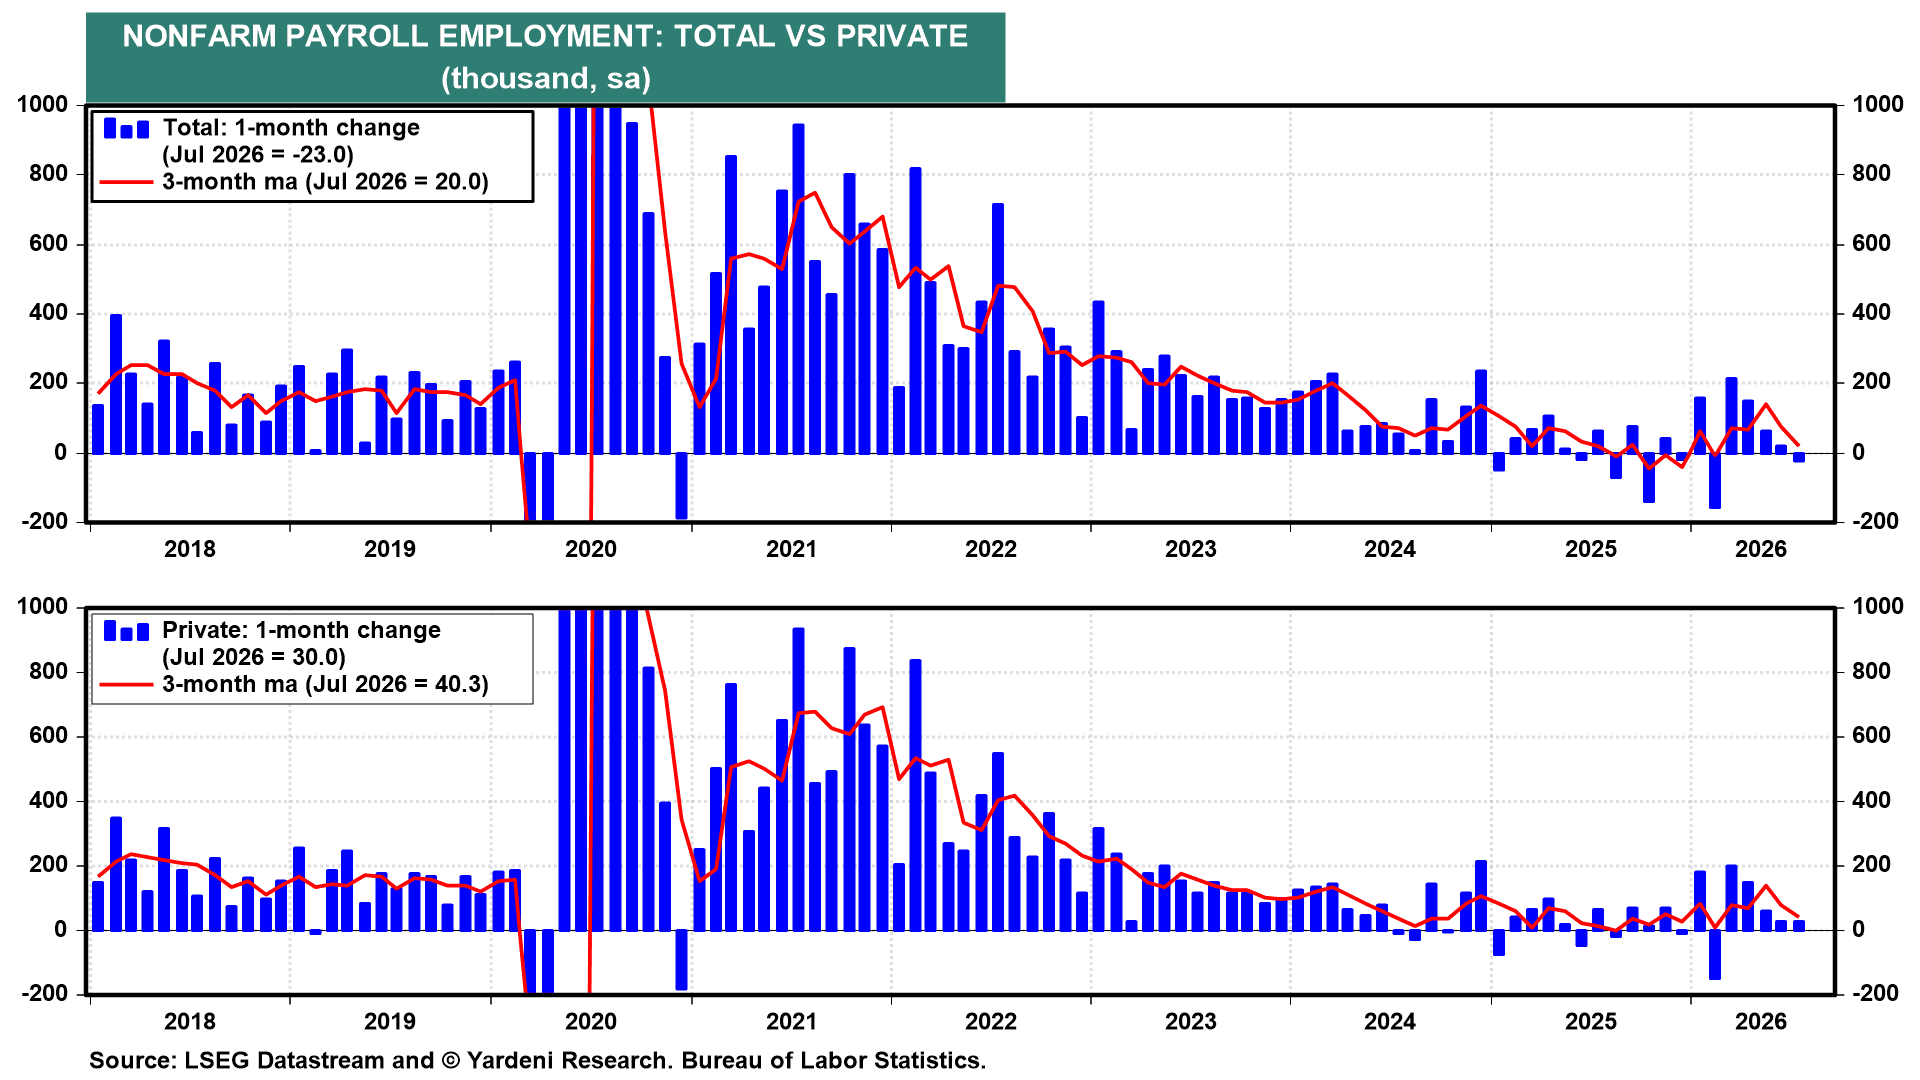
(2) Private-sector employment rose, but World Cup-related distortions clouded the strength. Excluding government, private payrolls rose by 30,000, matching June’s gain.
 ▌View Related Live Charts: US - Nonfarm Payrolls vs. Unemployment Rate
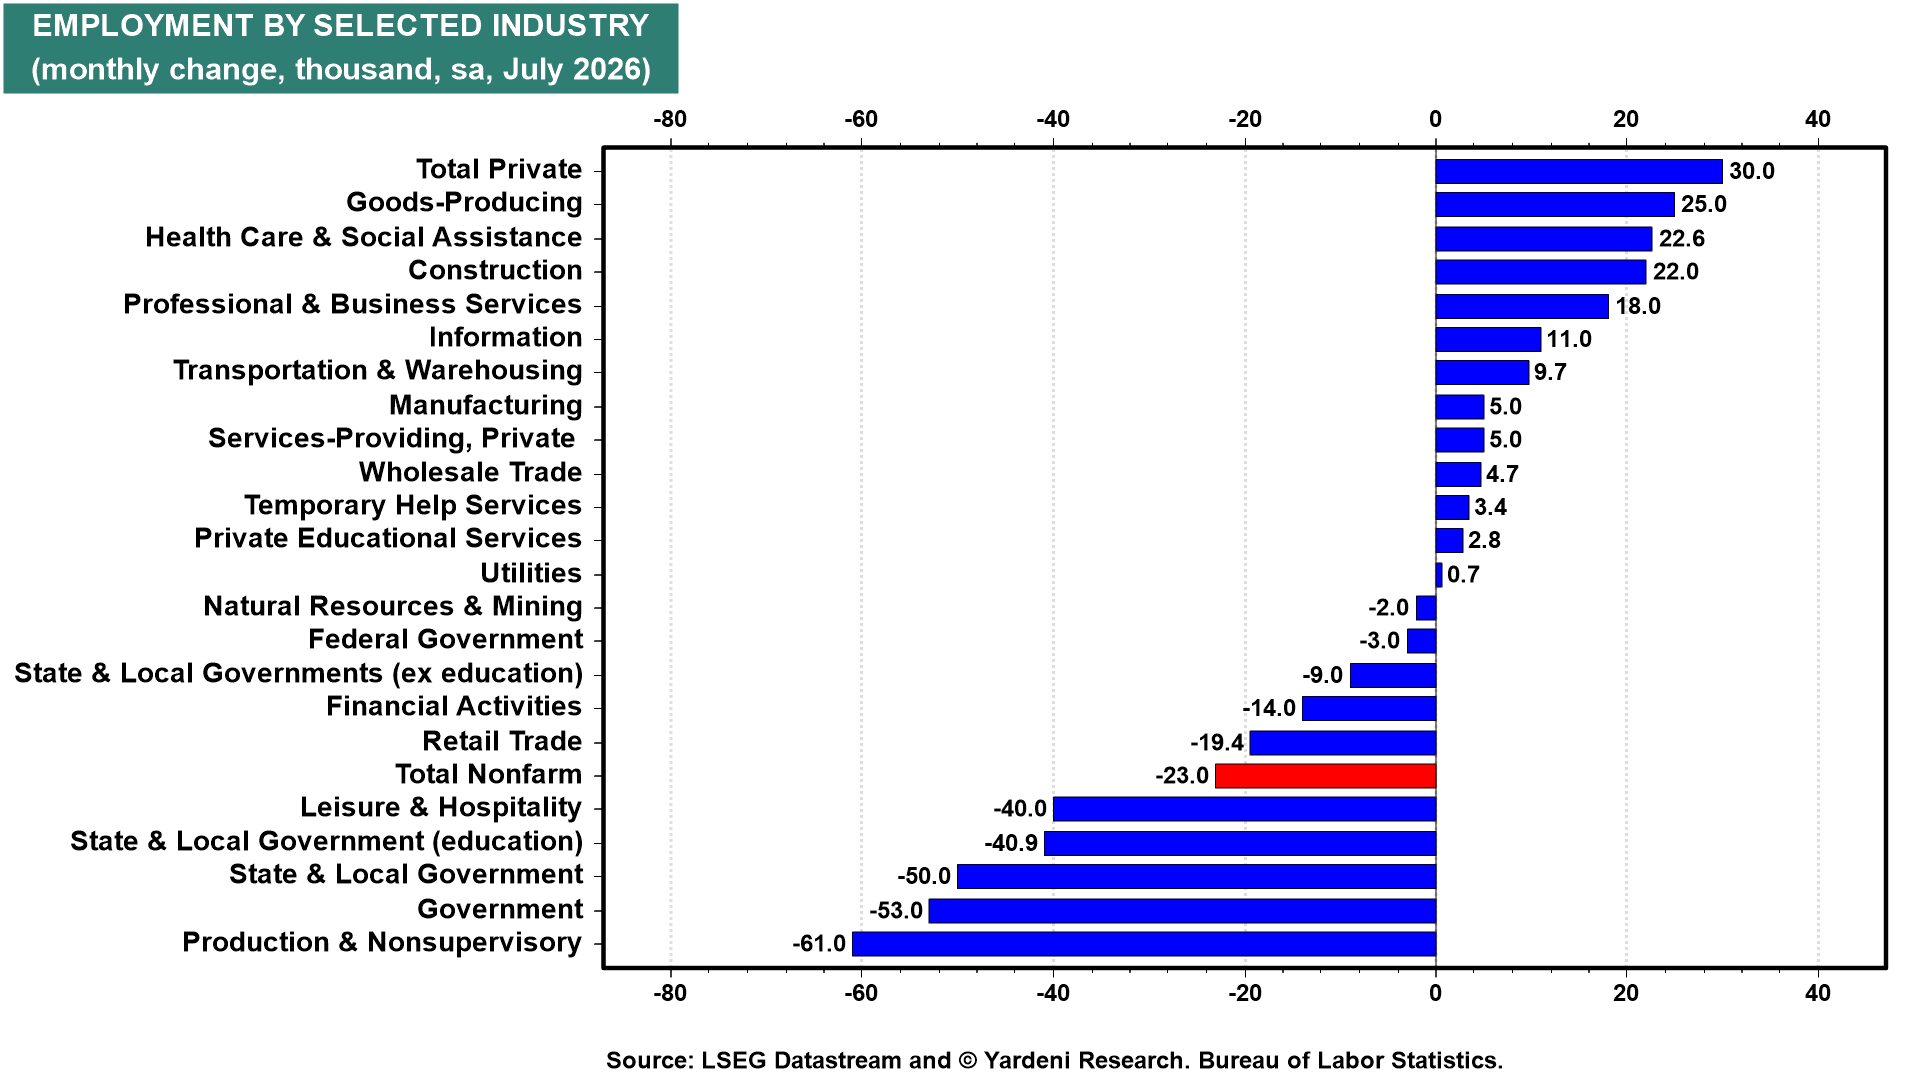
Leisure & Hospitality lost 40,000 jobs, Retail Trade lost 19,000, and Financial Activities lost 14,000.
 ▌View Related Live Charts: US - Nonfarm Payrolls by Sector (Monthly Change)
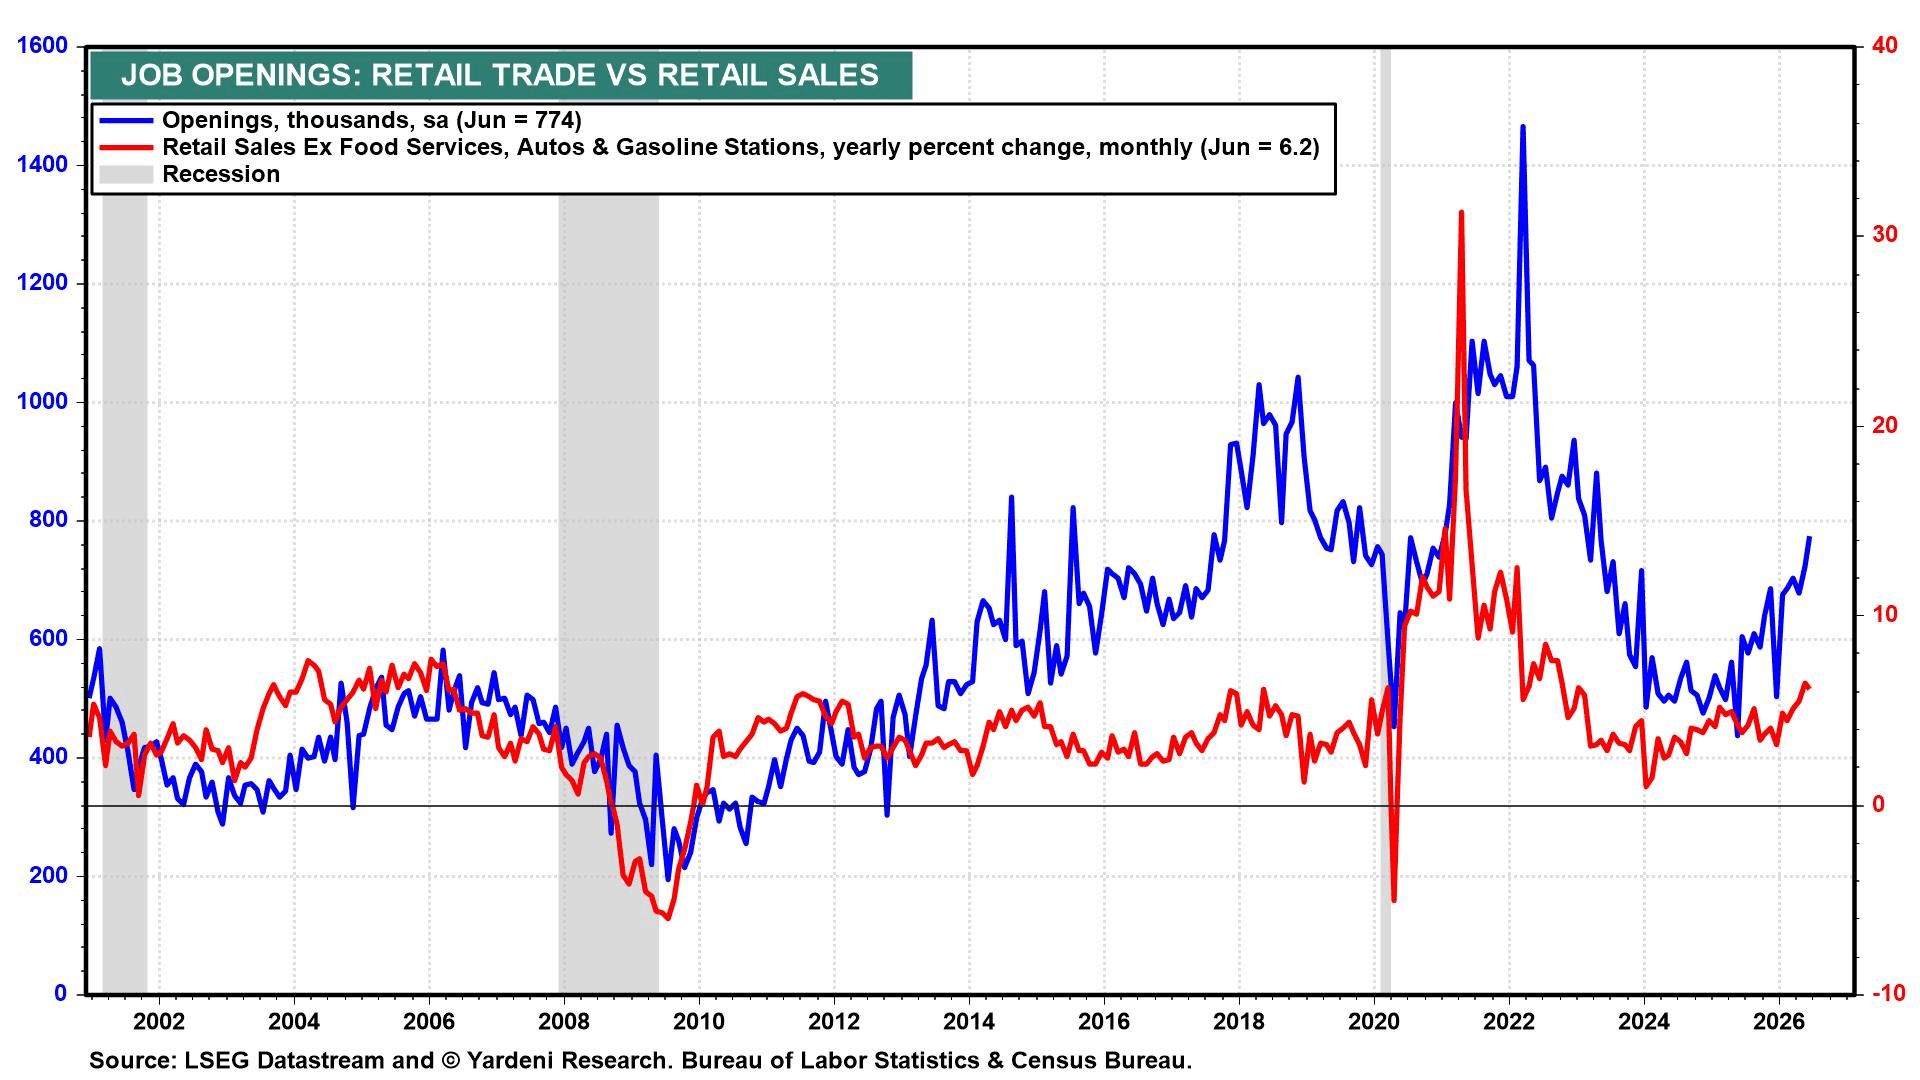
The weakness in the first two industries was likely exaggerated by post-World Cup seasonal adjustments. Employers front-loaded hiring during the spring to prepare for the tournament. When the usual July hiring pattern failed to appear, the seasonal-adjustment process converted the shortfall into reported job losses. Job openings in Retail Trade rose in June to the highest reading since mid-2023.
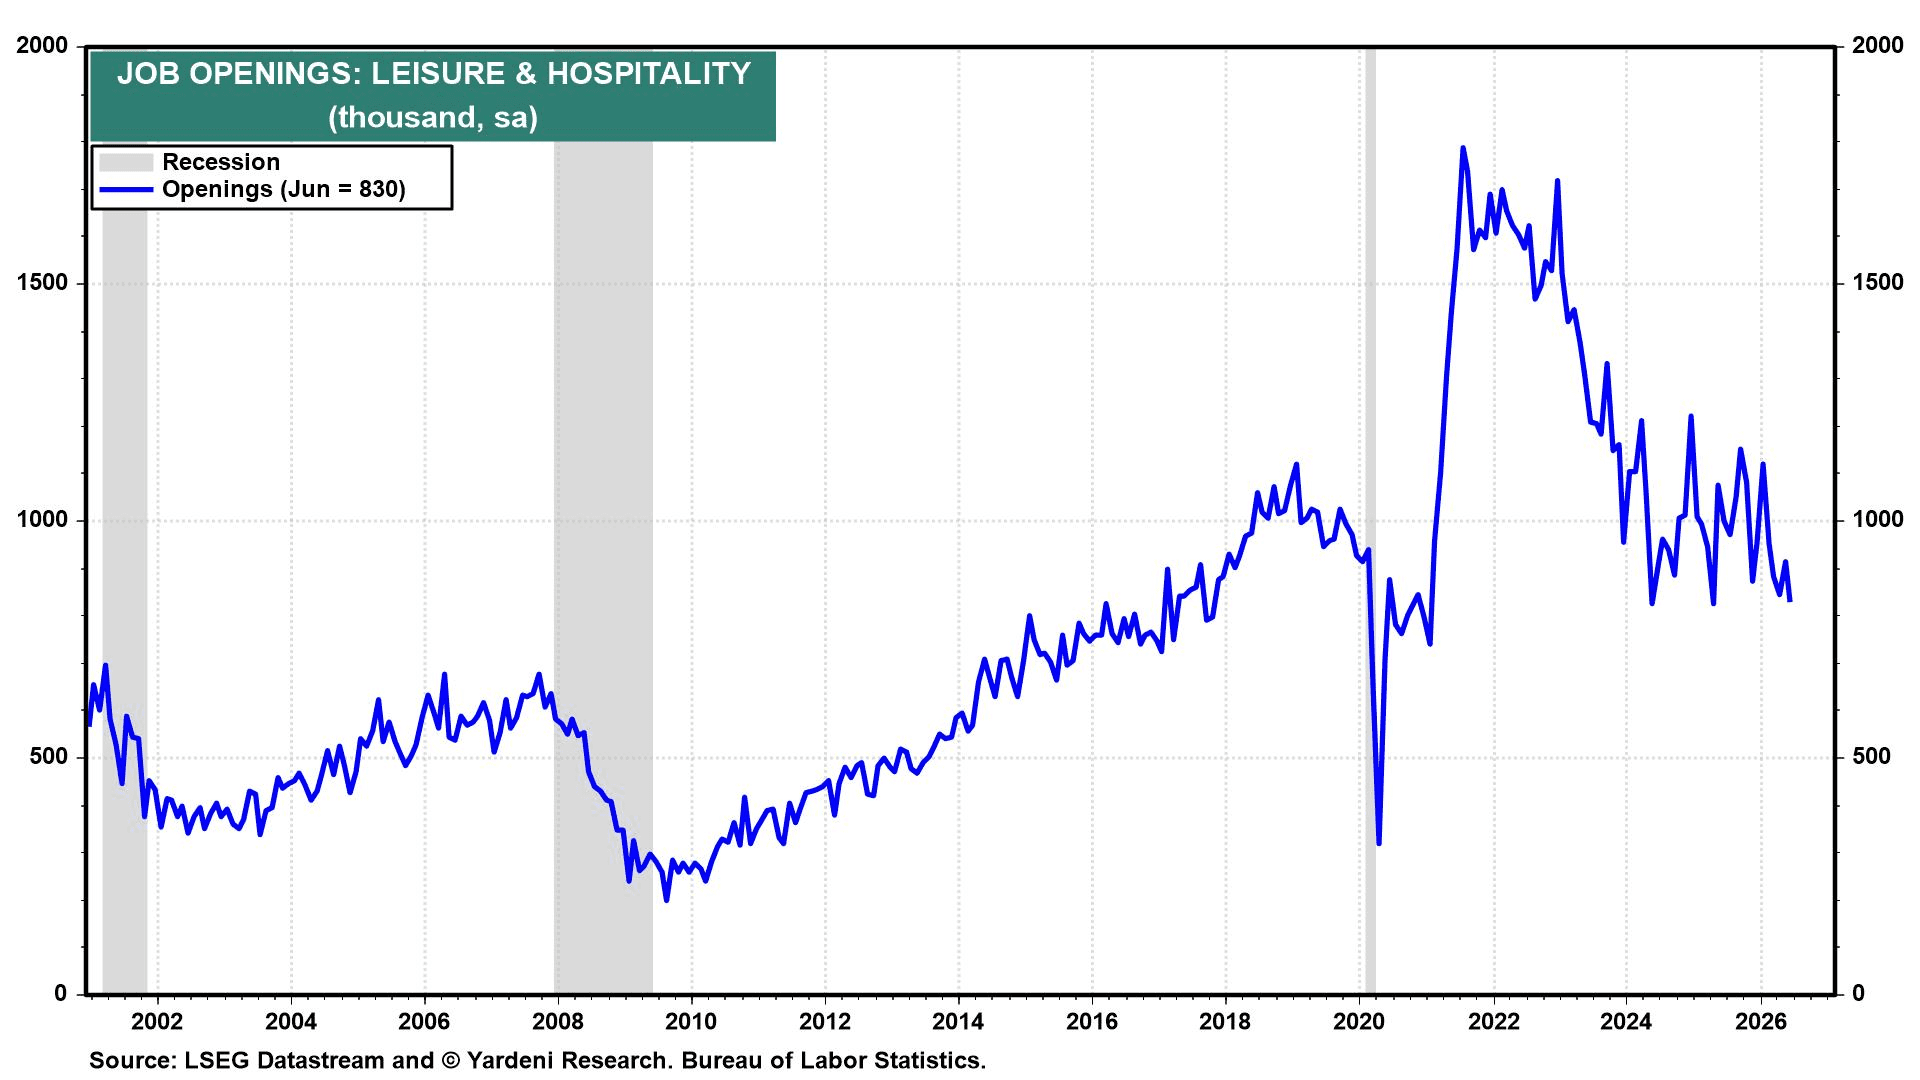
Job openings in Leisure & Hospitality have been hovering around pre-pandemic highs.
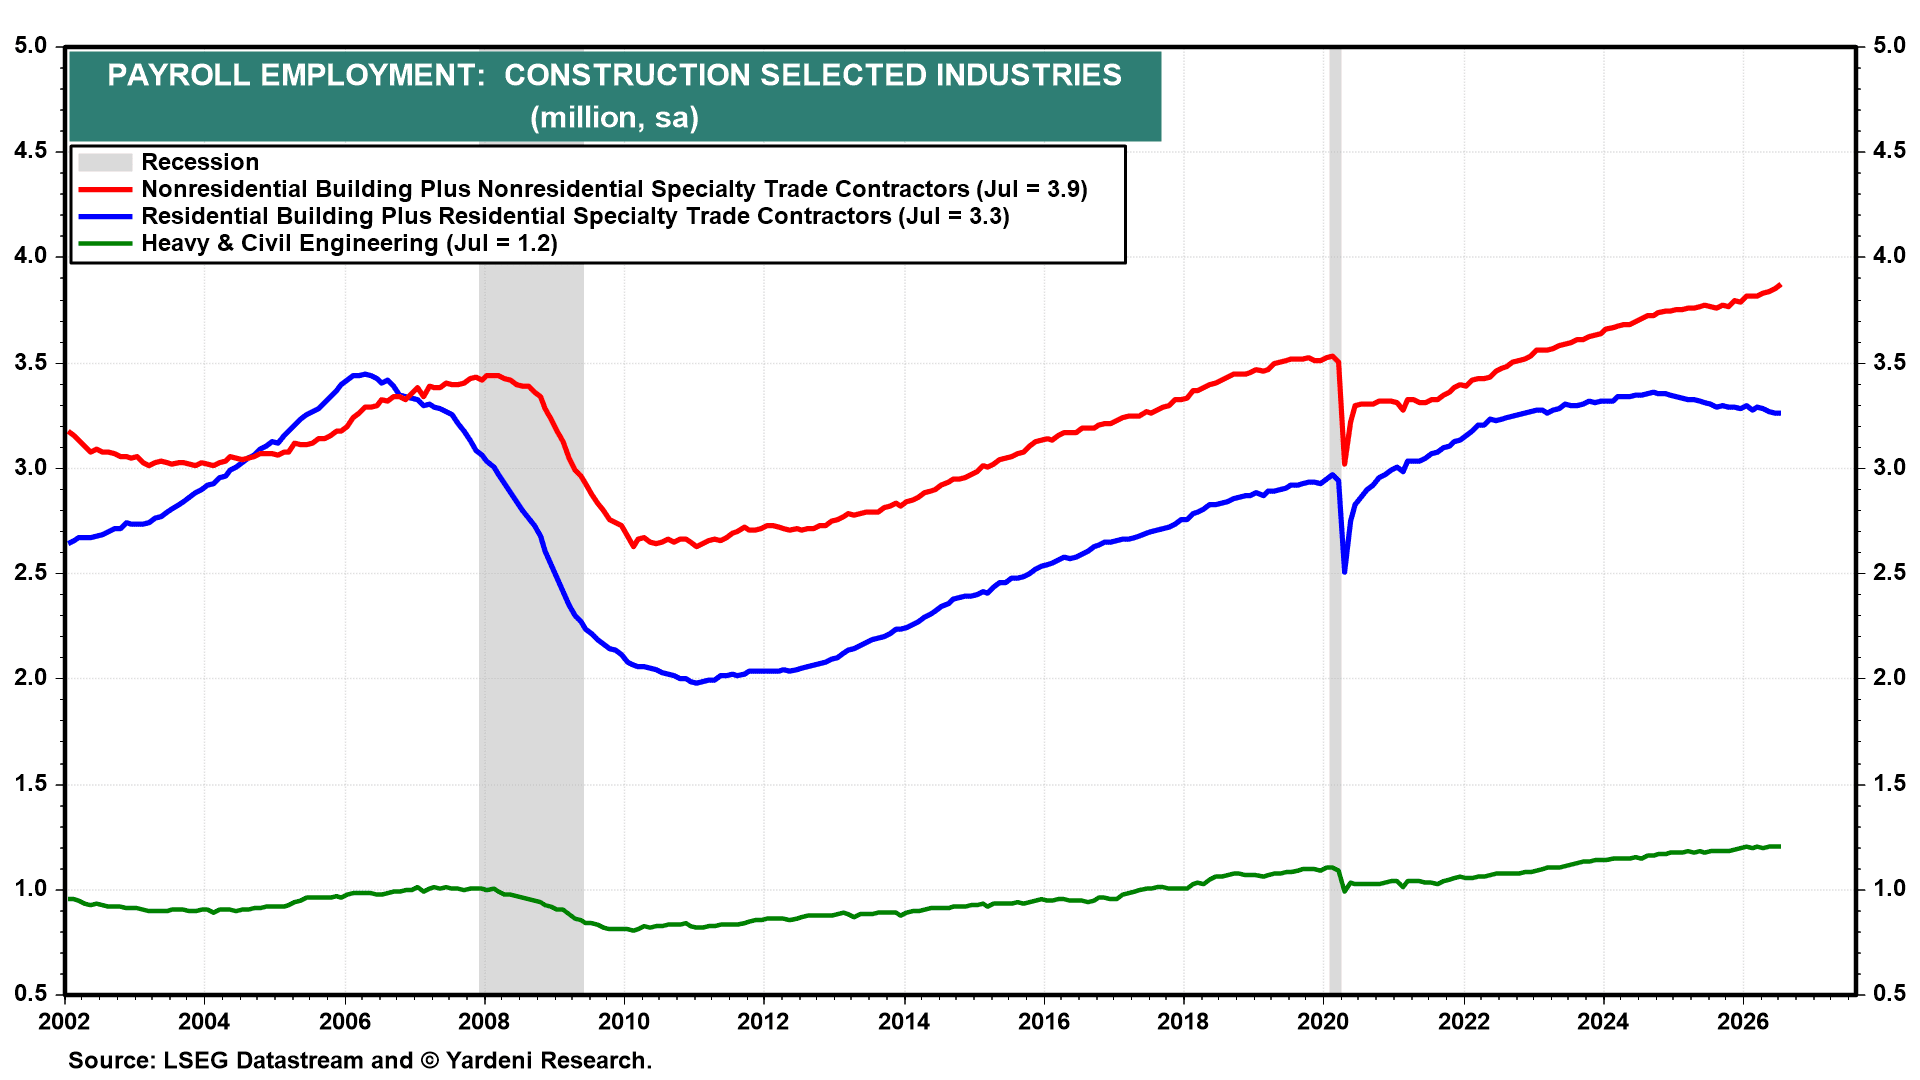
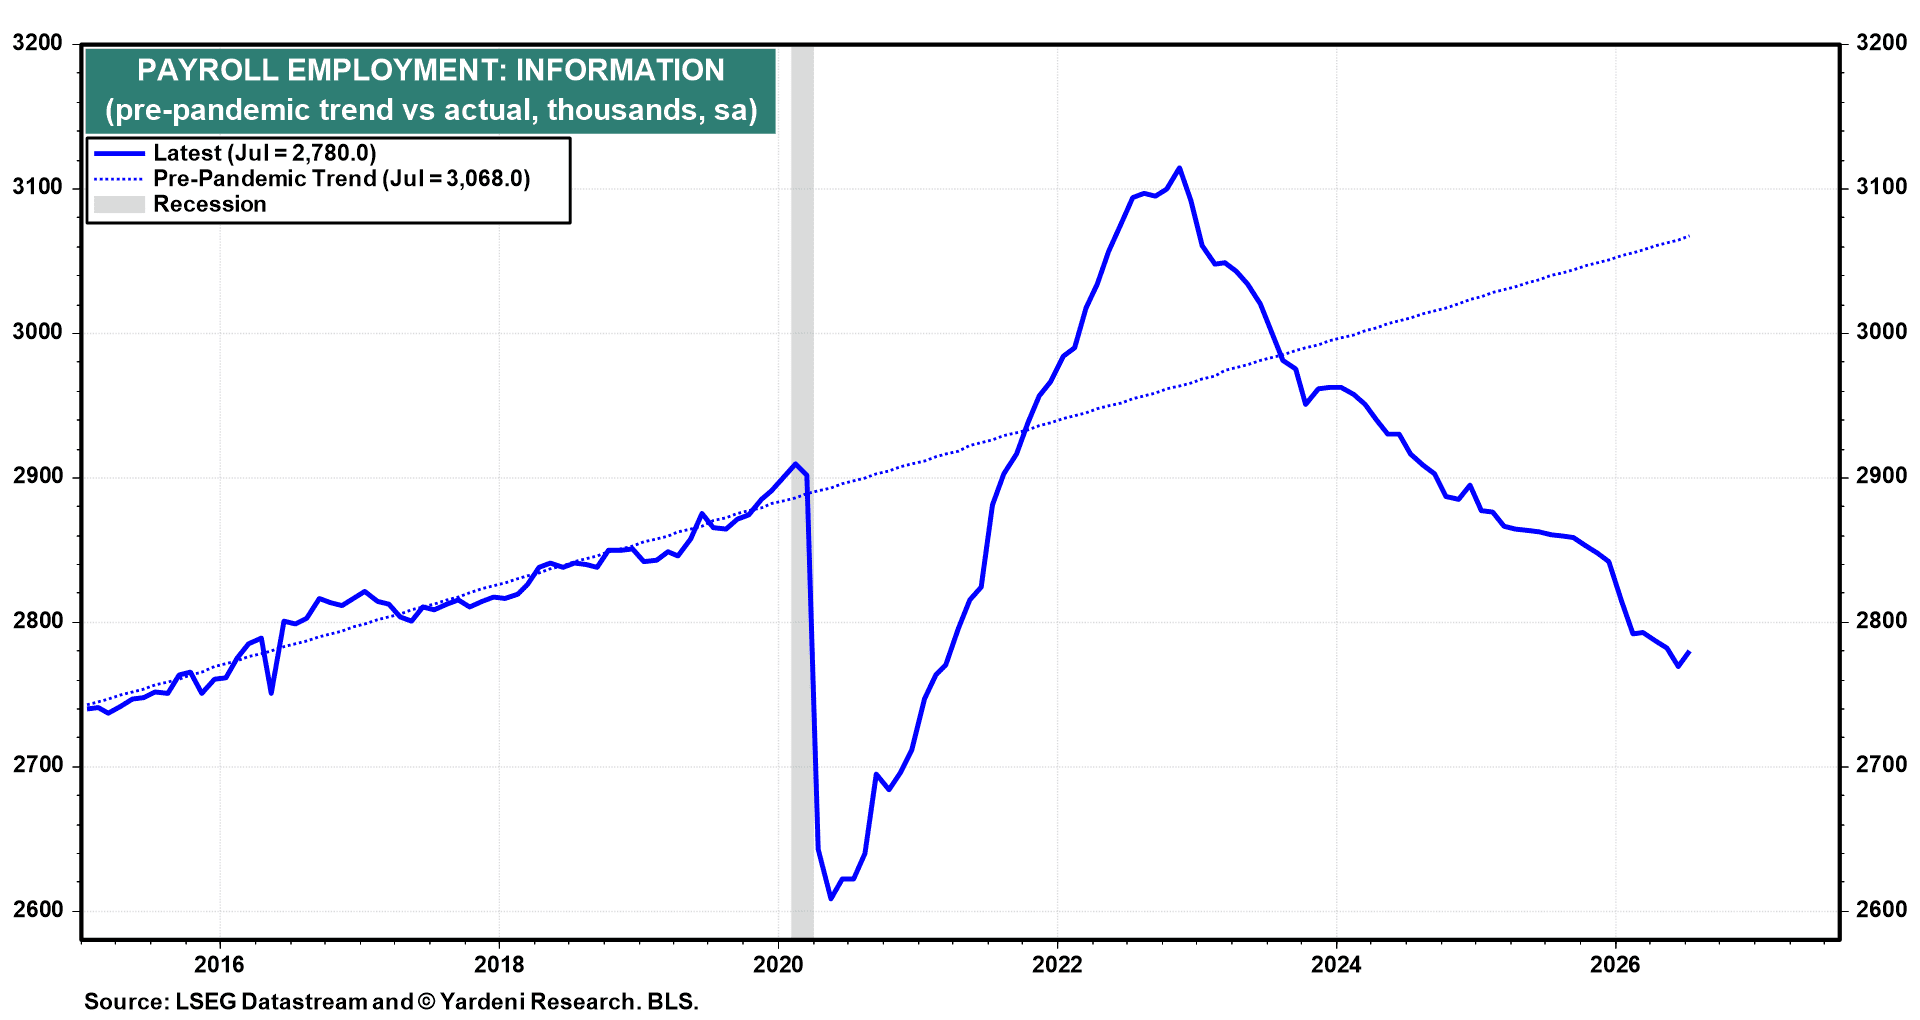
(3) Most other industries added jobs. Besides Leisure & Hospitality, Retail Trade, and Financial Activities, all other sectors reported jobs gains. For example, construction payrolls rose by 22,000, the most since January, while Information added 11,000, the most since November 2022.
In July, the one-month payroll employment diffusion index was 51.8%, meaning that more than half of industries expanded payrolls.
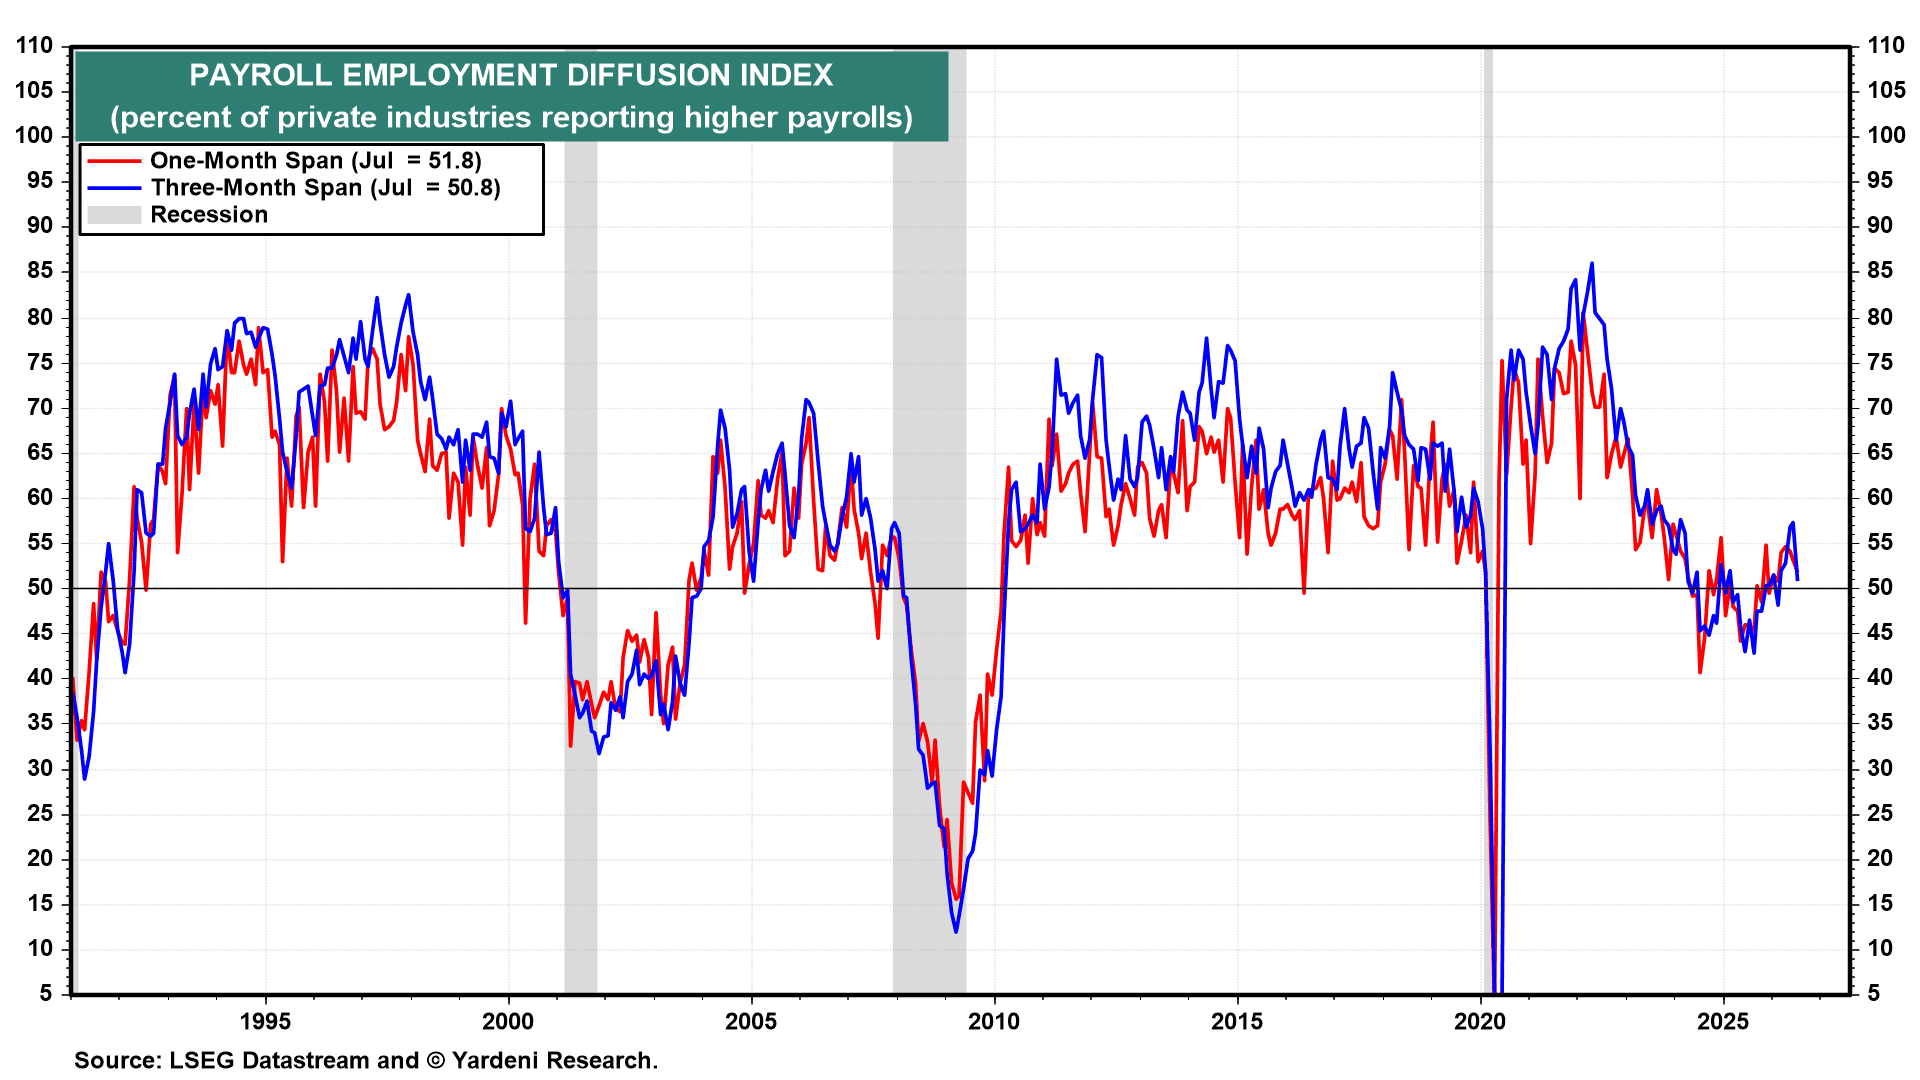 ▌View Related Live Charts: US - Nonfarm Employment Diffusion Index
Monthly payroll data are volatile, so it is useful to zoom out. Over the past six months, payrolls increased by an average of 44,000 per month, within the range of most estimates of the breakeven pace needed to keep unemployment stable. Additionally, the six-month diffusion index rose to 55.0% in July, its highest since March 2024.
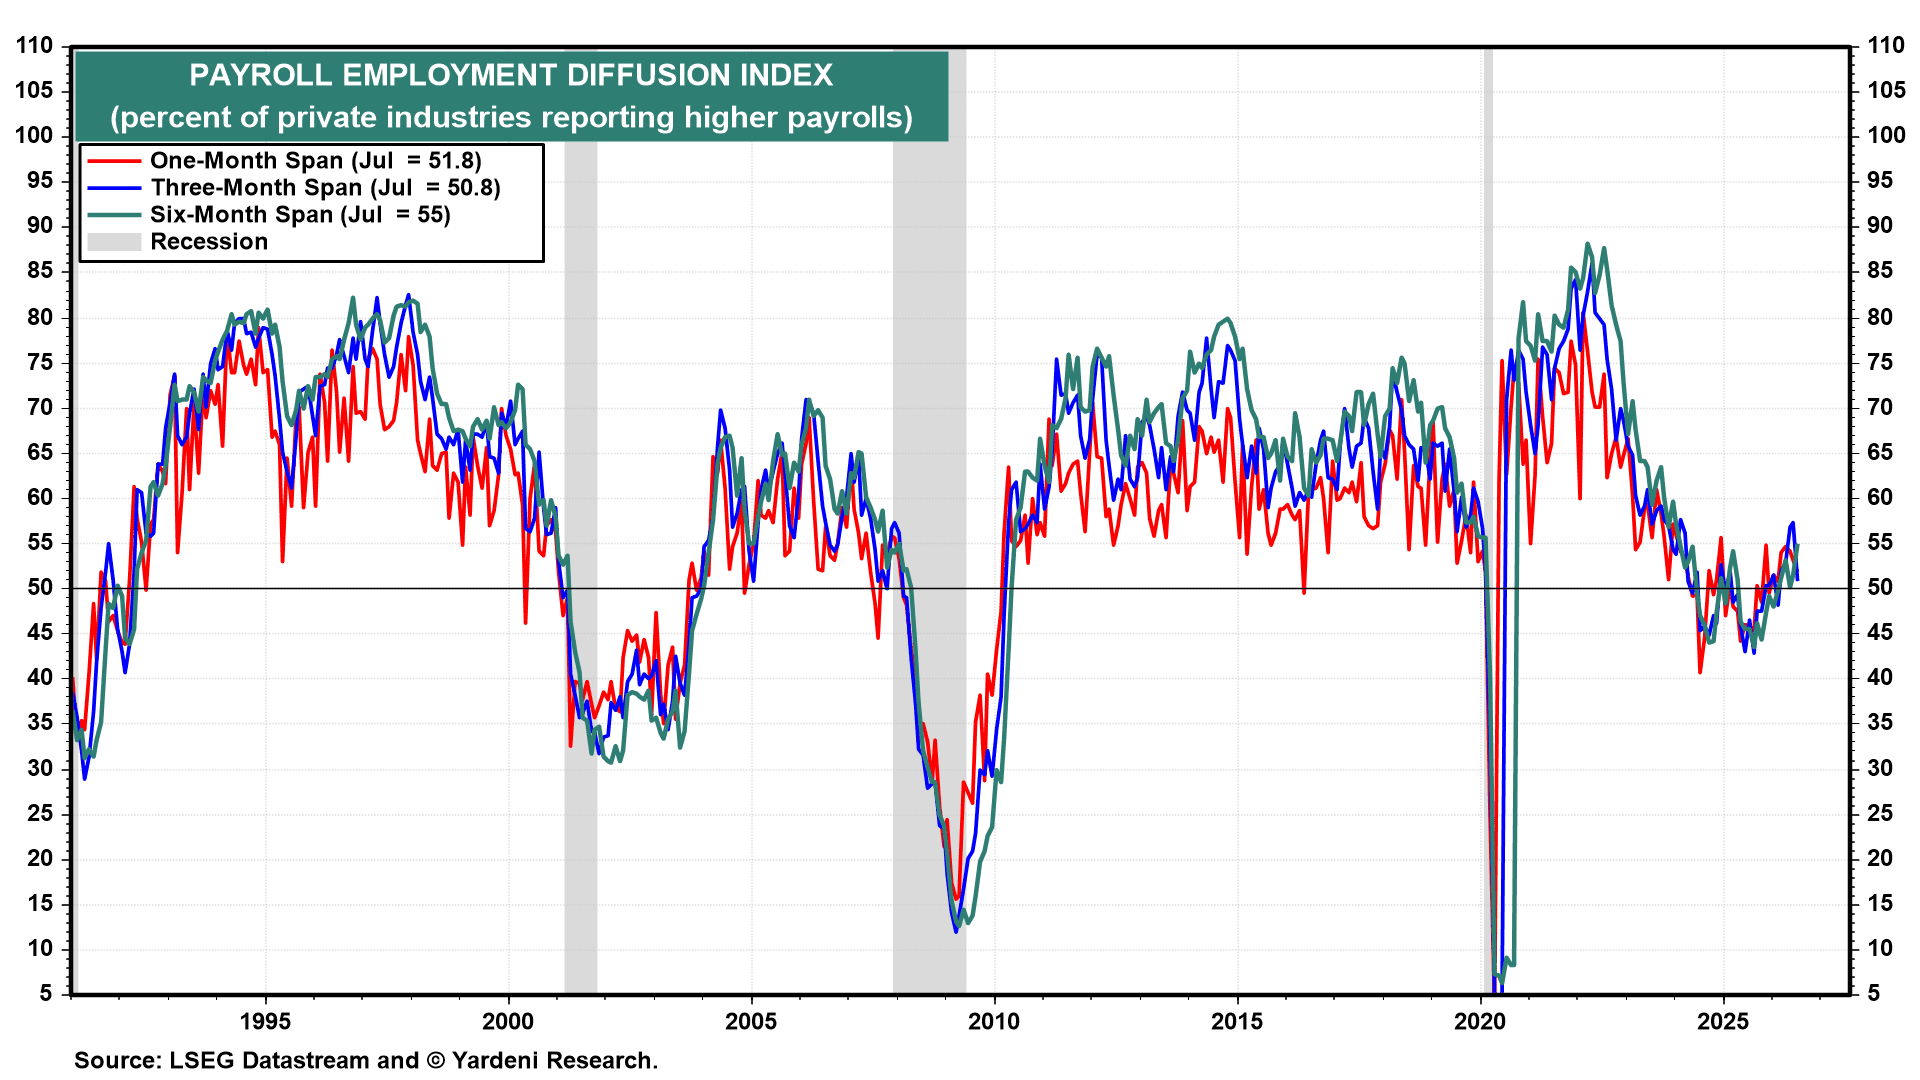 ▌View Related Live Charts: US - Nonfarm Employment Diffusion Index
We expect hiring to improve over the next few months. The plunge in local government employment is unlikely to...
 Get answers from MM AI.
-
How do calendar effects distort the July US jobs report's government payroll decline?
💡Calendar effects significantly distorted the July US jobs report's government payroll decline because a five-week gap between the June and July survey periods, instead of the usual four, caused an unusually large number of routine summer school contract expirations to occur before the July cutoff. This led to a plunge of 57,000 in local government payrolls, the largest monthly decline since October 2021, with local government education employment specifically falling by 49,600. Most of this decline is expected to reverse as school districts resume seasonal hiring for the new academic year.
-
What role did World Cup-related distortions play in the July private-sector employment figures?
💡World Cup-related distortions played a significant role in exaggerating the perceived weakness in July's private-sector employment figures. Employers had front-loaded hiring during the spring in anticipation of the tournament. When the usual July hiring pattern did not materialize, the seasonal-adjustment process converted this shortfall into reported job losses, particularly impacting industries like Leisure & Hospitality and Retail Trade. Despite these reported losses, job openings in both Retail Trade and Leisure & Hospitality remained high, suggesting underlying demand was still strong.
-
Which specific industries experienced job losses in July due to these distortions?
💡Specific industries experiencing job losses in July due to World Cup-related distortions include Leisure & Hospitality, which lost 40,000 jobs, and Retail Trade, which saw a decline of 19,000 jobs. Financial Activities also lost 14,000 jobs during the same period. These declines were largely attributed to the post-World Cup seasonal adjustments, where front-loaded hiring for the tournament in spring led to reported job losses in July when expected seasonal hiring patterns did not occur, despite job openings remaining elevated in these sectors.
-
How did most other US industries perform regarding job gains in July?
💡Most other US industries, apart from Leisure & Hospitality, Retail Trade, and Financial Activities, performed positively by adding jobs in July. For instance, construction payrolls increased by 22,000, marking the most significant gain since January, while the Information sector added 11,000 jobs, its highest since November 2022. The one-month payroll employment diffusion index reached 51.8% in July, indicating that more than half of industries expanded their payrolls, contributing to an average monthly increase of 44,000 payrolls over the past six months, which is consistent with maintaining stable unemployment.
-
How do Baby Boomer retirements impact US labor force participation rates?
💡Baby Boomer retirements significantly impact US labor force participation rates by exerting downward pressure on overall labor supply. The participation rate for workers aged 55 and older fell to 36.9% in July, its lowest since 2005, while participation among those aged 65 and older continues to decline. Older Americans now constitute a record 50% of everyone not in the labor force, an increase from less than 40% in 2011. As this large cohort continues to retire, labor-force growth is expected to remain constrained.
-
What effect does slower net immigration have on US labor supply growth?
💡Slower net immigration has a negative effect on US labor supply growth, as growth in the foreign-born labor force has decelerated from over 4.0% year-over-year during 2023 and 2024 to less than 2.0% currently. Foreign-born workers typically participate in the labor force at a higher rate (approximately 66%) compared to native-born workers (around 61%). Consequently, if stricter immigration policies continue to restrict the foreign-born labor force, aggregate labor force participation will likely remain under pressure, contributing to a tightening labor market where demand has exceeded supply for three consecutive months.
-
How is the AI buildout influencing wage growth in specific US industries?
💡The AI buildout is influencing wage growth in specific US industries by raising demand for specialized technical, engineering, and construction workers whose skills are scarce, leading to upward pressure on pay. For example, construction wages rose 4.4% year-over-year in July, nearing the fastest pace since October 2024, driven by data center construction. Information services also saw average hourly earnings accelerate to 5.8% year-over-year in July, its fastest since March 2023. Additionally, utilities industry wages increased sharply by 8.1% year-over-year, reflecting growing demand for labor in jobs related to expanding power and grid infrastructure supporting AI.
-
Why might aggregate average hourly earnings growth be understated?
💡Aggregate average hourly earnings growth might be understated because the series is sensitive to shifts in workforce composition, particularly the retirement of higher-paid Baby Boomers. As these highly paid workers leave the workforce, their wages are removed from the average. If they are replaced by younger, lower-paid workers, the measured wage growth can appear slower, even if individual workers receive consistent raises. This dynamic mirrors the pandemic distortion where layoffs of lower-wage workers mechanically inflated average hourly earnings, suggesting the current trend is an inverse compositional effect.
-
How stable is the US labor market to influence Federal Reserve monetary policy?
💡The US labor market is sufficiently stable, indicating it is strong enough that rate cuts are not warranted to support employment, and not so tight that it generates inflationary pressure. Unit labor costs rose just 1.2% year-over-year in Q2. This stability means the Federal Reserve has little reason to worry about the employment side of its dual mandate, allowing it to focus primarily on price stability. The employment situation is not deteriorating and does not present an obstacle to potential tightening if inflation necessitates such a response.
-
What core PCED inflation rate does New York Fed President John Williams consider consistent with disinflation?
💡New York Fed President John Williams considers a monthly core PCED inflation rate of roughly 0.2% during the second half of this year as consistent with disinflation. Persistent readings above this benchmark would indicate that inflation is proving more stubborn and could necessitate a monetary-policy response. The Cleveland Fed's Nowcasting model estimates that core PCED rose 0.27% month-over-month in July and is projected to rise another 0.27% in August, both exceeding Williams' benchmark, suggesting inflation may be more persistent than desired.
