Executive Summary:
Looking solely at Q2’s GDP growth rate, one would think the economy is weakening. Not so, say Ed and Elias. In fact, demand of all types strengthened last quarter, buoyed by brisk consumer spending, thanks to the Baby Boomers, and brisk business investment, thanks to the AI boom. The lower GDP growth rate was a function of surging imports, which aren’t bad news. Imports often rise in response to a strong domestic economy. … Also: As the economic engine heated up last quarter, so did inflation. The same consumer spending and AI capex trends keeping the economy vibrant are also boosting inflation, along with higher energy prices. … Check out the accompanying chart collection.
GDP I: Headline Number Misses the Big Story
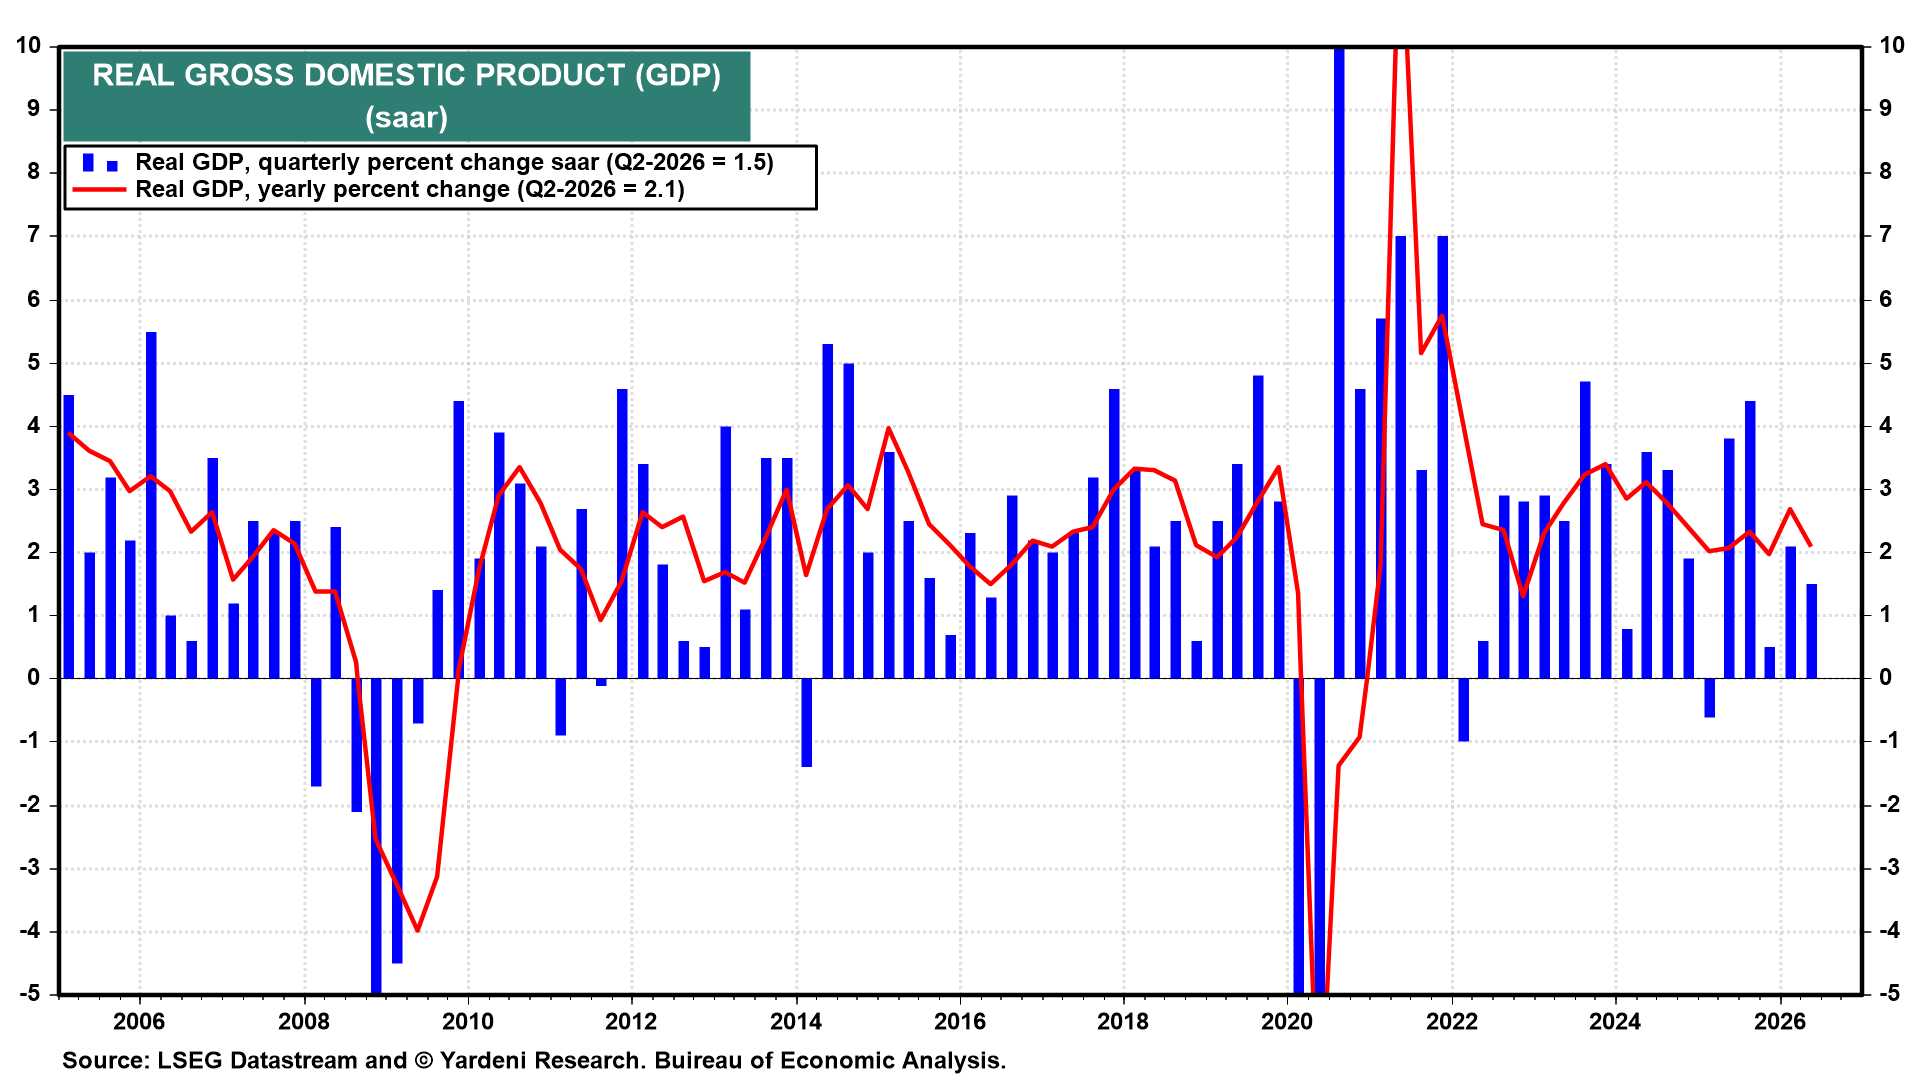
The advance Q2 estimate from the Bureau of Economic Analysis indicates that the US economy grew at a 1.5% annualized rate last quarter, down from 2.1% in Q1. At first glance, that suggests that growth lost some momentum. But the details tell a much more encouraging story. Let’s take a look under the hood of the economic engine.
 ▌View Related Live Charts: US - Real GDP
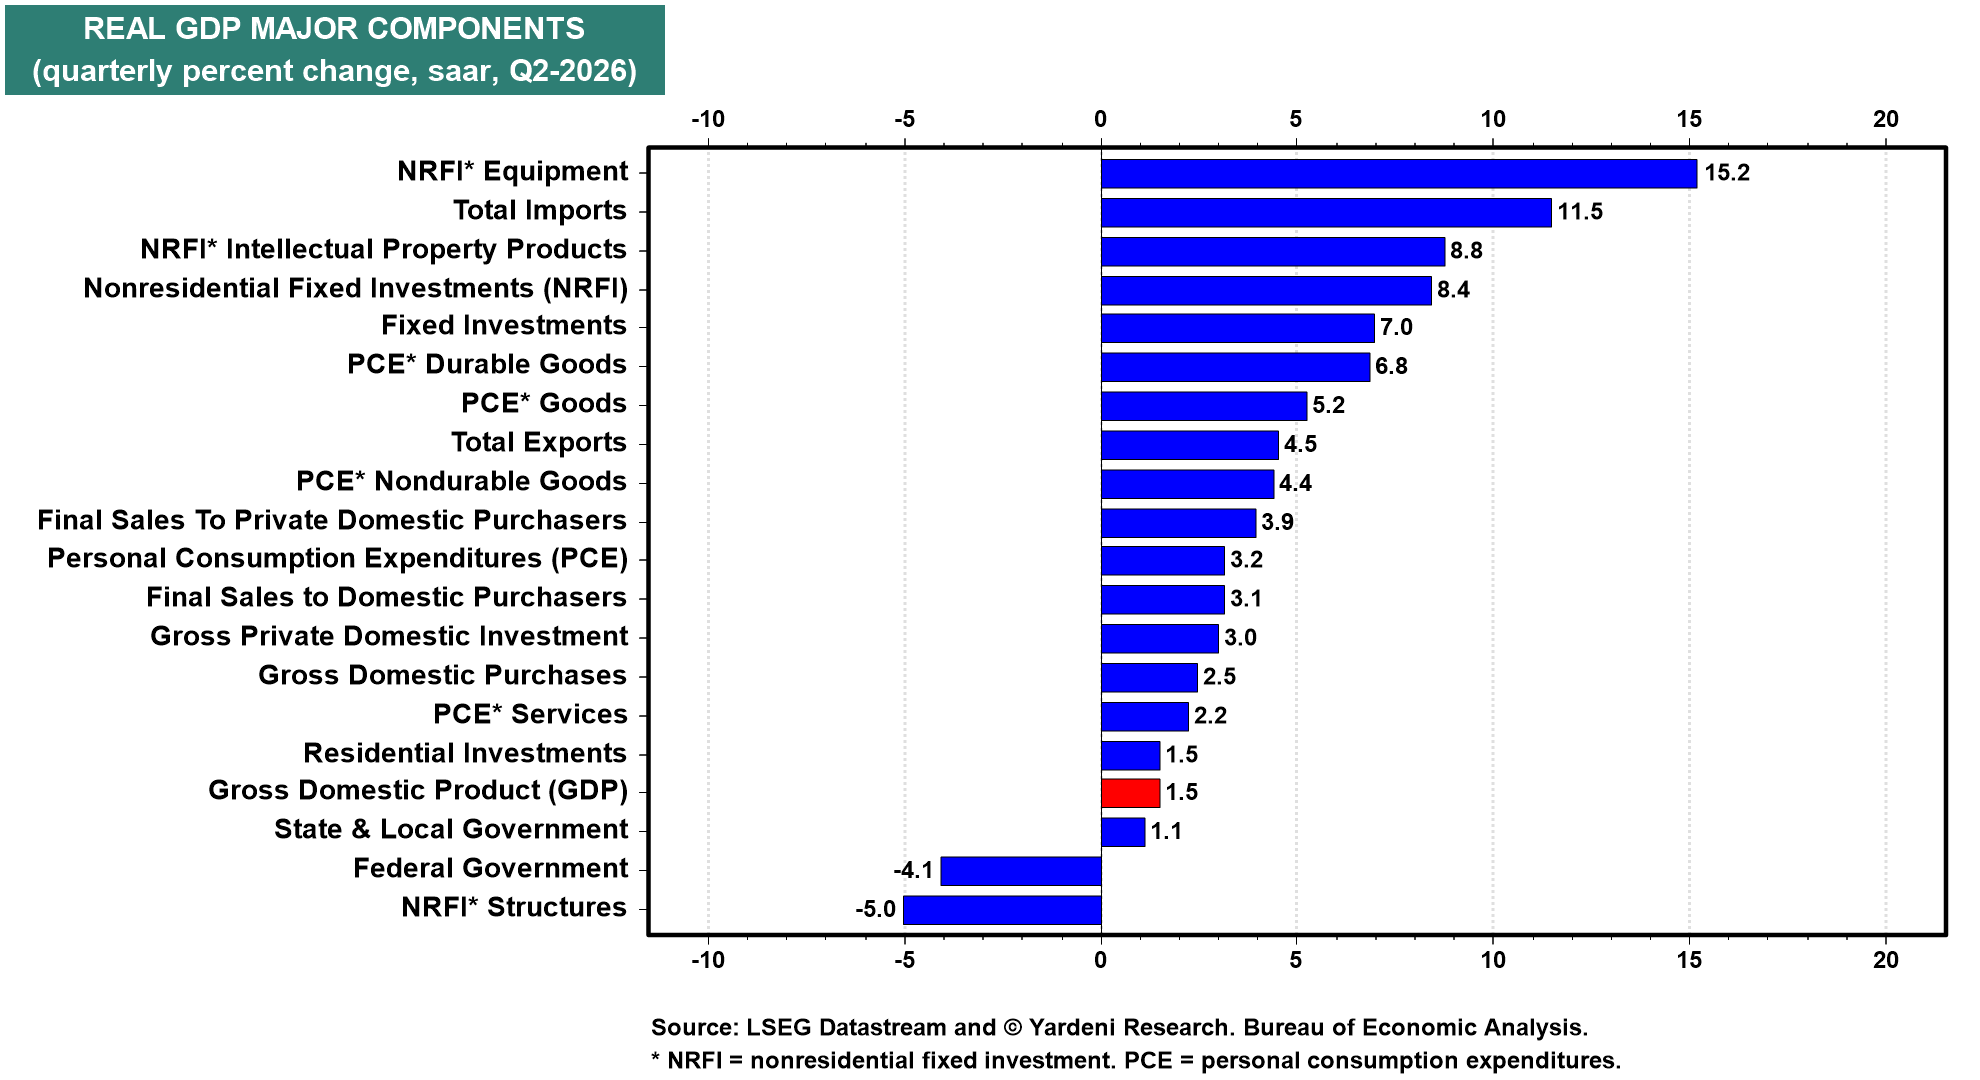
Every dollar of economic activity comes from one of four sources: consumers, businesses, governments, or foreign trade. Economists capture that reality with a simple equation: GDP = C + I + G + (X − M). The “C” is consumer spending, the “I” private investment, the “G” government spending, and “X – M” is net exports, or exports minus imports. Consumer spending, the largest component of GDP, rose to a 3.2% annualized growth rate during Q2 from just 0.5% in Q1. Nonresidential fixed investments grew at a robust pace of 8.4%, while exports increased by 4.5%. Offsetting those gains, federal government spending declined at an annualized rate of 4.1% and imports surged by 11.5%.
 ▌View Related Live Charts: US - Real GDP
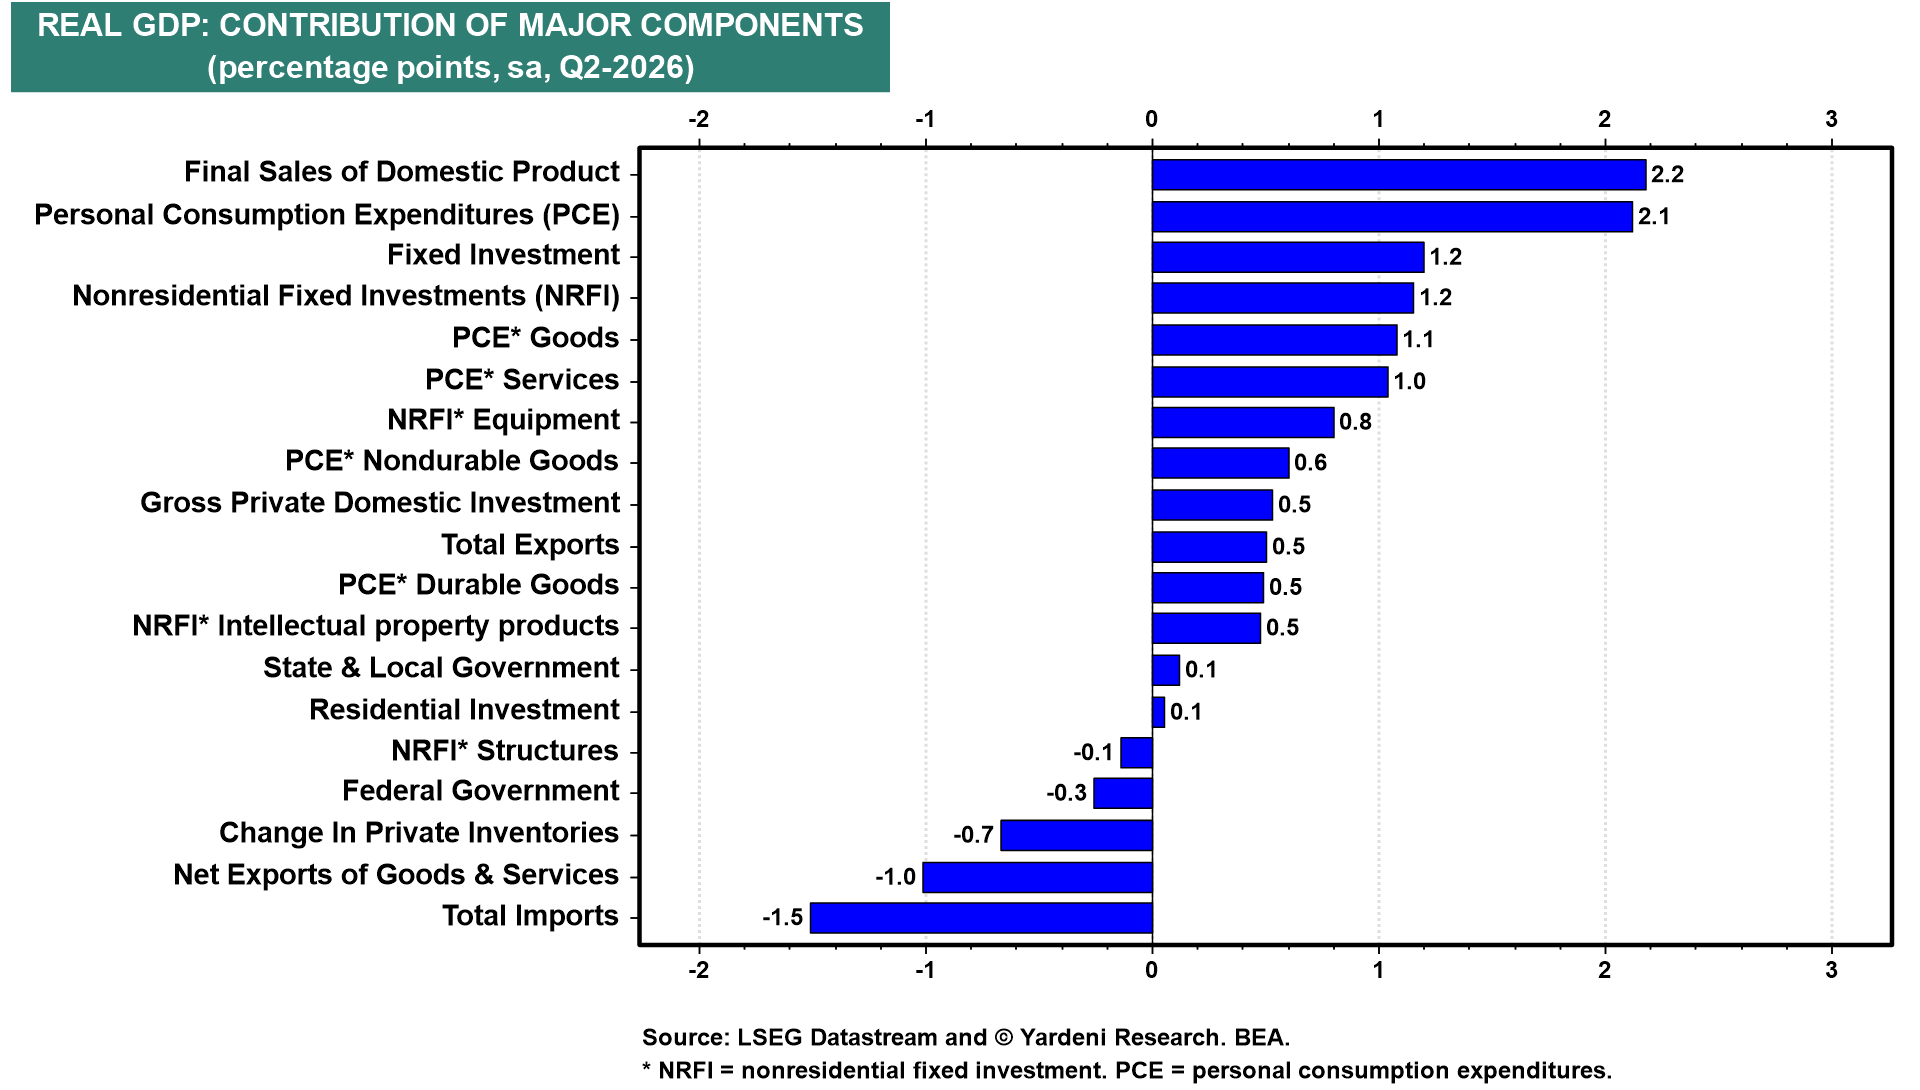
In other words, the economy was not held back by weak consumer spending or business activity. Demand wasn’t the problem—quite the opposite. The biggest drag came from trade as imports surged, creating a sizable headwind to headline GDP growth. That helps explain why real final sales to private domestic purchasers—which excludes the often-volatile effects of trade and inventories accelerated to an annualized growth rate of 3.9% in Q2, the strongest pace since Q1-2023. The bottom line is that underlying economic activity accelerated in Q2, with private-sector demand strengthening despite a slower headline GDP growth rate.
 ▌View Related Live Charts: US - Real GDP
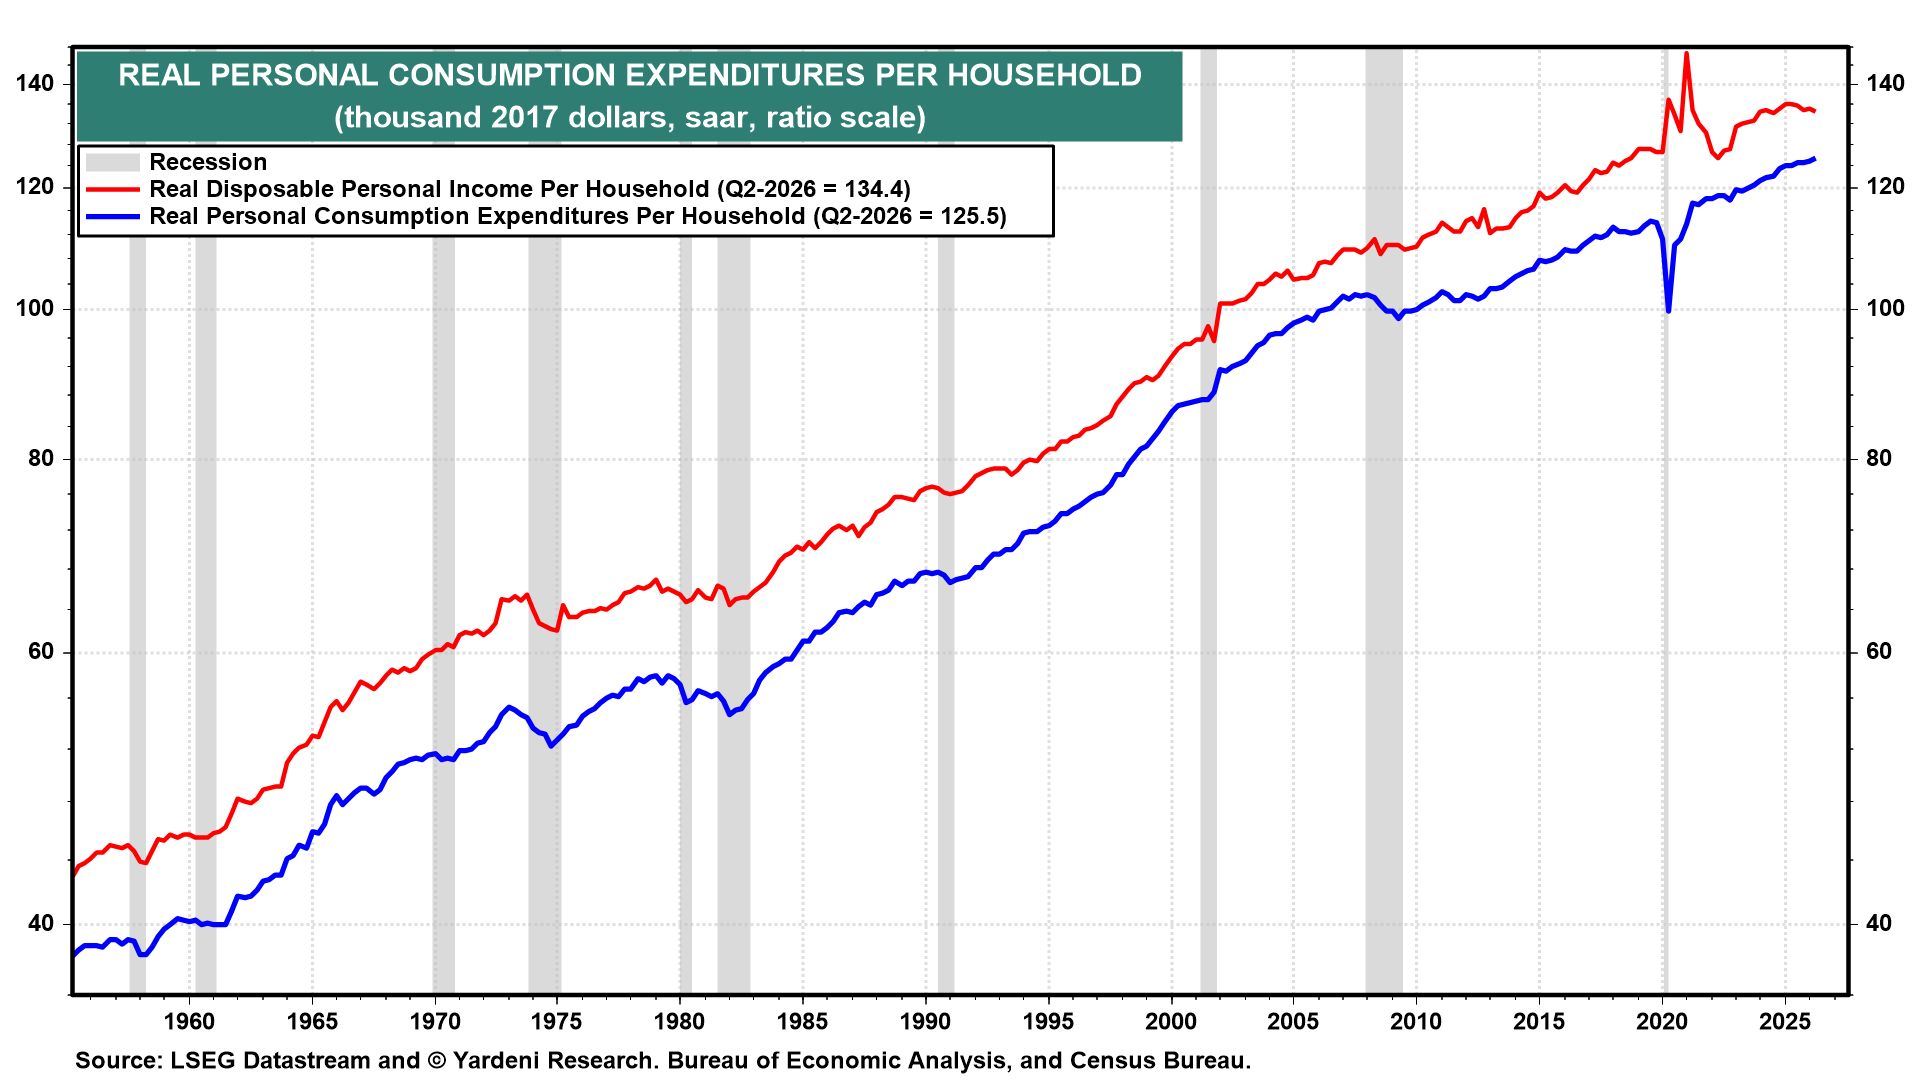
The latest GDP report confirms that AI capex is an important contributor to economic growth. So is consumer spending, which remains strong despite the widespread view that its strength reflects an unsustainable “K-shaped” model of the economy. According to this thesis, the rich are getting richer and the poor are getting poorer. Its proponents say that the 1.5% growth rate of real GDP shows that the economy is slowing. They note that disposable income has remained flat again during Q2, as it has for the past four quarters. Surely, the thinking goes, consumer spending can’t continue to rise.
 ▌View Related Live Charts: US - Real PCE - Goods & Services
We’ve countered the K-shaped analysis with our far more sensible “G-shaped” economy thesis. The resilience of consumer spending can be easily explained generationally. Older Americans are wealthier than younger ones, who are facing affordability problems. However, intergenerational support by the former to the latter is helping the young’uns cope.
GDP II: Consumer Remains the Economy’s Growth Engine
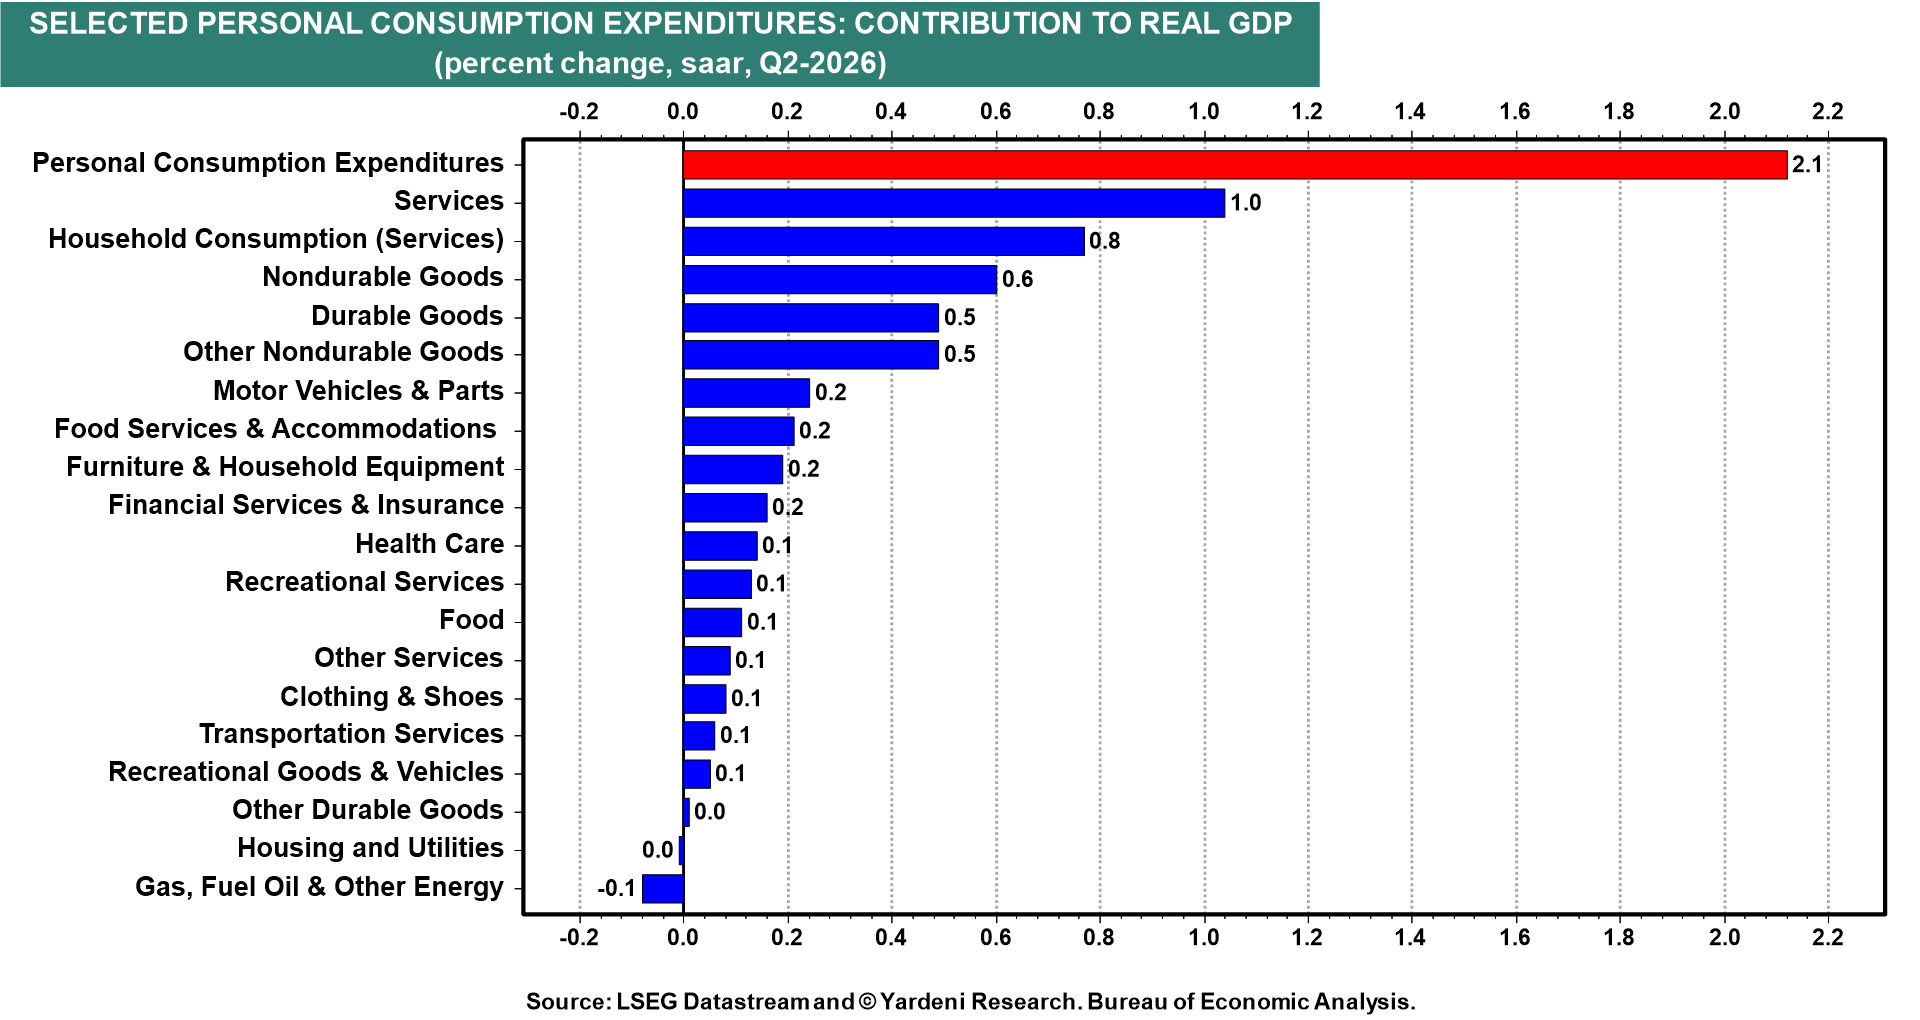
Consumer spending contributed 2.1 percentage points to GDP growth in Q2, the strongest contribution since Q3 2025. Spending on goods contributed 1.08 percentage points, the most since Q4 2024, while services spending contributed a healthy 1.04 percentage points.
 ▌View Related Live Charts: US - Real PCE - Goods & Services
The managements of financial services firms reporting Q2 earnings recently seemed pleasantly surprised by the consumer’s resilience. Bank of America described the economy as “more durable than expected, supported by the strong consumer,” while JPMorgan called consumers “resilient despite elevated gas prices and inflation.” Citi pointed to a “resilient customer base,” Wells Fargo highlighted “broad-based economic strength,” and U.S. Bancorp noted that customers “are continuing to spend money” despite weak sentiment surveys.
Consumer-facing companies are reporting similar trends. Delta cited “broad demand strength,” United said the economy is “probably better than people appreciate” and that “close-in demand remained robust,” while American Express reported “the highest rate we've seen in three years” for card-member spending growth. Darden CEO Rick Cardenas added that “our casual brands saw an increase in visits year-over-year from all income groups, including the bottom quintile” and observed that “weaker consumer sentiment doesn't necessarily translate into reduced spending.”
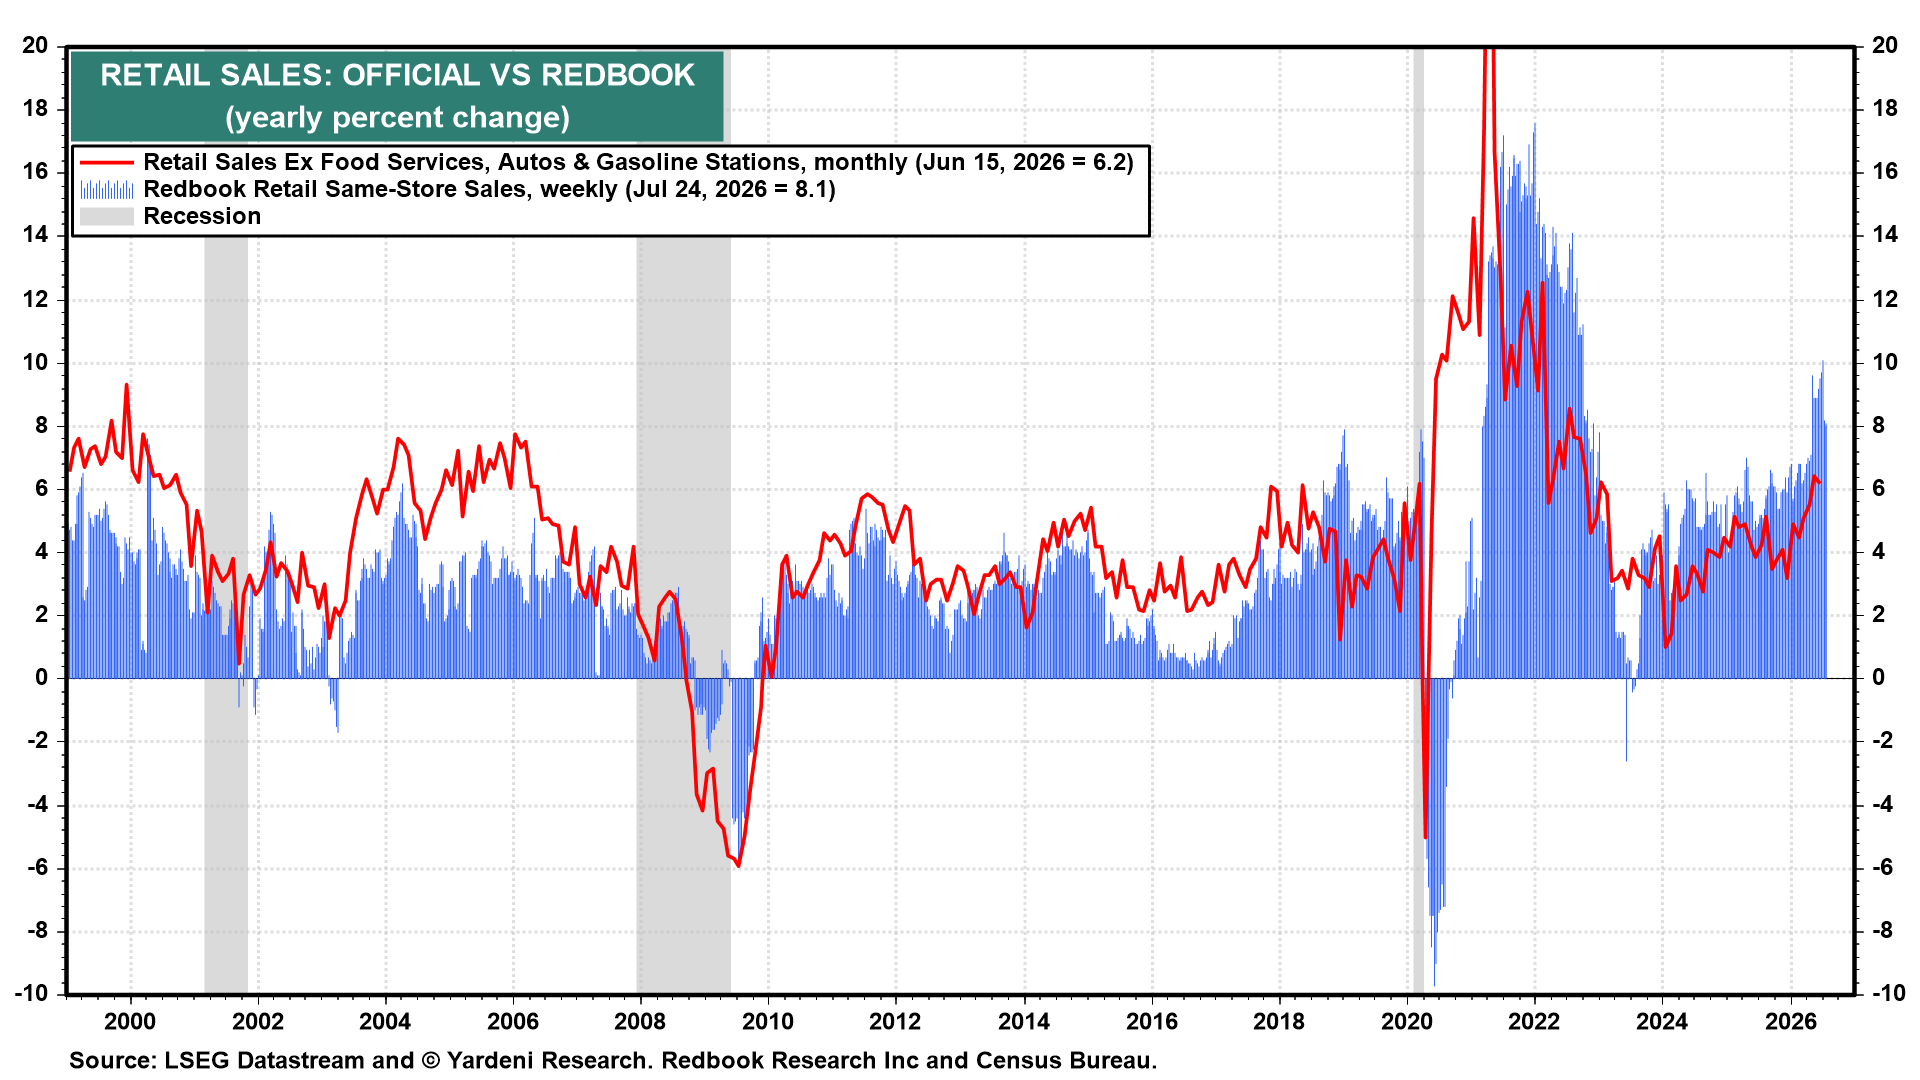
Adding to the good news, consumer spending appears to have entered Q3 with considerable momentum. Redbook same-store retail sales grew 8.1% y/y during the week of July 24, well above the 5.8% average growth rate recorded in 2025.
 ▌View Related Live Charts: US - Redbook Same-Store Retail Sales Index (YoY)
One of the key reasons why consumer spending has been and likely will remain resilient are the Baby Boomers.
GDP III: The Baby Boomer Spending Machine
The Baby Boomers are the driving force behind the durability of consumer spending. Consider the following:
(1) Boomers hold most of the wealth. Baby Boomers already own an extraordinary share of household net worth. As of Q1-2026, they had nearly $90 trillion of net worth, accounting for approximately 52% of total US household wealth. The Silent Generation held another $20 trillion, much of which will soon be inherited by their Boomer offspring. Much of the $110 trillion in the net worth of the largest and wealthiest retiring, or already retired, seniors in American history will eventually be passed on to the younger generations.
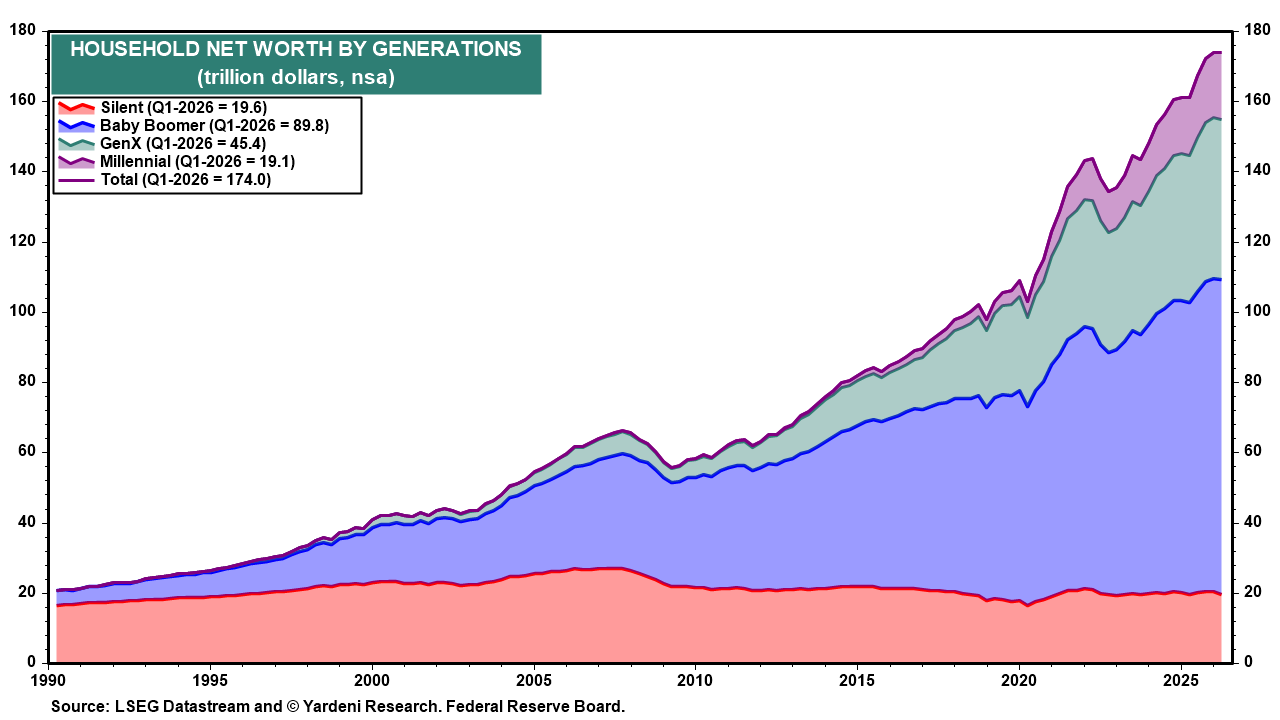
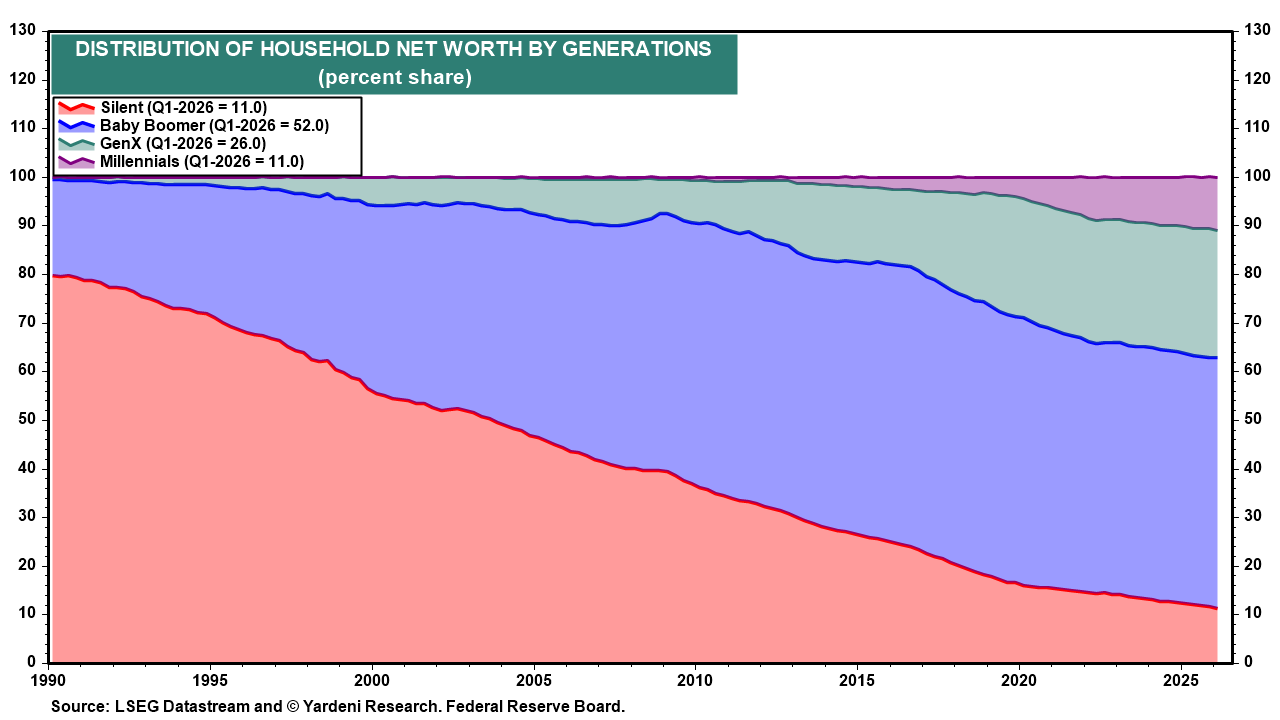
The concentration of wealth among older generations suggests that consumer spending is increasingly being supported by the spending of accumulated retirement wealth rather than labor income.
(2) Boomers hold most of the financial assets.
 Get answers from MM AI.
-
What factors contributed to the US GDP growth rate decline to 1.5% in Q2 2026?
💡The US GDP growth rate declined to an annualized 1.5% in Q2 2026 from 2.1% in Q1 primarily due to a substantial increase in imports, which surged by 11.5%, and a decline in federal government spending by an annualized rate of 4.1%. Despite this, consumer spending rose to a 3.2% annualized growth rate from 0.5% in Q1, nonresidential fixed investments grew by a robust 8.4%, and exports increased by 4.5%. The underlying economic activity, particularly private-sector demand, actually accelerated, with real final sales to private domestic purchasers growing at a 3.9% annualized rate, the strongest pace since Q1 2023, indicating that demand was not the problem.
-
How did consumer spending, private investment, and government spending impact Q2 2026 US GDP?
💡In Q2 2026, consumer spending significantly boosted US GDP, rising to a 3.2% annualized growth rate from 0.5% in Q1 and contributing 2.1 percentage points to GDP growth, the strongest since Q3 2025. Private investment, specifically nonresidential fixed investments, grew robustly at 8.4%, with fixed investment contributing 1.20 percentage points to GDP growth, largely due to AI-driven capital expenditure. Conversely, government spending, particularly federal government spending, declined at an annualized rate of 4.1%, acting as a drag on the overall GDP growth rate. The surge in imports by 11.5% also offset these gains, subtracting 1.01 percentage points from growth.
-
How did real final sales to private domestic purchasers perform in Q2 2026?
💡Real final sales to private domestic purchasers, which exclude the volatile effects of trade and inventories, accelerated to an annualized growth rate of 3.9% in Q2 2026. This performance marks the strongest pace since Q1 2023, indicating that underlying economic activity and private-sector demand strengthened despite the slower headline GDP growth rate of 1.5%. The acceleration in these sales highlights that domestic demand from consumers and businesses remained robust, effectively demonstrating that demand was not the primary factor hindering overall GDP growth, which was largely impacted by surging imports and declining federal government spending.
-
What is the 'G-shaped' economy thesis regarding resilient consumer spending?
💡The 'G-shaped' economy thesis explains the resilience of consumer spending by focusing on intergenerational wealth and support, particularly the significant financial position of Baby Boomers. This theory posits that older Americans, who are wealthier than younger generations facing affordability problems, provide intergenerational support, helping younger individuals cope. Baby Boomers hold approximately 52% of total US household wealth, nearly $90 trillion as of Q1 2026, and are less sensitive to factors like higher interest rates and labor market conditions due to their accumulated wealth and assets. This generational dynamic sustains consumer spending, countering the 'K-shaped' analysis that suggests an unsustainable division in economic well-being.
-
What role do Baby Boomers play in the durability of US consumer spending?
💡Baby Boomers are the primary driving force behind the durability of US consumer spending due to their substantial wealth, financial assets, and lower sensitivity to economic headwinds. As of Q1 2026, Boomers hold approximately $90 trillion, or 52%, of total US household wealth, including 54% of corporate equities and mutual funds and 41% of real estate wealth. Their spending is supported by accumulated retirement wealth rather than labor income, making them less reliant on wage growth or job security. Furthermore, higher interest rates often benefit them through increased interest income from assets like money market funds, while their modest debt burden and low fixed mortgage rates shield them from rising borrowing costs, enabling continued brisk spending.
-
How much of the total US household net worth do Baby Boomers hold?
💡Baby Boomers hold an extraordinary share of total US household net worth, approximately 52% as of Q1 2026, amounting to nearly $90 trillion. This substantial wealth concentration, coupled with the Silent Generation holding another $20 trillion—much of which will eventually be inherited by Boomer offspring—underscores their dominant financial position. This wealth is largely composed of financial assets like corporate equities and mutual funds (54% share, nearly $30 trillion) and real estate wealth (41% share), enabling their consumer spending to be driven by accumulated assets rather than current labor income.
-
How do higher interest rates impact Baby Boomers' spending habits?
💡Higher interest rates impact Baby Boomers' spending habits beneficially, as they are less sensitive to borrowing costs and often benefit from increased interest income. Baby Boomers hold approximately $3.1 trillion in money market funds, representing about 60% of all household money market assets, so elevated short-term interest rates boost their interest income. Many have also paid off their mortgages or secured historically low rates, reducing their debt burden (only 22% of total household liabilities). Additionally, their reluctance to give up low mortgage rates by staying in their homes contributes to rising home prices, further increasing their equity and supporting consumption despite moderating income growth.
-
Why are Baby Boomers less dependent on the labor market for spending decisions?
💡Baby Boomers are less dependent on the labor market for spending decisions because many are already retired or approaching retirement. Their financial position is increasingly tied to their balance sheets, including significant holdings in stock prices, home prices, and interest-generating assets, rather than their paychecks or wage growth. Unlike younger generations, they do not base spending decisions on hiring conditions or job security. This distinction is crucial because it means a growing share of aggregate consumer spending is driven by households whose finances are more closely linked to capital gains and interest income than to labor market dynamics, explaining their sustained consumption despite concerns about employment growth.
-
Which areas of business investment are primarily driving the AI buildout?
💡The AI buildout is primarily driving business investment in technology-related areas. Companies are heavily investing in servers, semiconductors, networking equipment, software, and data-center infrastructure. This focus reflects a strategic shift towards technology-related investment over traditional bricks-and-mortar projects. The impact of this investment is increasingly evident across the broader economy, with financial leaders describing it as an "AI capex super cycle" expected to fuel multi-year investment in technology, data centers, energy, and defense sectors.
-
How has the AI investment boom affected manufacturing activity and employment?
💡The AI investment boom has positively affected manufacturing activity and employment by stimulating demand across various real-economy sectors. Manufacturing activity has improved, and core capital goods orders remain strong as companies build the necessary infrastructure to support AI. This has led to firmer employment growth in manufacturing and construction, creating demand for everything from electricians and plumbers to industrial suppliers and transportation firms. While boosting growth and jobs in the short run, this investment also increases prices across the tech ecosystem, though it is expected to enhance productivity and help lower inflation over the long run.
