Executive Summary:
Today, Ed and Elias share bird’s eye views of the economy from the perches of the hawks and owls on the Fed. The hawks may favor tightening at the FOMC’s September meeting, unconvinced that inflation is on a steady flight path down to the Fed’s 2.0% target. The owls are more confident of inflation’s downward course. July’s subdued inflation readings support their case for holding rates steady in September. But recent labor demand and consumer spending data suggest that the economy is healthy enough for a rate hike, supporting the hawks. August’s data should help clarify whether inflation needs a nudge to return to target or can get there on its own. … Check out the accompanying chart collection.
The Fed: Do Hawks or Owls Have the Stronger Case?
The Fed is currently divided between a hawkish camp and an owlish camp:
(1) The hawks—led by Cleveland Fed President Beth Hammack, Dallas Fed President Lorie Logan, and Minneapolis Fed President Neel Kashkari—dissented from the majority decision at the July 28-29 FOMC meeting. They favored a 25bps hike in the federal funds rate and appear inclined to support an increase at the next meeting, on September 15 and 16. Their view is that inflation remains too high, is not moving back to the Fed’s target of 2.0% y/y, and that monetary policy may not be restrictive enough to finish the job.
The hawks say that the insatiable demand for capital created by the AI buildout, wide fiscal deficits, and headwinds to national savings from accelerating retirements and slower immigration are causing the hypothetical “neutral” federal funds rate to rise, questioning whether the policy rate is restrictive enough to restore price stability.
Hammack’s recent comments underscore this view. She still supports immediate tightening action because she lacks confidence inflation is on a durable path back to 2.0%. She warns that excessive economic growth could create more inflation and says that the Fed needs enough restraint to move inflation back to its target.
(2) The owls include the FOMC members who voted to keep rates unchanged in July. Many appear to be operating within the framework outlined by New York Fed President John Williams, who suggested that core PCE inflation running above 0.2% m/m in the second half of this year would point to more persistent inflation pressures and could warrant a rate hike. With July core PCE inflation currently tracking around 0.2% m/m, the latest inflation data likely nudged this camp closer to favoring a hold in September.
The owls supported holding rates steady in July but remain open to a hike later this year, including in September. While they share the hawks’ inflation concerns, they prefer to wait for more data before concluding that additional tightening is necessary. Several important data releases remain before the September meeting, including the August CPI, PPI, and employment reports. Those reports will provide a clearer picture of whether inflation remains persistent or is back on the disinflationary track.
As for the recently released data, they probably did not change either camp’s mind. The US economy has become an economy of “buts.” Jobs growth has slowed, but the labor demand remains resilient. Inflation has moderated, but it remains too high. Retail sales disappointed, but consumer spending continues to expand. Both camps can find support in the recent data releases.
The owls’ case has strengthened with the report of moderate inflation pressures in July. So the Fed now appears more likely to hold rates steady in September than it recently did. But the resilience of the labor market and a robust consumer sector suggest that the economy can withstand a rate hike without much duress, supporting the hawks. So a rate hike next month remains very much on the table.
Let’s have a closer look.
The Labor Market: Jobs Growth Has Slowed, But Demand Remains Strong
The payroll data show a clear slowdown. The economy added 214,000 jobs in March, and jobs growth has slowed every month since. In July, nonfarm payrolls fell by 23,000.
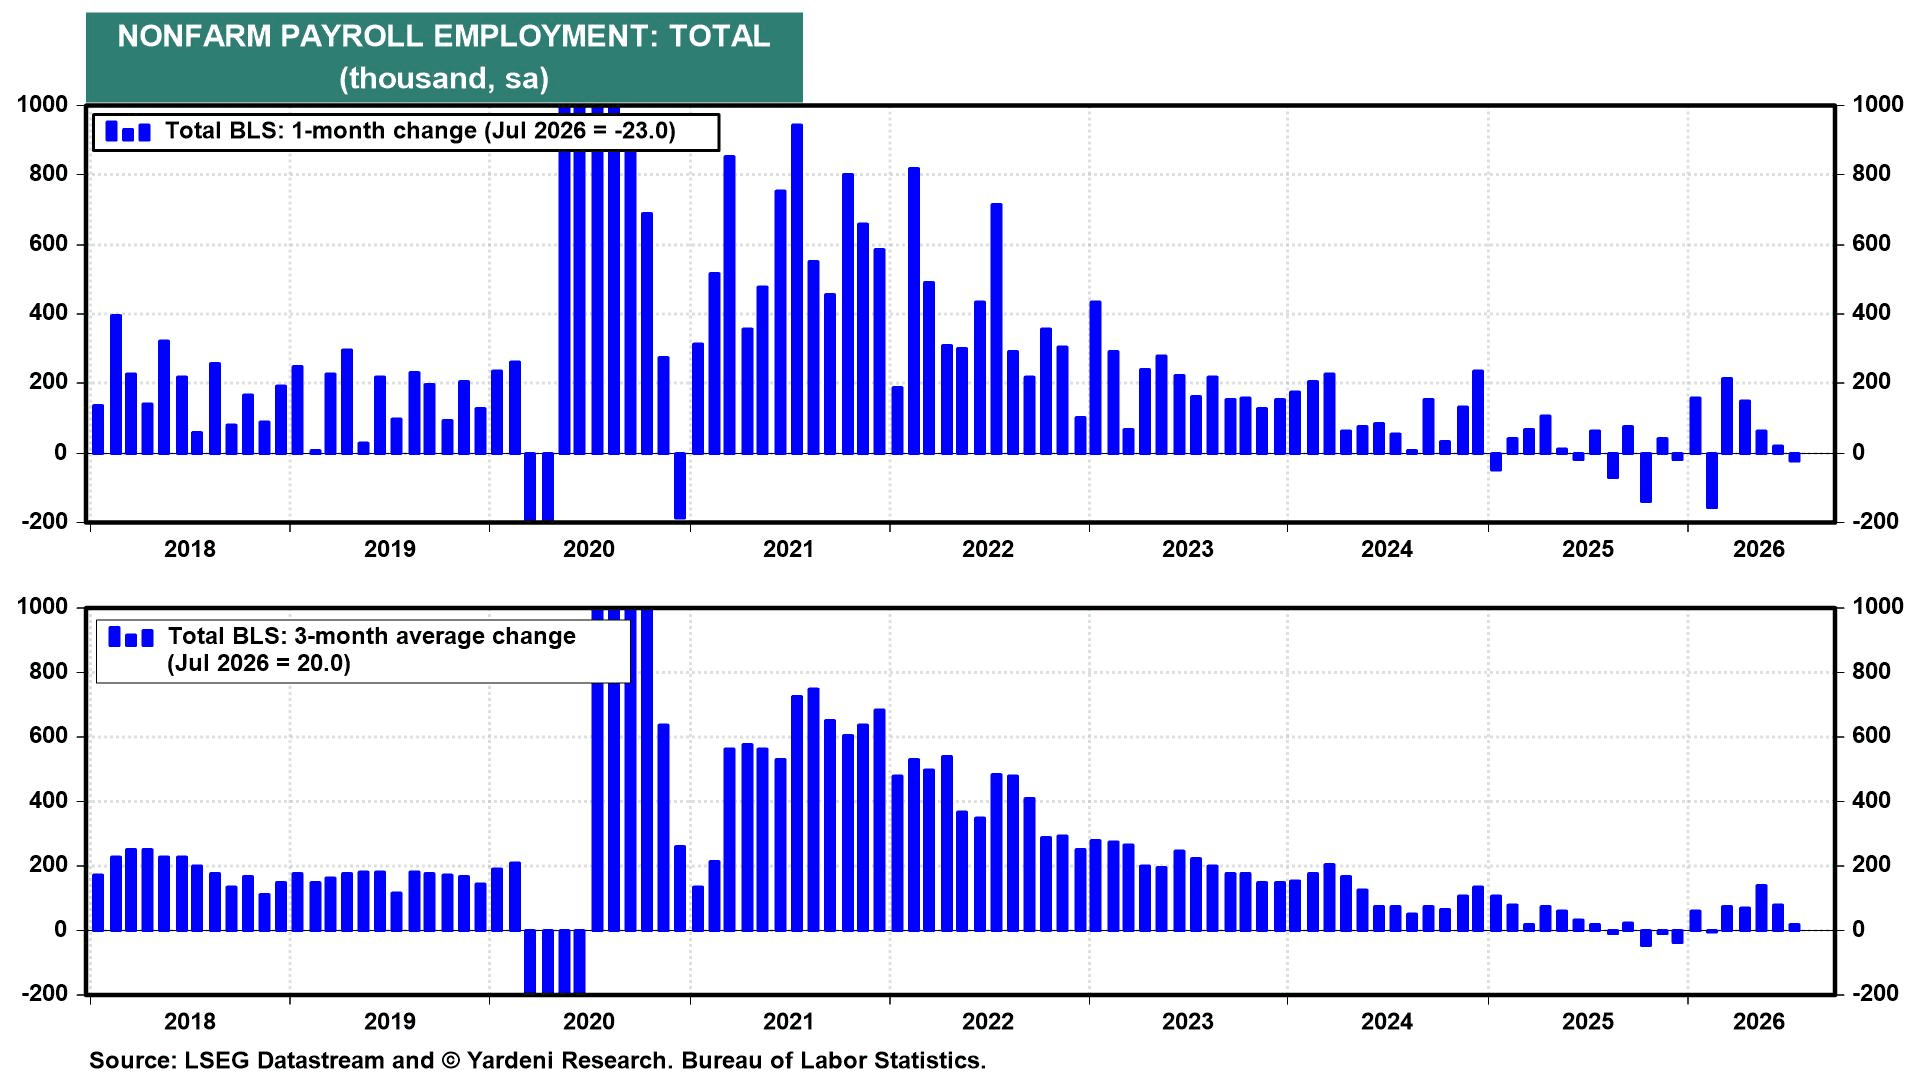 ▌View Related Live Charts: US - Nonfarm Payrolls vs. Unemployment Rate
ADP’s weekly data tell a similar story: Over the four weeks ended July 25, private employers added just...
 Get answers from MM AI.
-
What arguments support the Federal Reserve hawks' position for a September rate hike?
💡Federal Reserve hawks advocate for a September rate hike due to persistent inflation, which they believe is not on a steady path towards the Fed's 2.0% target. Led by Cleveland Fed President Beth Hammack, Dallas Fed President Lorie Logan, and Minneapolis Fed President Neel Kashkari, the hawks cite insatiable demand for capital from the AI buildout, wide fiscal deficits, and headwinds to national savings from accelerating retirements and slower immigration, suggesting the hypothetical "neutral" federal funds rate is rising. Hammack emphasizes that excessive economic growth could fuel more inflation, necessitating tightening to restore price stability and ensure the policy rate is restrictive enough. They dissented from the July FOMC decision, favoring a 25bps hike, and remain inclined to support an increase at the next meeting on September 15 and 16.
-
Why do Federal Reserve owls favor holding interest rates steady in September?
💡Federal Reserve owls favor holding interest rates steady in September, primarily due to July's subdued inflation readings, which support their case that inflation is on a downward course. Many owls operate within the framework outlined by New York Fed President John Williams, who indicated that core PCE inflation above 0.2% m/m in the second half of the year could warrant a hike. With July core PCE inflation tracking around 0.2% m/m, this data likely reinforces their preference for a hold. The owls, who voted to keep rates unchanged in July, share inflation concerns but prefer to await more data, including August's CPI, PPI, and employment reports, to confirm whether additional tightening is necessary before concluding inflation is persistent.
-
How do recent labor market trends influence the Federal Reserve's monetary policy decisions?
💡Recent labor market trends present a mixed picture, influencing the Federal Reserve's monetary policy decisions by offering support to both hawkish and owlish camps. While jobs growth has slowed, with nonfarm payrolls falling by 23,000 in July and private employers adding just 8,250 jobs per week over the four weeks ended July 25, labor demand remains resilient, as evidenced by 7.36 million job openings in June. This resilience, coupled with robust consumer spending, suggests the economy can withstand a rate hike, supporting the hawks. Conversely, slowing jobs growth and unit labor costs indicate labor is not the primary source of inflation, strengthening the owls' argument for holding rates steady and waiting for more data, as the labor market is neither hot enough to mandate hikes nor weak enough to justify cuts.
-
What three factors contribute to slowing jobs growth despite healthy labor demand?
💡Three factors contribute to slowing jobs growth despite healthy labor demand: skills mismatches, Baby Boomer retirements, and less immigration. Firstly, skills mismatches, with 36% of firms having unfilled openings and 51% reporting few or no qualified applicants in July, reflect businesses struggling to find workers with the right expertise and in the correct geographic locations, particularly due to the AI buildout creating specialized demand. Secondly, Baby Boomer retirements have constrained labor supply, causing the labor force to shrink by 264,000 in July and the labor force participation rate to fall to 61.4%, with older workers accounting for much of this reduction. Thirdly, slower immigration, with growth in the foreign-born labor force decreasing from over 4.0% y/y in 2023-2024 to less than 2.0% currently, disproportionately impacts the aggregate labor force participation rate, as foreign-born workers participate at a higher rate (66% versus 61% for native-born workers), signaling supply constraints rather than weak demand.
-
How do skills mismatches impact current jobs growth and labor market dynamics?
💡Skills mismatches significantly impact current jobs growth and labor market dynamics by making it difficult for businesses to find qualified workers, despite healthy demand. The National Federation of Independent Business's (NFIB) July survey revealed 36% of firms had unfilled openings and 51% reported few or no qualified applicants, the highest shares since June and September 2025, respectively. This issue is partly driven by the changing composition of labor demand, particularly the AI buildout, which acts as a private-sector stimulus, creating specialized needs for roles such as electricians, HVAC technicians, engineers, and power-grid specialists. Additionally, the mismatch is geographical, as many projects are concentrated in specific regions, and high mortgage rates reduce worker mobility, locking homeowners into lower-rate mortgages. Consequently, firms struggle to fill positions with the right skills in the right places, contributing to slower jobs growth even amid strong overall labor demand.
-
How does reduced immigration affect the overall labor force and economic growth?
💡Reduced immigration significantly affects the overall labor force and economic growth by constraining labor supply and exacerbating skill shortages. Growth in the foreign-born labor force has slowed from over 4.0% year-over-year during 2023 and 2024 to less than 2.0% currently. Foreign-born workers participate in the labor force at a higher rate, approximately 66%, compared to native-born workers at 61%. Consequently, slower immigration growth has a disproportionate impact on the aggregate labor force participation rate. If stricter immigration policy continues to limit the foreign-born workforce, slower payroll growth will increasingly reflect supply constraints rather than a weakening of labor demand, potentially hindering economic expansion by limiting the availability of workers for growing industries.
-
Which specific industries show significant wage growth reflecting robust labor demand?
💡Significant wage growth, reflecting robust labor demand, is evident in specific industries benefiting from the AI buildout, where labor shortages are most pronounced. In July, average hourly earnings rose by 4.4% year-over-year in construction, 5.8% in information services, and 8.1% in utilities. These increases indicate strong demand for skilled workers in sectors directly or indirectly supporting the AI expansion. The elevated wage growth in these areas suggests that employers are competing for a limited pool of qualified talent, pushing up compensation and highlighting the health of labor demand within these crucial segments of the economy despite a general slowdown in overall jobs growth.
-
How do rising memory-chip costs and tariffs affect durable goods and consumer electronics prices?
💡Rising memory-chip costs and tariffs are significantly affecting durable goods and consumer electronics prices by driving up production expenses and import costs. Specifically, prices for computers, peripherals, and smart home assistants surged 3.2% month-over-month in July, reflecting the impact of higher memory-chip costs tied to the ongoing AI buildout. This indicates that increased demand and supply chain dynamics in the technology sector are translating into higher consumer prices for electronics. Additionally, motor vehicle parts and equipment prices rose 1.0% month-over-month, which may reflect tariff-related cost pass-throughs. The overall durable goods prices increased 0.3% month-over-month, suggesting that tariffs, alongside the AI buildout, continue to keep goods inflation sticky at 3.9% year-over-year in July, despite some moderation in other areas.
-
How does the Bank of America's consumer spending data reflect the current economic environment?
💡Bank of America's July Consumer Checkpoint data reflects a resilient, though slightly moderated, current economic environment for consumers. Total card spending slowed from 6.3% year-over-year in June to 5.0% in July, primarily attributed to the fading of online promotions and World Cup spending. Despite this moderation, the 5.0% spending growth was still one of the three strongest readings of the past three years. Furthermore, spending excluding gasoline rose by 4.3%, indicating underlying strength in consumer demand beyond volatile energy prices. This data supports the view that consumers are largely healthy, capable of withstanding economic pressures, and continuing to spend, aligning with the narrative of a robust consumer sector.
-
What does the New York Fed's Household Debt and Credit Report reveal about consumer financial stress?
💡The New York Fed's Household Debt and Credit Report reveals little evidence of significant consumer financial stress, indicating a stable and resilient consumer base. Transitions into early and serious delinquency were broadly stable in July, with only modest increases observed in auto-loan and mortgage transitions. Bankruptcies remain at historically low levels, further underscoring the absence of widespread financial distress. Additionally, third-party collections ticked lower to 4.9%. These indicators collectively suggest that despite economic uncertainties, the majority of consumers are managing their debt obligations effectively, and their financial health is not currently a major source of concern regarding broader economic stability or potential downturns.

