Executive Summary:
Consumer spending has been remarkably resilient, growing for the past two years faster than consumers’ disposable incomes have and depressing their saving rate. Current trends point to a negative saving rate by 2030. But that’s nothing to worry about, explain Ed and Elias. What we have isn’t a “K-shaped” economy, with the affluent spending briskly and everyone else struggling to make ends meet, as many assume. It’s a “G-shaped” economy—generational factors explain the data anomaly. The massive ranks of retired Baby Boomers, with no paychecks anymore but plenty of assets and leisure time, are keeping spending aloft. … Check out the accompanying chart collection.
Consumer Spending I: The ‘G-Shaped’ Economy
Inflation-adjusted consumer spending rose 2.1% y/y in May to a new record high, while the rate of real disposable income growth was unchanged from the year-earlier level, extending a streak of spending outpacing income to 24 consecutive months. If current trends continue, inflation-adjusted consumer spending will exceed total disposable income by 2030.
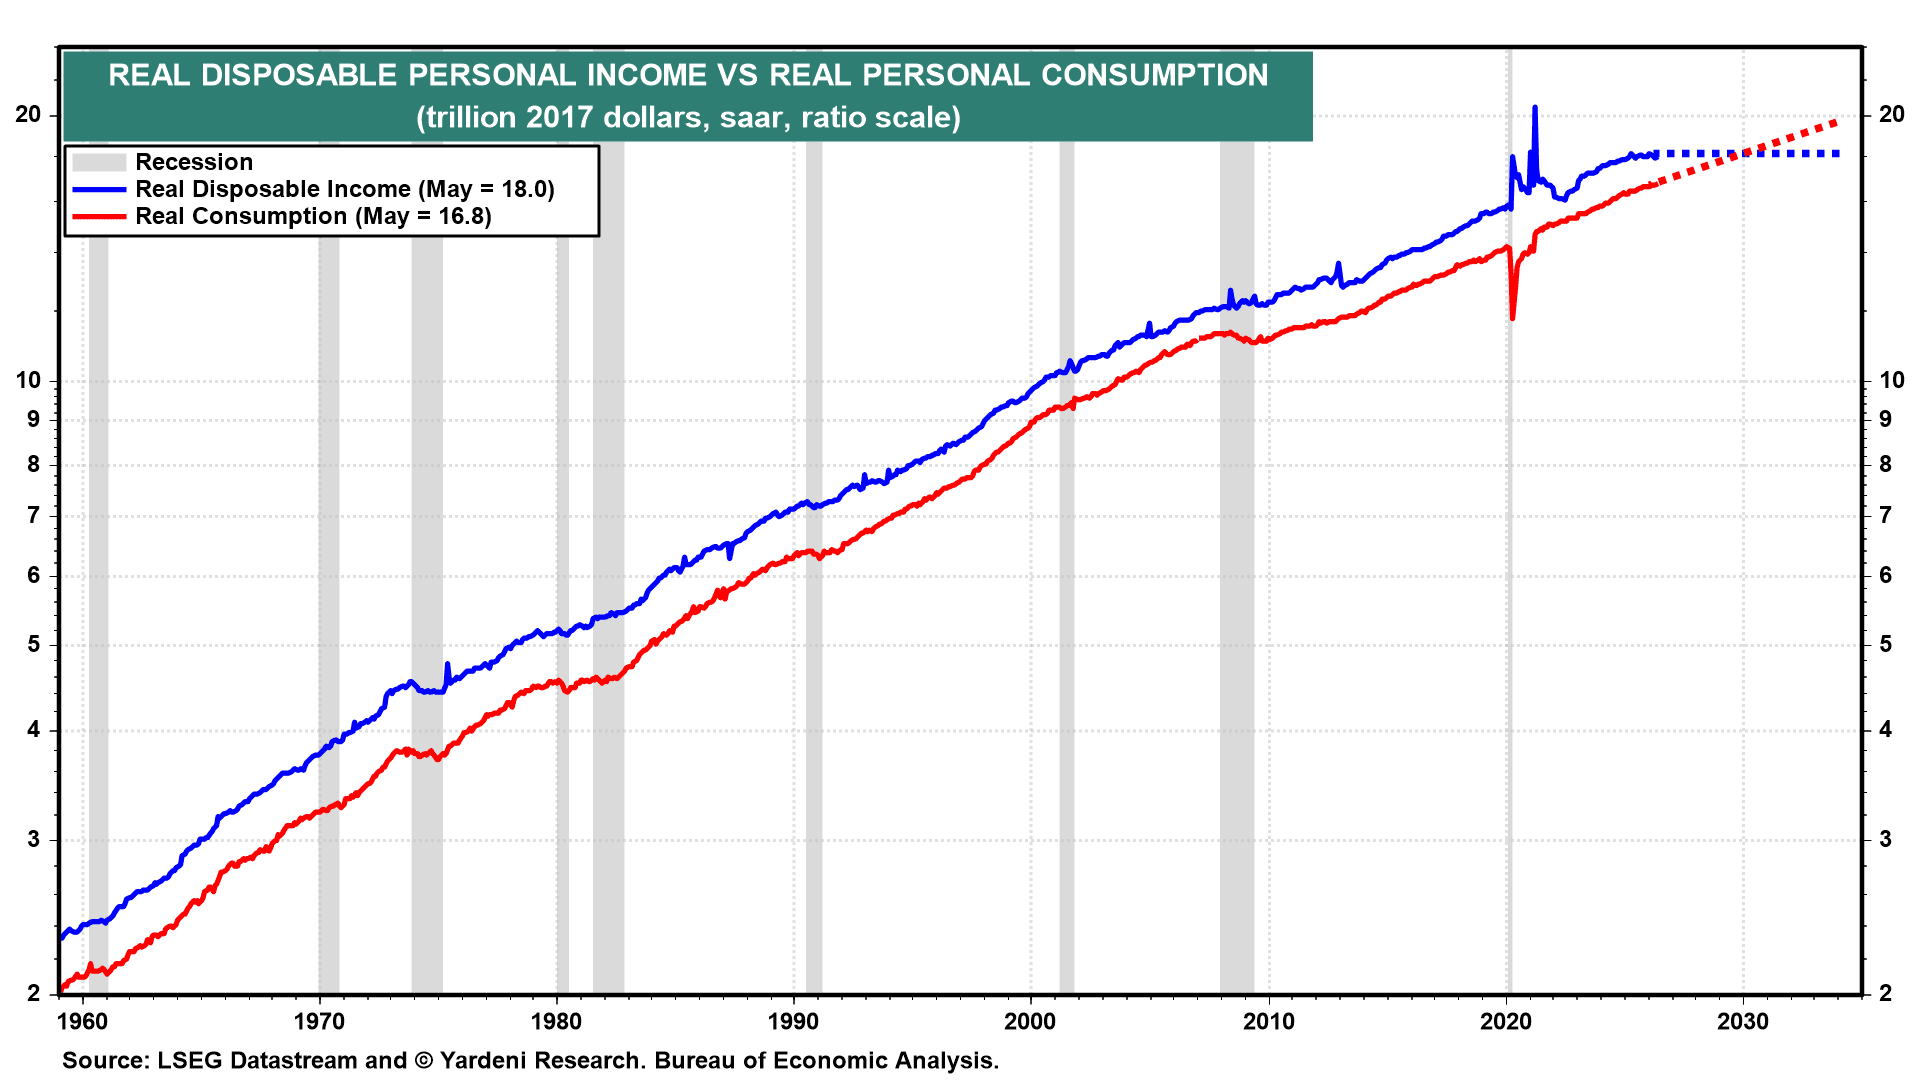 ▌View Related Live Charts: US - Saving Rate vs. Consumption Expenditures
The personal saving rate would then turn negative in this scenario. This is already prompting the economy’s naysayers to say this...
 Get answers from MM AI.
-
What is the 'G-shaped economy' thesis regarding US consumer spending trends?
💡The 'G-shaped economy' thesis posits that generational factors, particularly the financial behavior of retired Baby Boomers, explain the resilience of US consumer spending despite slowing income growth. This framework suggests that the massive cohort of Baby Boomers, aged 62 to 80, with substantial accumulated assets and increased leisure time in retirement, are actively maintaining high spending levels. Their wealth-funded consumption, rather than current income, drives overall consumer outlays and influences the declining saving rate, differentiating it from the 'K-shaped' economy assumption of affluent-only spending.
-
How do Baby Boomers' spending habits influence the US saving rate?
💡Baby Boomers' spending habits significantly influence the US saving rate by driving it downwards as they retire. As Boomers leave the workforce, they no longer receive high wages and salaries, which slows the growth of aggregate personal income. However, their consumption pace often increases due to more leisure time and access to their substantial accumulated net worth. This shift from income-funded to wealth-funded consumption leads to a declining personal saving rate, which was 3.0% in May, its lowest since June 2022, and is projected to turn negative as this trend continues.
-
Why is the US personal saving rate projected to turn negative by 2030?
💡The US personal saving rate is projected to turn negative by 2030 because consumer spending has consistently outpaced disposable income for 24 consecutive months, a trend that is not sustainable under current conditions. This decline primarily stems from the retirement of the Baby Boomer generation, who are increasingly relying on their accumulated $89.8 trillion net worth and retirement income rather than current labor income to finance their consumption. This shift replaces high-wage income with wealth-funded spending, reducing the aggregate saving rate despite continued robust consumer demand.
-
How much household net worth do Baby Boomers currently hold in the US?
💡Baby Boomers currently hold a record 52.0% of total household net worth in the US, amounting to a staggering $89.8 trillion during Q1-2026. Combined with the Silent Generation, seniors account for a total of 63.0%, or $109.4 trillion, of household net worth. This significant wealth provides the financial foundation for their continued high consumption levels, even in retirement, and influences broader economic trends like the declining personal saving rate.
-
What impact does the increasing number of Baby Boomer retirees have on disposable income?
💡The increasing number of Baby Boomer retirees impacts disposable income by exerting downward pressure on its growth rate. As Boomers retire, they cease to receive high wages and salaries, which lowers aggregate personal income measures. Although they continue to spend significantly, their consumption is increasingly funded by accumulated wealth and retirement income rather than current labor income. This shift replaces income-funded consumption with wealth-funded consumption, contributing to a slower growth rate in average hourly earnings and overall disposable income while maintaining strong consumer spending.
-
Which specific consumer spending categories are driven by retiring Baby Boomers?
💡Retiring Baby Boomers are actively driving consumption growth across major categories, particularly in fun-related activities such as gambling, recreation services, spectator amusements, and amusement parks, all of which reached record highs in May. They are also boosting spending on travel services, with air transportation and hotels & motels hitting new record highs. Additionally, their preference for convenience contributes to the surge in online retailers' share of GAFO retail sales, reaching 49% in April, and naturally, spending on health care is also at a record high.
-
What role does the tightening US labor market play in supporting consumer spending?
💡The tightening US labor market supports consumer spending by indicating robust employment conditions and increasing household purchasing power. In May, demand for labor outpaced supply for the first time since June 2025, and the three-month moving average of nonfarm payroll gains rose to a two-year high of 172,000. Job growth is broadening across sectors like leisure and hospitality, construction, and manufacturing. Additionally, initial jobless claims fell to 215,000 in the week ended June 19, confirming subdued layoffs and bolstering consumer confidence and income for working families.
-
How does the 'G-shaped economy' rebut Mark Zandi's 'K-shaped economy' argument?
💡The 'G-shaped economy' rebuts Mark Zandi's 'K-shaped economy' argument by emphasizing demographic factors, particularly the impact of retiring Baby Boomers, who account for a massive, wealth-funded spending bloc largely outside the top 20% of current income earners. While the K-model suggests concentrated spending among the affluent (top 20% driving 60% of outlays), the G-model argues that disappearing paychecks for retirees do not signify distress but a shift from income-funded to wealth-funded consumption. This invalidates the K-model's premise, as Baby Boomers' $89.8 trillion net worth drives significant aggregate consumption, despite their lower current income.
-
How has wage growth for different income groups evolved in the US, according to recent data?
💡Recent data indicate that wage growth for different income groups has evolved in a way that challenges the 'K-shaped economy' narrative. Bank of America's May internal data show payroll growth driven by job gains among lower-income workers. After-tax wage growth improved for lower-income households to 3.1% year-over-year and for middle-income households to 3.5% year-over-year. In contrast, higher-income wage growth eased to 5.6% year-over-year. This narrowing of wage growth differentials among income groups supports an economy that is less K-shaped and more broadly distributed.
-
What is the main shared tail risk between the G-shaped and K-shaped economy frameworks?
💡The main shared tail risk between the G-shaped and K-shaped economy frameworks is the 'wealth effect,' specifically the potential for a negative impact from a deep and prolonged bear market in stocks. One-third of Baby Boomers' $90 trillion in net worth is invested in equities and mutual fund shares. A substantial decline in these asset values could cause consumers, particularly wealth-dependent retirees, to retrench their spending, posing a risk to sustained consumption levels under both economic frameworks.
