Executive Summary:
Consumer spending may seem to be defying economic gravity—remaining robust in the face of depressed consumer confidence, affordability concerns, and elevated interest rates. Indeed, the saving rate is dropping toward zero and could even turn negative by the end of the decade. Today, Ed and Elias explain why that’s no worry; why consumer spending has been so resilient, like the economy itself this decade; and why they expect the resilience of both to continue. … Also: Inflationary expectations are on the rise. That raises the risk that so are secondary inflationary effects from this year’s inflationary shocks. And that raises the probability that the Fed’s September rate hike won’t be the last this year. … Check out our chart collection.
US Consumer I: Still Going Strong
We are now seven years into our Roaring 2020s thesis, which remains our base case for the rest of the decade, and it has played out very well so far. When we first introduced the idea in August 2020, the prospect of another Roaring ’20s sounded a bit delusional. We argued that, as in the 1920s, rapidly proliferating technologies would drive a productivity boom that would support stronger economic growth while containing inflation, boosting real wages, widening profit margins, and lifting corporate earnings. Seven years later, the economy repeatedly has defied the naysayers with its resilience.
That resilience has been particularly evident in the consumption data, with spending remaining remarkably robust despite widespread reports about affordability concerns, elevated interest rates, and depressed consumer confidence. Let’s have a look:
(1) Real consumer spending remains robust. Consumers started the year on a weaker footing. Real spending grew just 0.7% (saar) in Q1, the weakest since Q1-2025.
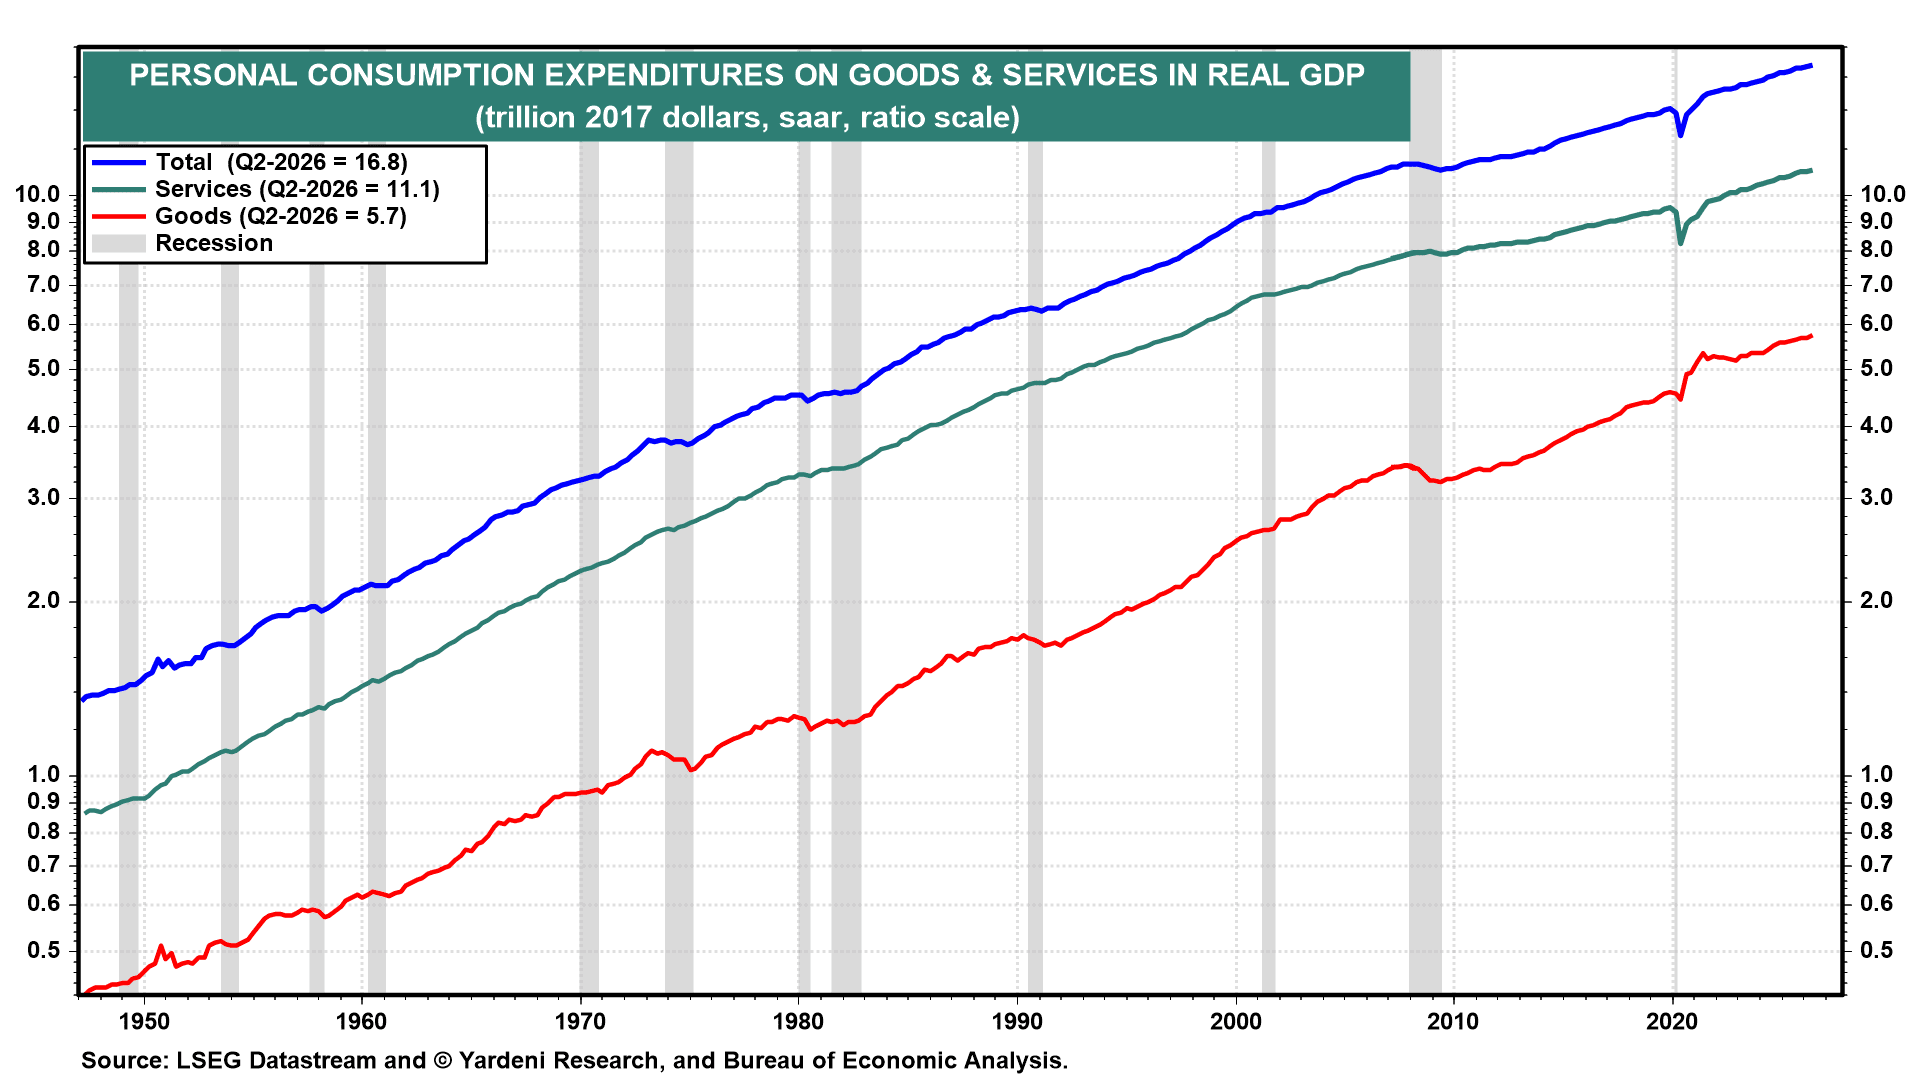 ▌View Related Live Charts: US - Real PCE - Goods & Services
But we looked through the slowdown, arguing that severe winter weather had temporarily restrained demand.
We expected a rebound, and we got one. Real consumption surged 3.8% (saar) in Q2, the strongest since Q4-2024. After edging up 0.1% m/m in July, spending jumped 0.6% in August, its biggest gain since March 2025 and well above the historical monthly average of 0.2%. On a y/y basis, spending rose 2.6% in August versus a historical average of 2.2%.
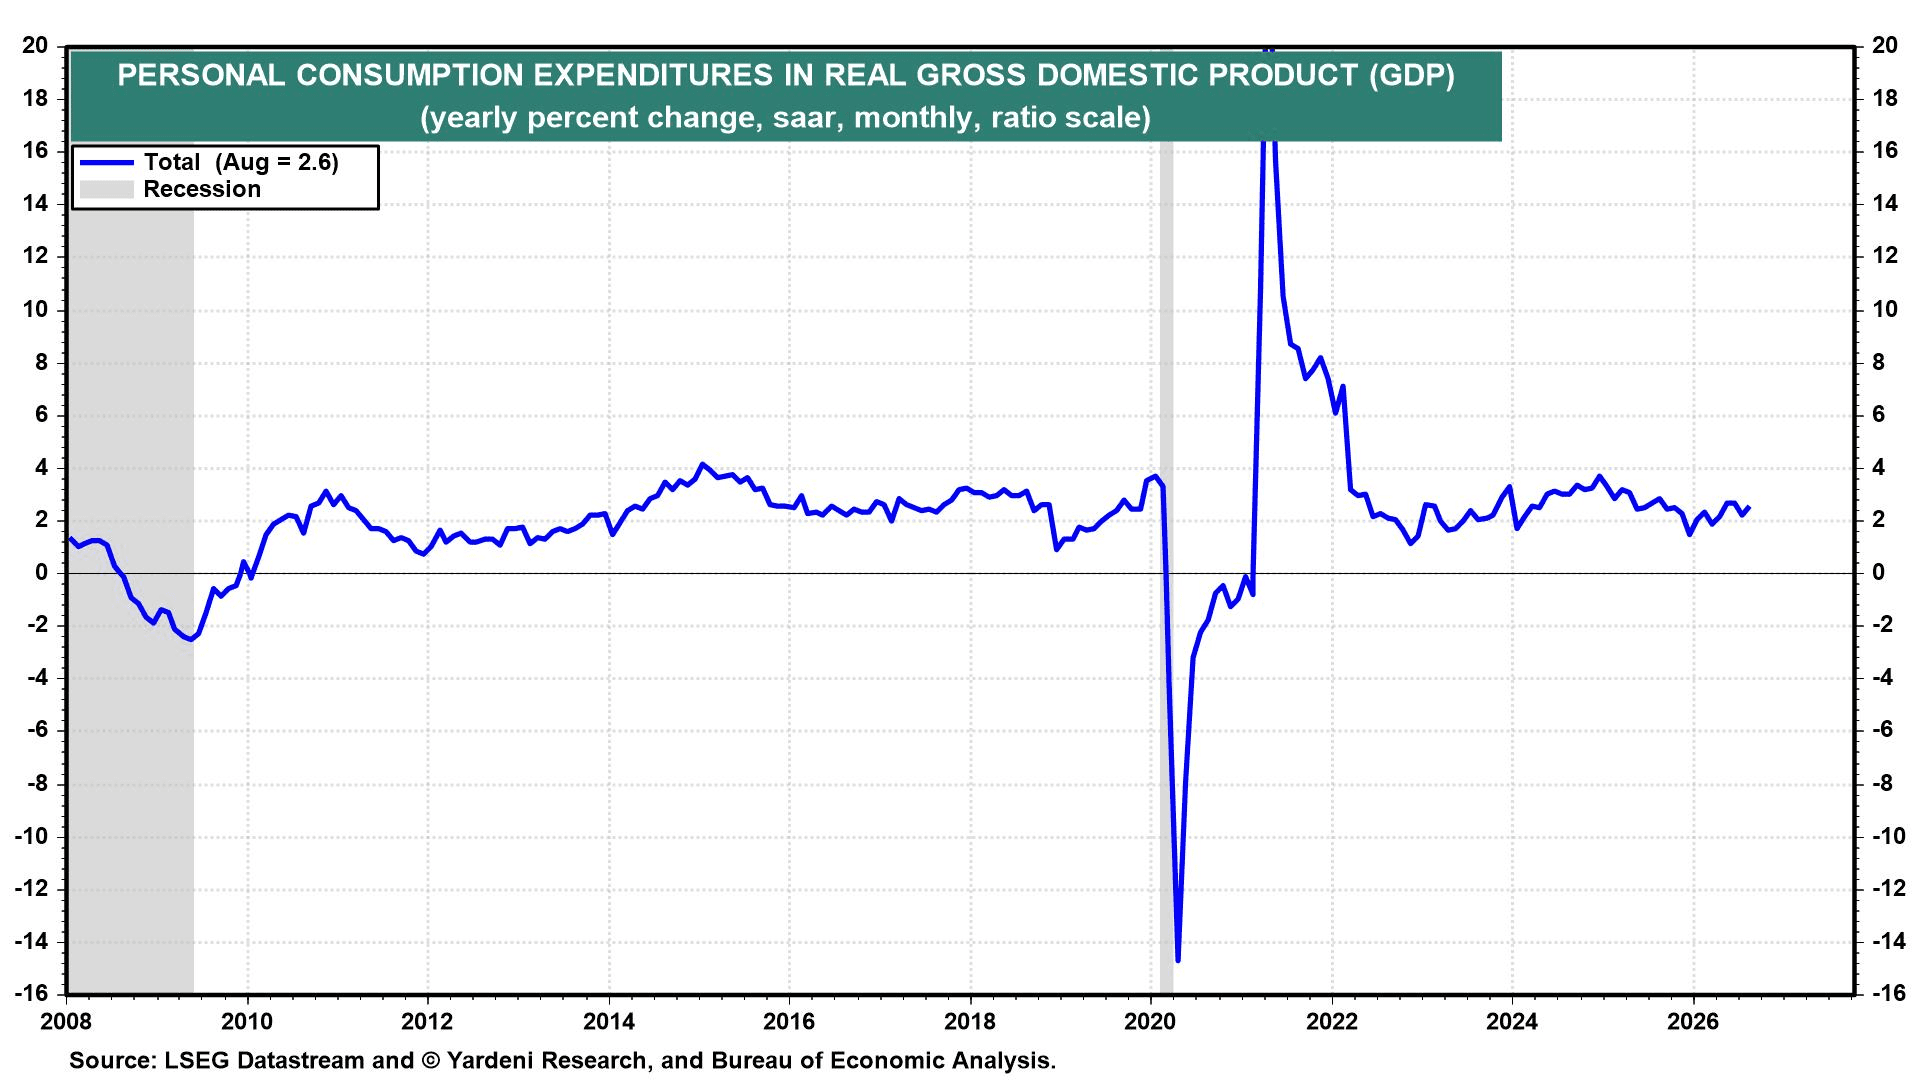 ▌View Related Live Charts: US - Real PCE - Goods vs. Services
For Q3 as a whole, the Atlanta Fed’s GDPNow model estimates...
Already a subscriber? Click here to log in.
Full Access to Our Services

Comprehensive data at your service
with key indicators for investment insights

Exclusive flash reports
on key events and data

Create your own charts and analysis
including performance backtesting

Hub of professionals to engage
in meaningful discussions and insights
 Get answers from MM AI.
-
What factors contribute to the US economy's resilience in the Roaring 2020s thesis?
💡The US economy's resilience in the Roaring 2020s thesis is primarily attributed to rapidly proliferating technologies driving a productivity boom, which supports stronger economic growth while containing inflation, boosting real wages, widening profit margins, and lifting corporate earnings. This framework, introduced in August 2020, suggests the economy has consistently defied negative outlooks, with consumer spending remaining robust despite affordability concerns, elevated interest rates, and low consumer confidence, particularly evident in strong consumption data.
-
What do Bank of America's card data indicate about consumer spending resilience in September?
💡Bank of America's September Consumer Checkpoint survey data indicate robust consumer spending resilience, with credit and debit card spending per household up 6.2% year-over-year, or 5.1% excluding gasoline; both rates were the third strongest in four years. Retail spending, excluding gasoline, increased 3.5%, while services spending rose 5.4%. Nearly 86% of more discretionary retail categories registered spending gains, accounting for over 94% of spending in these categories, and transaction counts increased in 71%, suggesting more purchases rather than solely higher prices.
-
How has consumer spending growth broadened across different income groups recently?
💡Consumer spending growth has recently broadened across different income groups, reversing a trend from 2025 and early 2026 where high-income households led growth. In September, Bank of America reported that card spending per household increased 5.5% year-over-year among lower-income consumers, compared to 4.9% and 4.8% for middle- and higher-income households, respectively. Only the top 5% of earners saw slightly faster growth at 5.9%, driven by wealth rather than solely wage gains, and discretionary spending growth has become more balanced across these groups, supported by after-tax wage and salary growth reaching 4.5% year-over-year for lower-income households.
-
Why does consumer spending remain robust despite depressed consumer sentiment?
💡Consumer spending remains robust despite depressed consumer sentiment primarily due to the wealth boom, which reached a record $185.6 trillion in household net worth in Q2, representing a 52.5% increase since Q4 2020. This substantial wealth, especially among asset-rich Baby Boomers, allows households to sustain consumption without relying exclusively on current income. Additionally, forward-looking measures from the New York Fed's September Consumer Expectations survey indicate rising expected spending growth (5.5%) and income growth (3.1%), alongside a decreased perceived probability of job loss (13.5%), suggesting consumers may be feeling more optimistic about their future prospects than current sentiment indices reflect.
-
What explains the divergence where consumption growth outpaces disposable income growth?
💡The divergence where consumption growth outpaces disposable income growth is primarily explained by the wealth boom. In August, real consumption increased 2.6% year-over-year, while real disposable income grew only 1.3%, marking the seventh consecutive month of this trend. Since January 2020, real spending has climbed 19.1% versus 16.2% for disposable income. This phenomenon is supported by household net worth reaching a record $185.6 trillion in Q2, up 52.5% since Q4 2020, as wealthier households feel less need to save from current income, leading the personal saving rate to fall to 4.1% in August, its lowest since November 2022.
-
Could the personal saving rate turn negative by the end of the decade, and why?
💡Yes, the personal saving rate could turn negative by the end of the decade, as more Baby Boomers draw on their accumulated wealth rather than saving from current income. Extrapolating recent trends suggests that real consumption could exceed real disposable income around 2030. This potential sub-zero saving rate should not cause alarm, as asset-rich retirees can sustain their consumption without needing to rely exclusively on current income, leveraging their substantial household wealth from earlier working lives.
-
What inflationary shocks are currently putting upward pressure on prices in the US?
💡Three primary inflationary shocks are currently exerting upward pressure on prices in the US: the AI buildout, rising oil prices, and tariffs. Additionally, the resilient economy is contributing to services inflation, further complicating the Federal Reserve's efforts to achieve its 2.0% year-over-year inflation target. These factors increase the risk of secondary inflationary effects, where businesses and workers might embed higher inflation into pricing and wage decisions.
-
Why does the Federal Reserve consider 'insurance hikes' despite inflation shocks?
💡The Federal Reserve considers 'insurance hikes' despite ongoing inflation shocks because the longer inflation remains above target while shocks persist and demand stays strong, the greater the danger of second-round inflationary effects. These effects could lead businesses and workers to embed higher inflation into prices and wages, potentially necessitating more aggressive monetary tightening later. By raising rates now, even if they cannot directly reverse the shocks, the Fed aims to lean against this risk and prevent higher expected inflation from becoming entrenched, thereby reducing the probability of needing harsher measures in the future.
-
How have consumer inflation expectations shifted according to recent surveys?
💡Consumer inflation expectations have shifted higher according to recent surveys. The New York Fed's September survey showed consumers expect inflation rates of 3.9% year-over-year in one year (the highest since May 2023), 3.3% in three years, and 3.0% in five years. The University of Michigan’s preliminary October survey reported year-ahead expectations at 4.7% and longer-run expectations at 3.5%. While longer-term measures remain comparatively stable, the rise in shorter-term readings is a notable concern, signaling a potential de-anchoring of expectations.
-
What do market-model estimates suggest about longer-term inflation expectations?
💡Market-model estimates suggest longer-term inflation expectations are drifting higher, even if breakeven inflation rates appear calm. The Fed’s D’Amico-Kim-Wei (DKW) model, which separates inflation expectations from risk and liquidity premiums, estimated the 10-year expected inflation at 2.90% on September 30, matching its historical average. More significantly, the five-year estimate reached 2.92%, exceeding its 2.89% average. Both measures have climbed from earlier lows, particularly the five-year measure recently, indicating that relatively calm breakeven rates may be masking underlying increases in model-implied inflation expectations.
