CEO House View | The Worst of the Middle East Conflict Is Behind Us, Fundamentals Are Back in Charge
Dear all,
In April, oil prices remained elevated and volatile, while global equities continued to reach new highs. The dollar and Treasuries saw limited movement, with markets broadly reflecting one key message: the impact of the US–Israel–Iran conflict is gradually fading.
As war concerns eased, markets returned to pricing fundamentals. In terms of equities, global tech stocks demonstrated the greatest strength, with US and Asian markets posting staggering gains and hitting all-time highs. The Philadelphia Semiconductor Index (SOX) led the pack with a massive 31.6% surge. In FX markets, the pullback in the US Dollar Index led to broad-based appreciation among major currencies. In fixed income, yields remained largely unchanged, continuing their prior range-bound volatility. In commodities, ongoing conflict kept crude oil trading at elevated levels, while gold fluctuated amid competing forces and edged slightly lower. Overall, April reflected a market environment where equities surged on fundamentals, while other asset classes remained range-bound.
I. The US-Israel-Iran War: The Market Has Tested Trump's Bottom Line
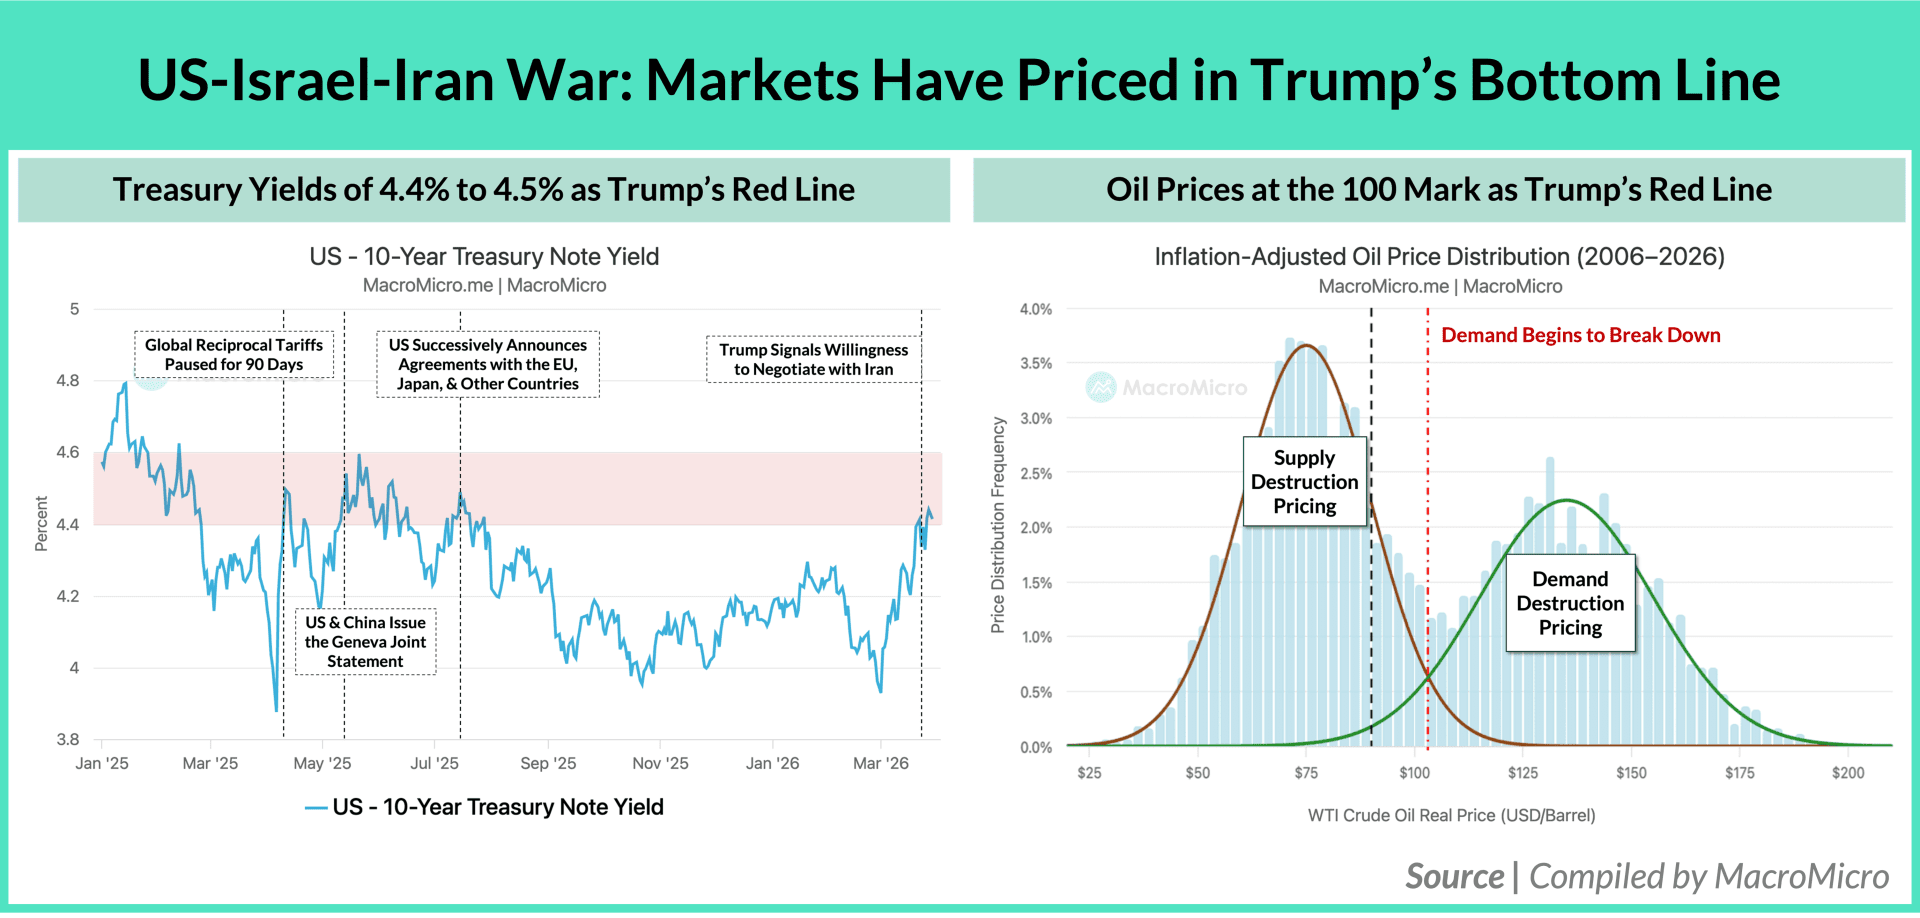
The key reason the market is gradually shrugging off the US-Israel-Iran war is that investors have largely gauged Trump's bottom line. Observing recent reactions, there are roughly two major pressures that Trump cannot ignore. First, Treasury yields approaching 4.5% indicates a tightening of financial conditions, which would further impact the "interest rates" he cares about most. Second, oil prices breaking above $100 or even $110 per barrel represents the critical price point we mentioned in last month's report where demand begins to take a substantial hit.
Consequently, we have noticed that whenever these two red lines are crossed, Trump's stance begins to marginally soften. The most obvious example occurred in early April. The moment WTI crude broke above $110 and Treasury yields neared 4.5%, Trump quickly changed his tune, stating that the war could end within two to three weeks, and later alleviated market pressure through a phased ceasefire. This logic is quite similar to previous tariff issues: when policies simultaneously impact inflation, interest rates, and demand, the market forces a policy correction. Once this bottom line is tested and established, risk assets will re-price to reflect that the "worst is over," even if the market experiences further volatility.
Moving forward, we will be monitoring two things: 1) whether the aforementioned logic changes; and 2) as mentioned in last month's report, whether negotiations within a 90 to 120-day timeframe effectively end the war, or at least suppress oil prices back below $100. As long as this logic holds, the conclusion of the conflict within the next two months (the war has already been ongoing for over 60 days) will prevent the oil market's supply gap from widening further and avoid demand destruction. This remains our base-case scenario.
II. Fundamentals Reassert, Unshaken by Conflict
Beyond the above factors, March’s economic and industry data further confirmed that current fundamentals have not been significantly disrupted by the war. This aligns with our earlier assessment: the recent market correction should be viewed primarily as a...
This in-depth analysis of the Middle East conflict, Trump’s policy red lines, surging AI demand, and the resilient semiconductor cycle is exclusive to MM Max subscribers. Gain full access to the complete report, detailed Taiwan export data, our 20+ page AI supply chain compilation, and continued coverage of global markets and geopolitical risks. Subscribe Now»
Already a subscriber? Click here to log in.
Full Access to Our Services

Comprehensive data at your service
with key indicators for investment insights

Exclusive flash reports
on key events and data

Create your own charts and analysis
including performance backtesting

Hub of professionals to engage
in meaningful discussions and insights
 Get answers from MM AI.
-
How did global equities perform in April after US-Israel-Iran conflict concerns eased?
💡Global equities experienced a sharp rebound in April as concerns over the US-Israel-Iran conflict eased, with global tech stocks showing the greatest strength. US and Asian markets achieved staggering gains, reaching all-time highs. The Philadelphia Semiconductor Index (SOX) led this surge with a massive 31.6% increase, reflecting a market environment where fundamentals reasserted themselves.
-
Which asset classes remained range-bound despite the equity surge in April?
💡Despite the significant equity surge in April, several other asset classes remained range-bound. These included fixed income, where yields were largely unchanged and continued their prior range-bound volatility. In commodities, crude oil remained at elevated levels due to ongoing conflict, while gold fluctuated amid competing forces, ultimately edging slightly lower.
-
What two major pressures influence Trump's foreign policy decisions?
💡Two major pressures that significantly influence Trump's foreign policy decisions are Treasury yields approaching 4.5% and oil prices breaking above $100 or even $110 per barrel. Treasury yields at 4.5% signal a tightening of financial conditions, impacting interest rates he prioritizes, while oil prices exceeding $100-$110 per barrel represent a critical point where demand experiences a substantial hit.
-
How do Treasury yields above 4.5% affect financial conditions?
💡Treasury yields approaching 4.5% indicates a tightening of financial conditions, which would further impact the interest rates that are a primary concern for Trump. This level serves as a significant pressure point that can influence policy decisions and market reactions, reflecting increased borrowing costs and potential economic slowdowns.
-
At what oil price point does demand begin to take a substantial hit?
💡Demand begins to take a substantial hit when oil prices break above $100 or even $110 per barrel, representing a critical price point for the market. This threshold has been identified as a key factor influencing policy corrections, as such elevated prices can significantly impact inflation, interest rates, and overall economic demand.
-
How did Trump's stance soften when WTI crude exceeded $110 and Treasury yields neared 4.5%?
💡When WTI crude exceeded $110 per barrel and Treasury yields neared 4.5% in early April, Trump's stance began to marginally soften. He quickly changed his tune, stating that the war could end within two to three weeks, and subsequently alleviated market pressure through a phased ceasefire. This demonstrated a pattern of policy correction when these red lines are crossed.
-
Why is the recent market correction considered a 'valuation correction' instead of an 'earnings correction'?
💡The recent market correction is considered a 'valuation correction' rather than a painful 'earnings correction' because underlying fundamentals have not been significantly disrupted by the war. Economic and industry data from March confirmed this view, with strong AI demand continuing to exceed expectations, preventing a deterioration into widespread earnings issues.
-
What is the core reason for the sustained market performance according to MacroMicro?
💡The core reason for the sustained market performance, according to MacroMicro, is the exceptional strength of AI demand, which continues to far exceed expectations. This robust demand is driving significant investment and computing power, particularly in the semiconductor cycle, thereby preventing the market correction from deteriorating into an earnings correction.
-
What trend in AI model competition indicates continued investment and computing power demand?
💡The fierce competition among the three major AI model camps (ChatGPT, Gemini, Claude, and GPT 5.5) indicates continued investment and computing power demand, regardless of which model ultimately wins the race. This ongoing rivalry ensures a continuous cycle of innovation, driving further investment in computing infrastructure and strengthening the semiconductor cycle.
-
What does Taiwan's Q2 export value likely indicate for economic growth this year?
💡Taiwan's Q2 export value is highly likely to cross the $70 billion mark, with a chance of approaching $80 billion by year-end, indicating strong economic growth. This trend suggests that even with a higher base period, subsequent export growth can maintain double digits and potentially exceed 30%, leading Taiwan's economic growth this year to replicate last year's strong performance, landing at an exceptionally strong 8%.
