Q1. Q1 2026 earnings broadly beat expectations despite elevated oil prices. What actually drove that outcome?
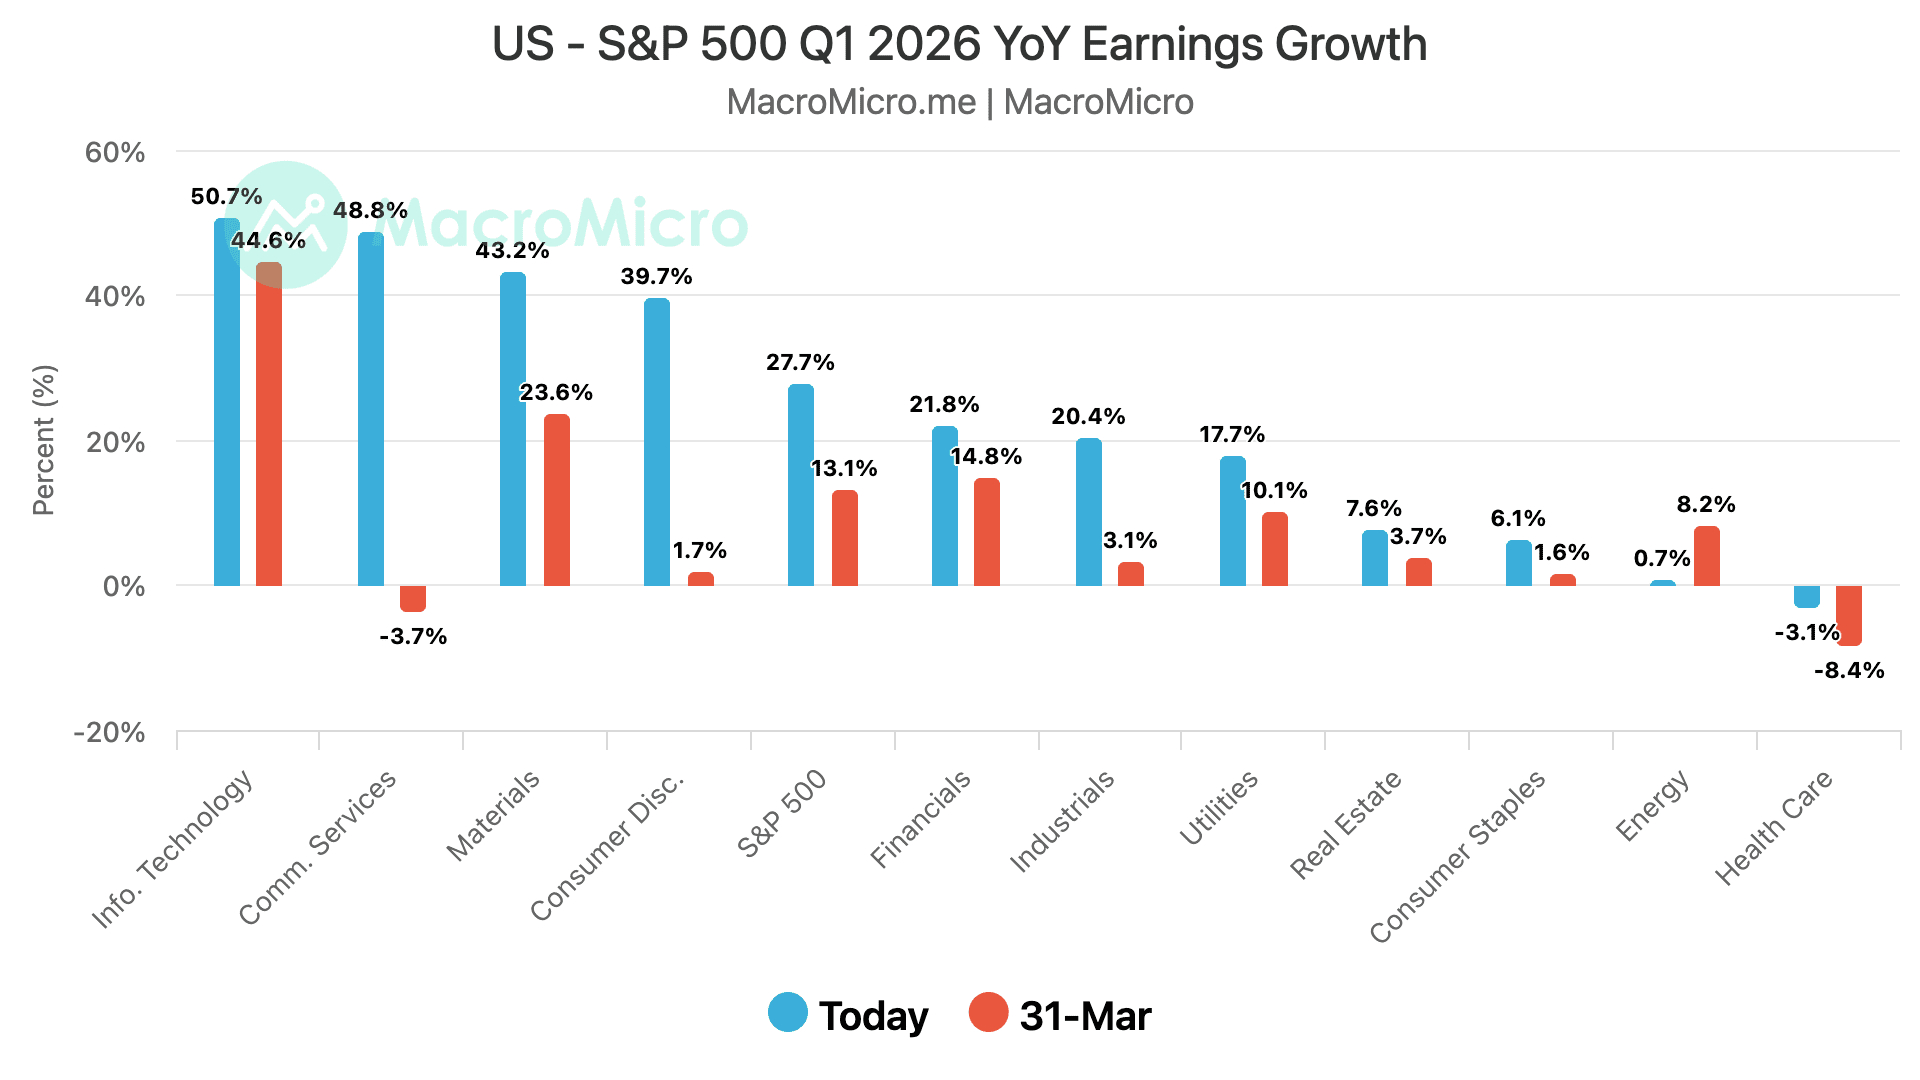
A: Oil prices, which spiked following US-Iran tensions in late February, concentrated their increase at the end of Q1 rather than across the full quarter, which limited the impact on realized input costs. More importantly, AI-related demand appears to have functioned as an offsetting structural tailwind. According to FactSet data through May 8, 89% of S&P 500 companies have reported, with 84% exceeding EPS estimates; that beats rate compares favorably to the five-year average of 78% and the ten-year average of 75%. Overall earnings growth came in at 27.7%, well above prior consensus. The two highest-performing sectors were Information Technology, with earnings growth above 50%, driven primarily by NVIDIA (EPS of $1.74 in Q1 2026 versus $0.76 in Q1 2025) and Micron (EPS of $12.20 versus $1.41 a year earlier), and Communication Services, where Google's outperformance drove both the growth rate and the largest upward revision of any sector. Earnings call transcript analysis shows that AI was mentioned far more frequently than oil or inflation, confirming that management attention remains focused on AI-driven demand capture, not commodity cost management.
Related Reading: The Biggest Is Yet to Come
Q2. Q2 earnings guidance and full-year forecasts were also revised upward after a strong Q1. How much confidence should we place in that forward path?
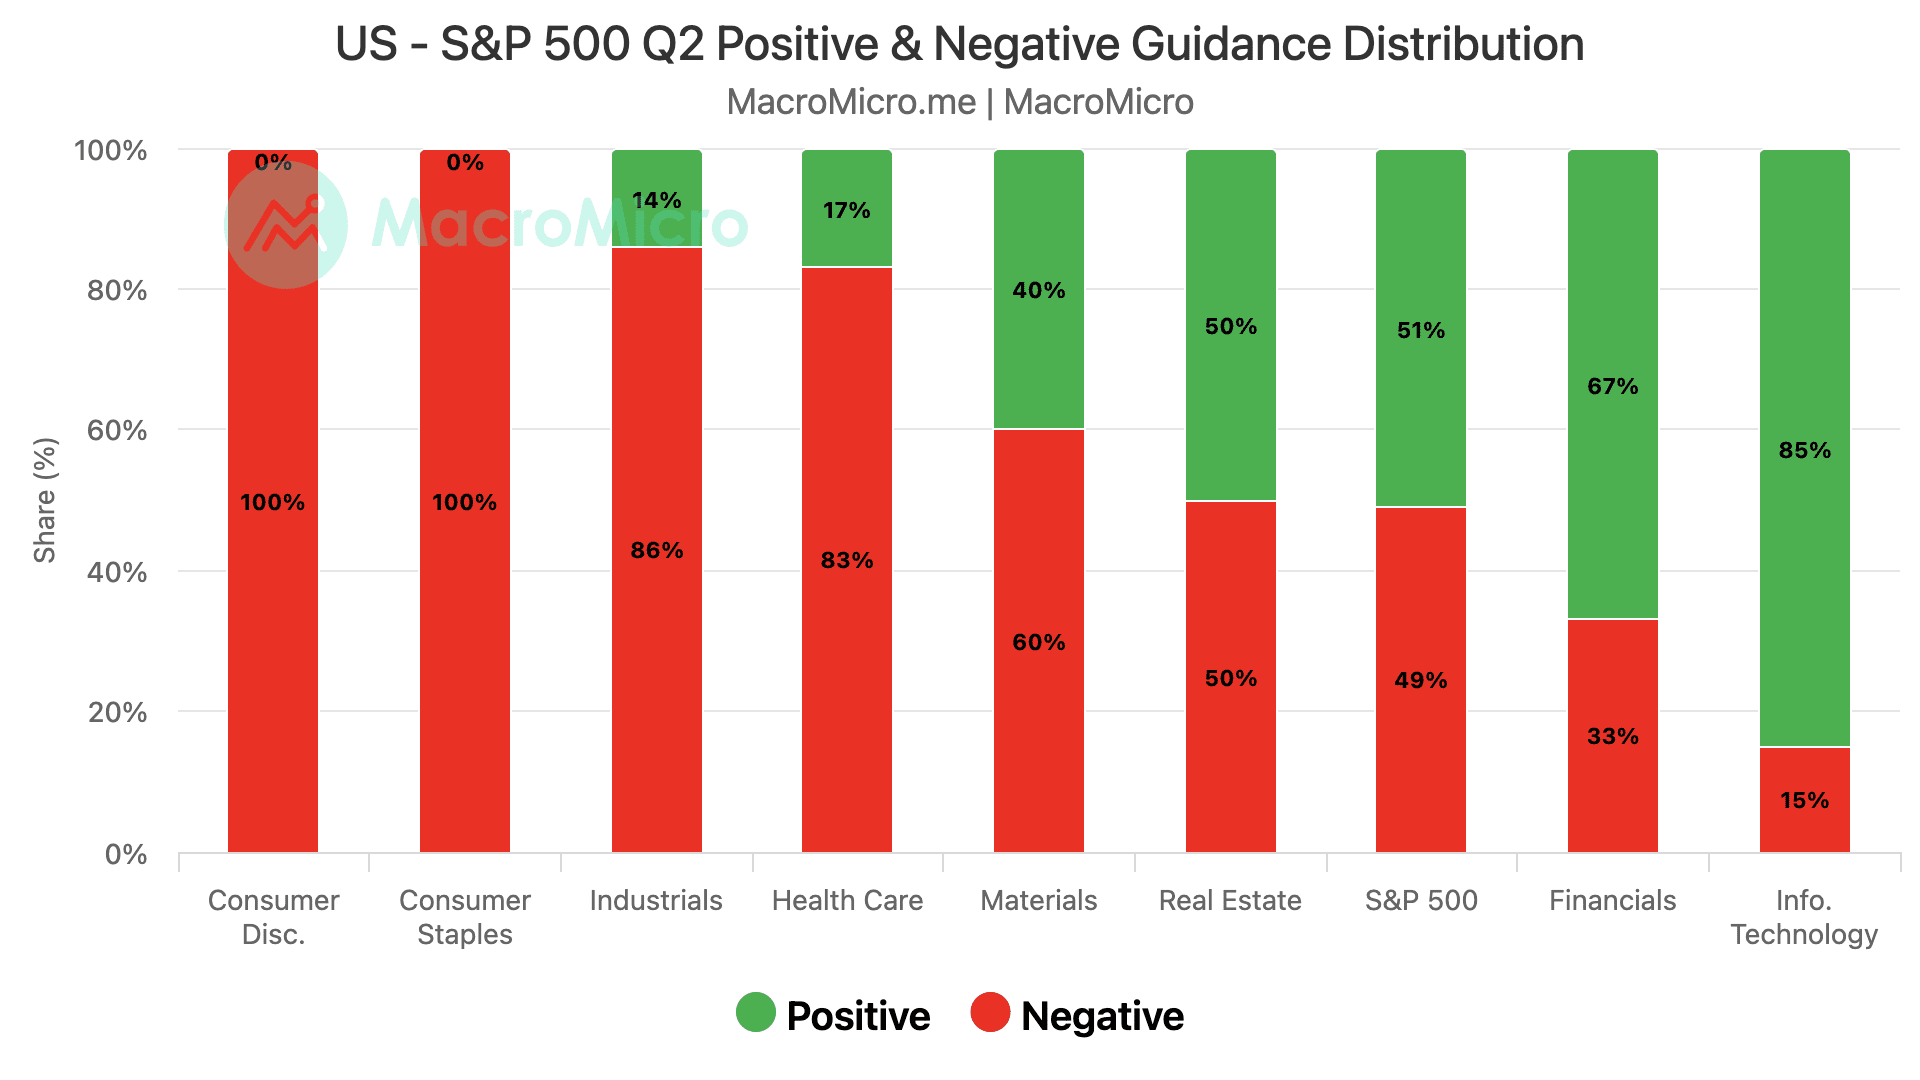
A: The guidance data is encouraging on its own terms. Of the 77 companies that provided Q2 EPS guidance as of May 8, 51% issued positive guidance, well above the five-year average of 42% and the ten-year average of 40%. Consensus now expects Q2 earnings growth of 19.9% and full-year 2026 growth of 21%. The revision direction is upward across ten of the eleven S&P 500 sectors. Healthcare is the lone exception, with Q1 earnings declining 3.1%, primarily due to one-time charges at Merck and COVID-related revenue normalization at Pfizer, though that miss was narrower than the 8.4% decline anticipated at the end of March. Energy's Q1 result was also softer than expected, but for accounting timing reasons rather than demand deterioration, and Q2 guidance for that sector is already being revised higher. The primary risk to the forward path is not oil or geopolitics based on current signals, but a deceleration in AI capital spending that has not yet appeared in any CSP guidance or earnings call commentary.
Related Reading: The Biggest Is Yet to Come
Q3. The major cloud providers still keep raising their capital expenditure targets. What is actually justifying this level of spending?
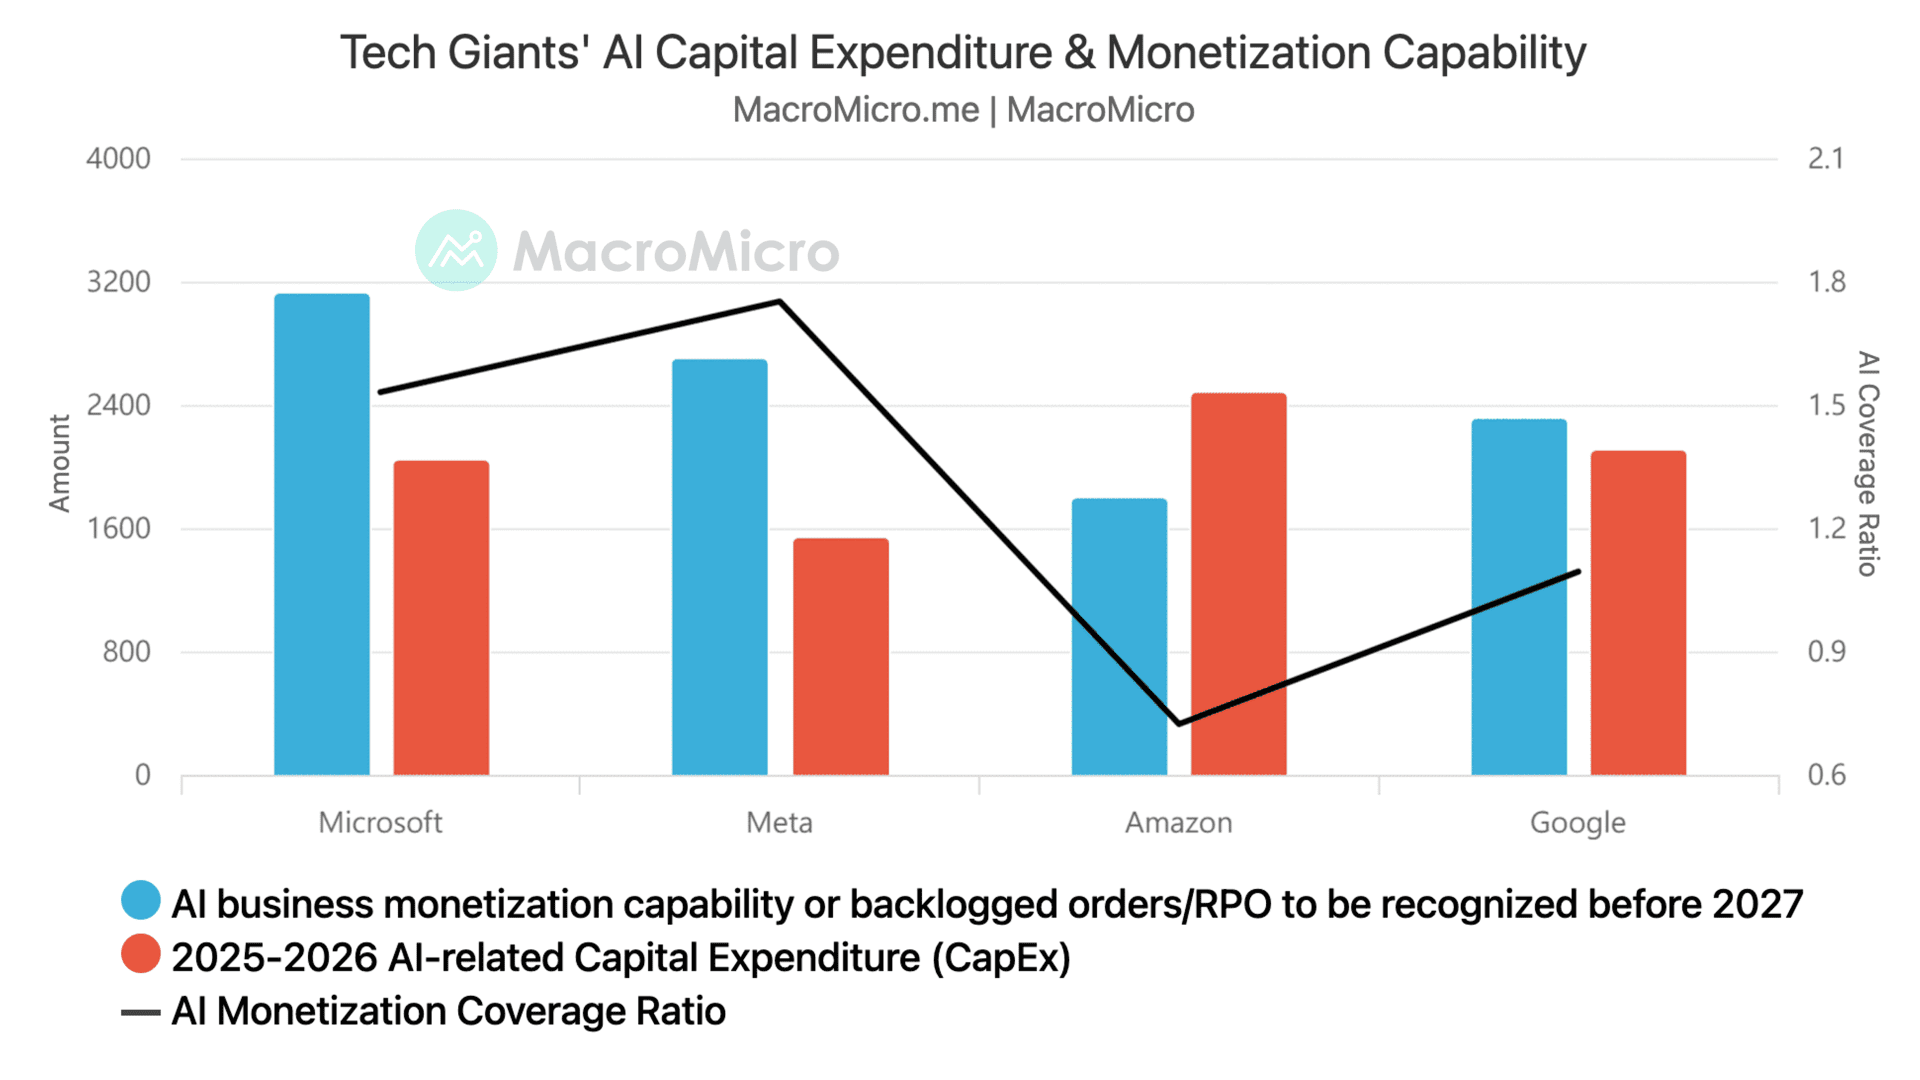
A: The market's comfort with escalating capex stems from a critical shift in how that spending is being underwritten. The four major cloud providers, Google, Amazon, Microsoft, and Meta, are no longer operating purely on the premise of "spend now, monetize later." They are entering contracts first and building to fulfill committed demand. Google holds $462 billion in remaining performance obligations, with half expected to be recognized within 24 months. Amazon's AI services are now generating an annualized revenue run rate above $15 billion, growing at triple digits year over year. Microsoft's commercial RPO stands at $627 billion. The ratio that matters here is what we call AI monetization coverage: estimated forward AI revenues or near-term RPO divided by AI-related capex. For Meta, Microsoft, Google, and Amazon, that ratio currently stands at approximately 1.8, 1.5, 1.1, and 0.7, respectively. Even the lowest figure, Amazon, is operating within an acceptable range given that the AI Agent expansion is still in its early stages. The risk of a capex bubble is real but currently contained by visible, contracted revenue streams.
Related Reading: The AI Race Is No Longer Zero-Sum: Why Intensifying Competition May Be Extending the Infrastructure Supercycle
Q4. AI companies are posting strong revenue growth, but the infrastructure investment is enormous. At what point does this business actually become profitable, and what should we be tracking to know when that inflection is approaching?
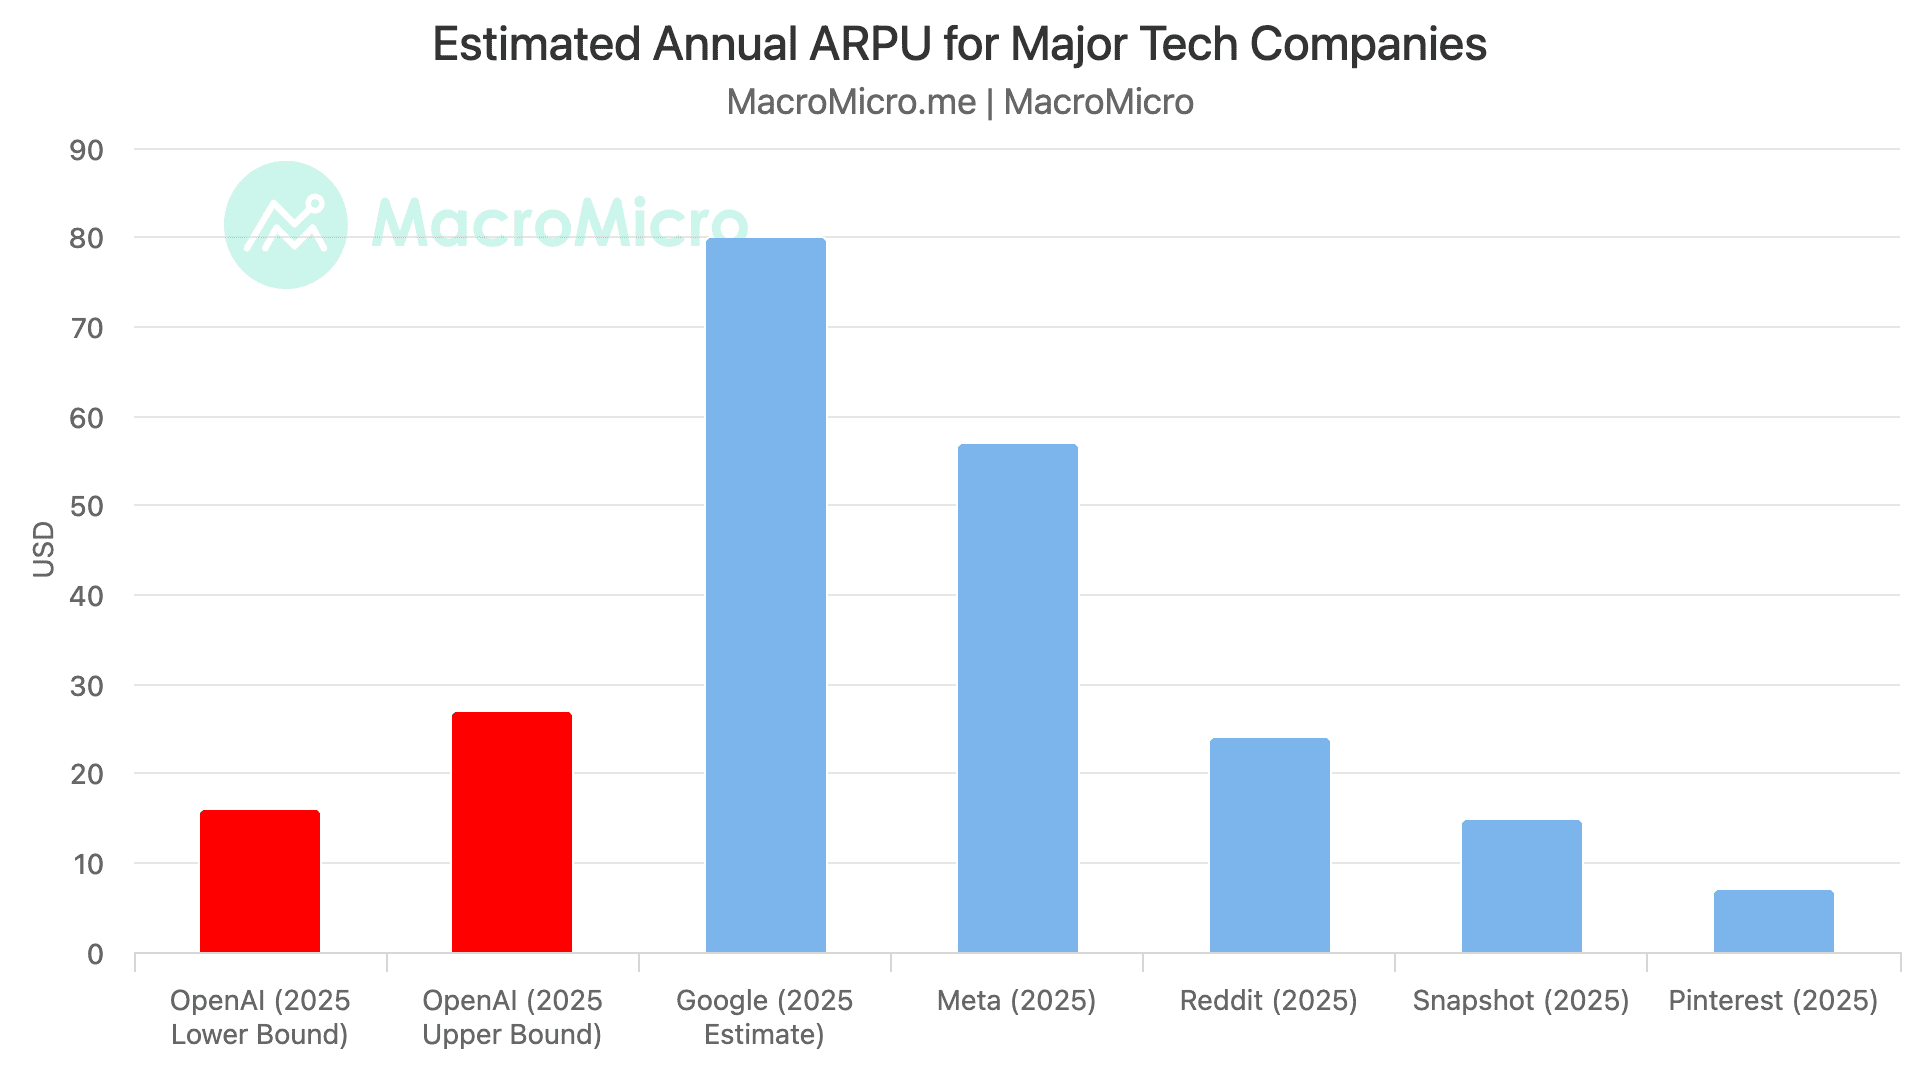
A: The profitability inflection depends on two trends converging simultaneously. On the cost side, inference hardware efficiency is improving at roughly 60 to 70% annually, driven by successive GPU and custom silicon generations, meaning the cost to serve each token continues falling rapidly. On the revenue side, token pricing declined at approximately 40% annually over the past two years under intense model competition, but leading providers are now showing stabilization. Margins improve when cost falls faster than price, and Goldman Sachs estimates that gross margin inflection for major cloud providers and model vendors could arrive within the next twelve months. The more important long-run driver is volume. A basic LLM interaction consumes roughly 1,000 tokens; an always-on autonomous agent can exceed 100,000 daily. Goldman Sachs projects global token consumption growing more than 24 times by 2030. At that scale, even compressed per-token margins generate substantial absolute profit. The two metrics worth tracking continuously are ARPU and token consumption growth. OpenAI's current annualized ARPU sits at roughly $16 to $27, compared to Meta's approximately $57 and Google's approximately $80: the gap between AI providers and established platform businesses quantifies both the remaining risk and the upside case. If ARPU is closing toward those benchmarks while token volume is accelerating, the profitability path is on track.
Related Reading: The AI Race Is No Longer Zero-Sum: Why Intensifying Competition May Be Extending the Infrastructure Supercycle
Q5. What makes Neocloud providers like CoreWeave operationally different from the major cloud providers, and what specific risks are there to watch?
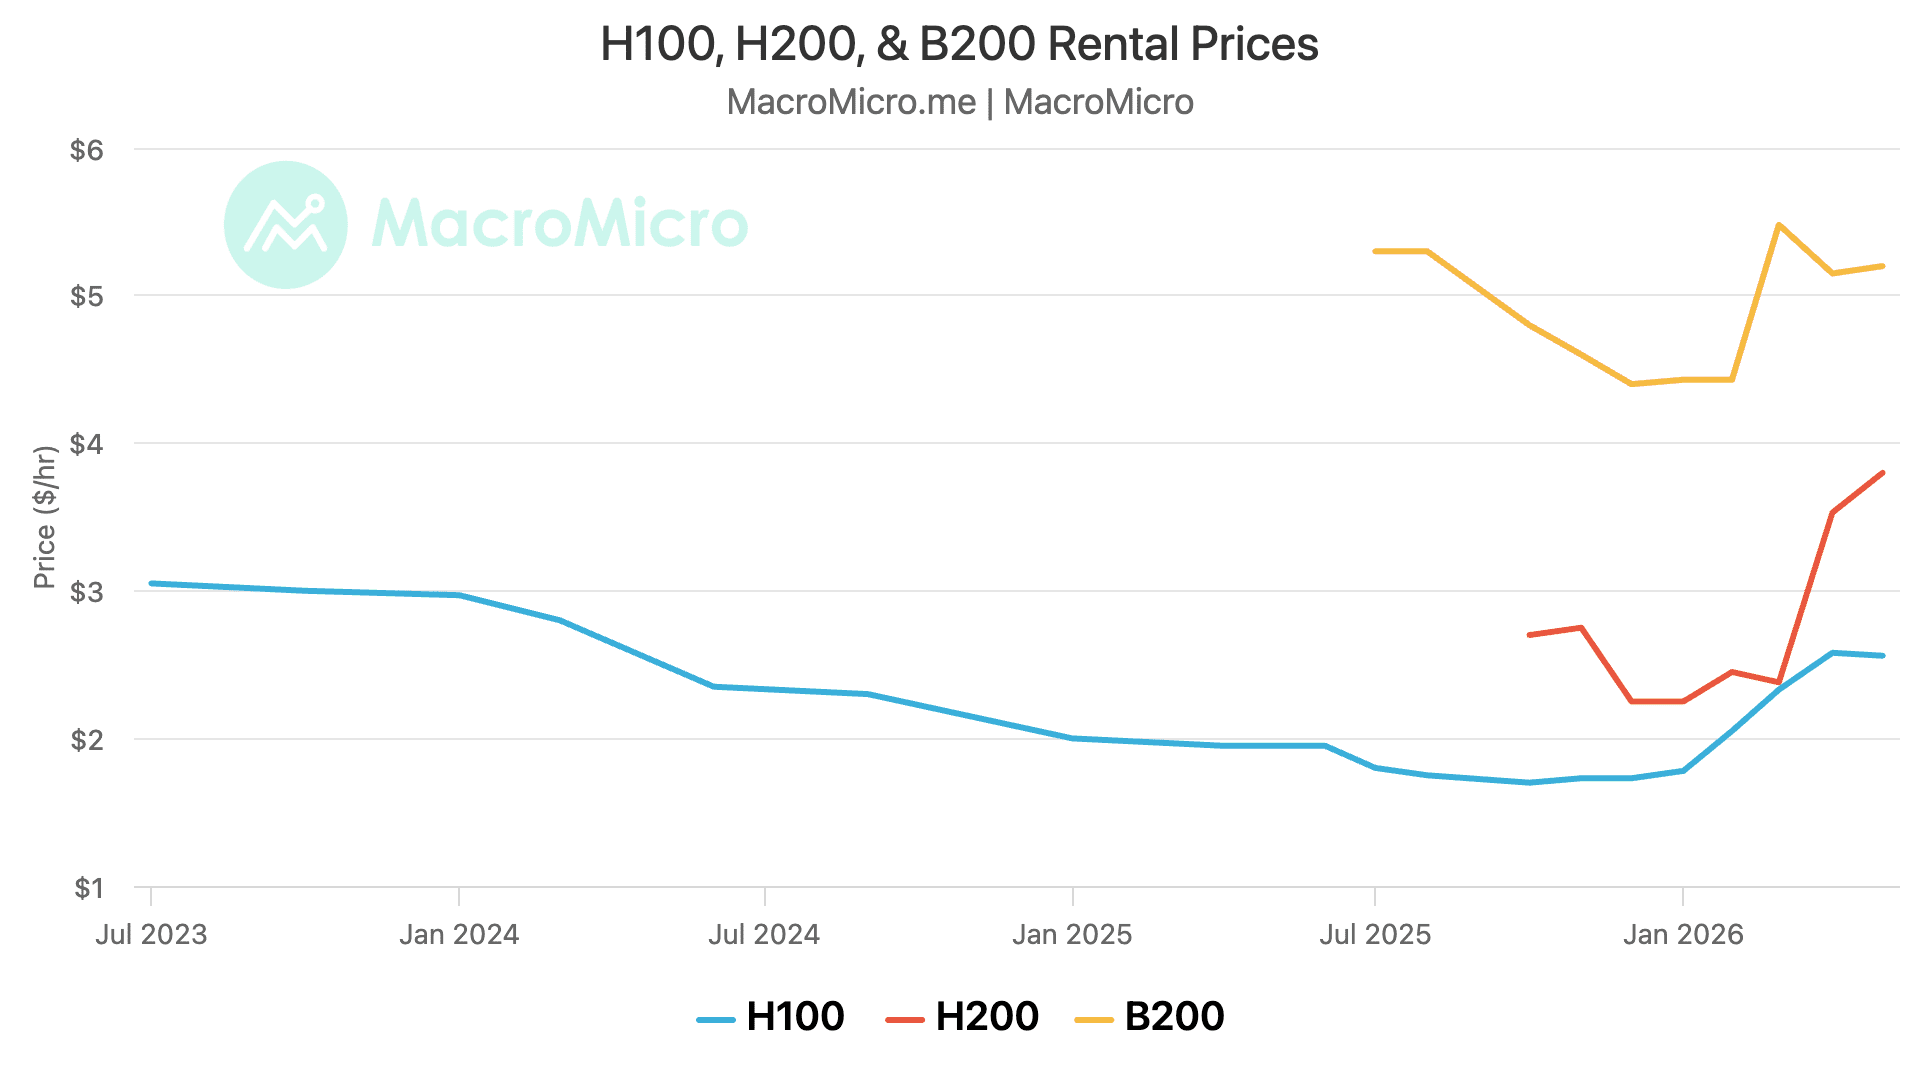
A: The fundamental difference is financial resilience. The four major CSPs, Google, Amazon, Microsoft, and Meta, fund their AI infrastructure from diversified revenue bases including advertising, e-commerce, enterprise software, and cloud services. Their AI investment represents what could be characterized as defensive expansion, carried out with substantial financial cushion. Neocloud providers, by contrast, are almost entirely dependent on GPU rental income, carry negative free cash flow, and are financed through external leverage. Their business model works as long as CSPs and frontier AI labs continue outsourcing compute capacity. The key leading indicator is remaining performance obligations: if Neocloud RPO continues growing, it signals that demand is outpacing CSP internal capacity. The secondary indicator is GPU rental pricing. The H100 one-year contract rate dropped to $1.70 per hour in October 2025, then recovered to $2.35 by March 2026, a 38% increase, driven by surging demand from agentic workflows, open-source inference expansion, and video generation. All capacity coming online through August or September is currently sold out. That data point is favorable for Neocloud operators, but the model remains vulnerable to any sustained softening in hyperscaler compute demand.
Related Reading: The AI Race Is No Longer Zero-Sum: Why Intensifying Competition May Be Extending the Infrastructure Supercycle
Q6. Some argue that the rise of custom ASICs will eventually erode NVIDIA's dominance. How serious is that threat?
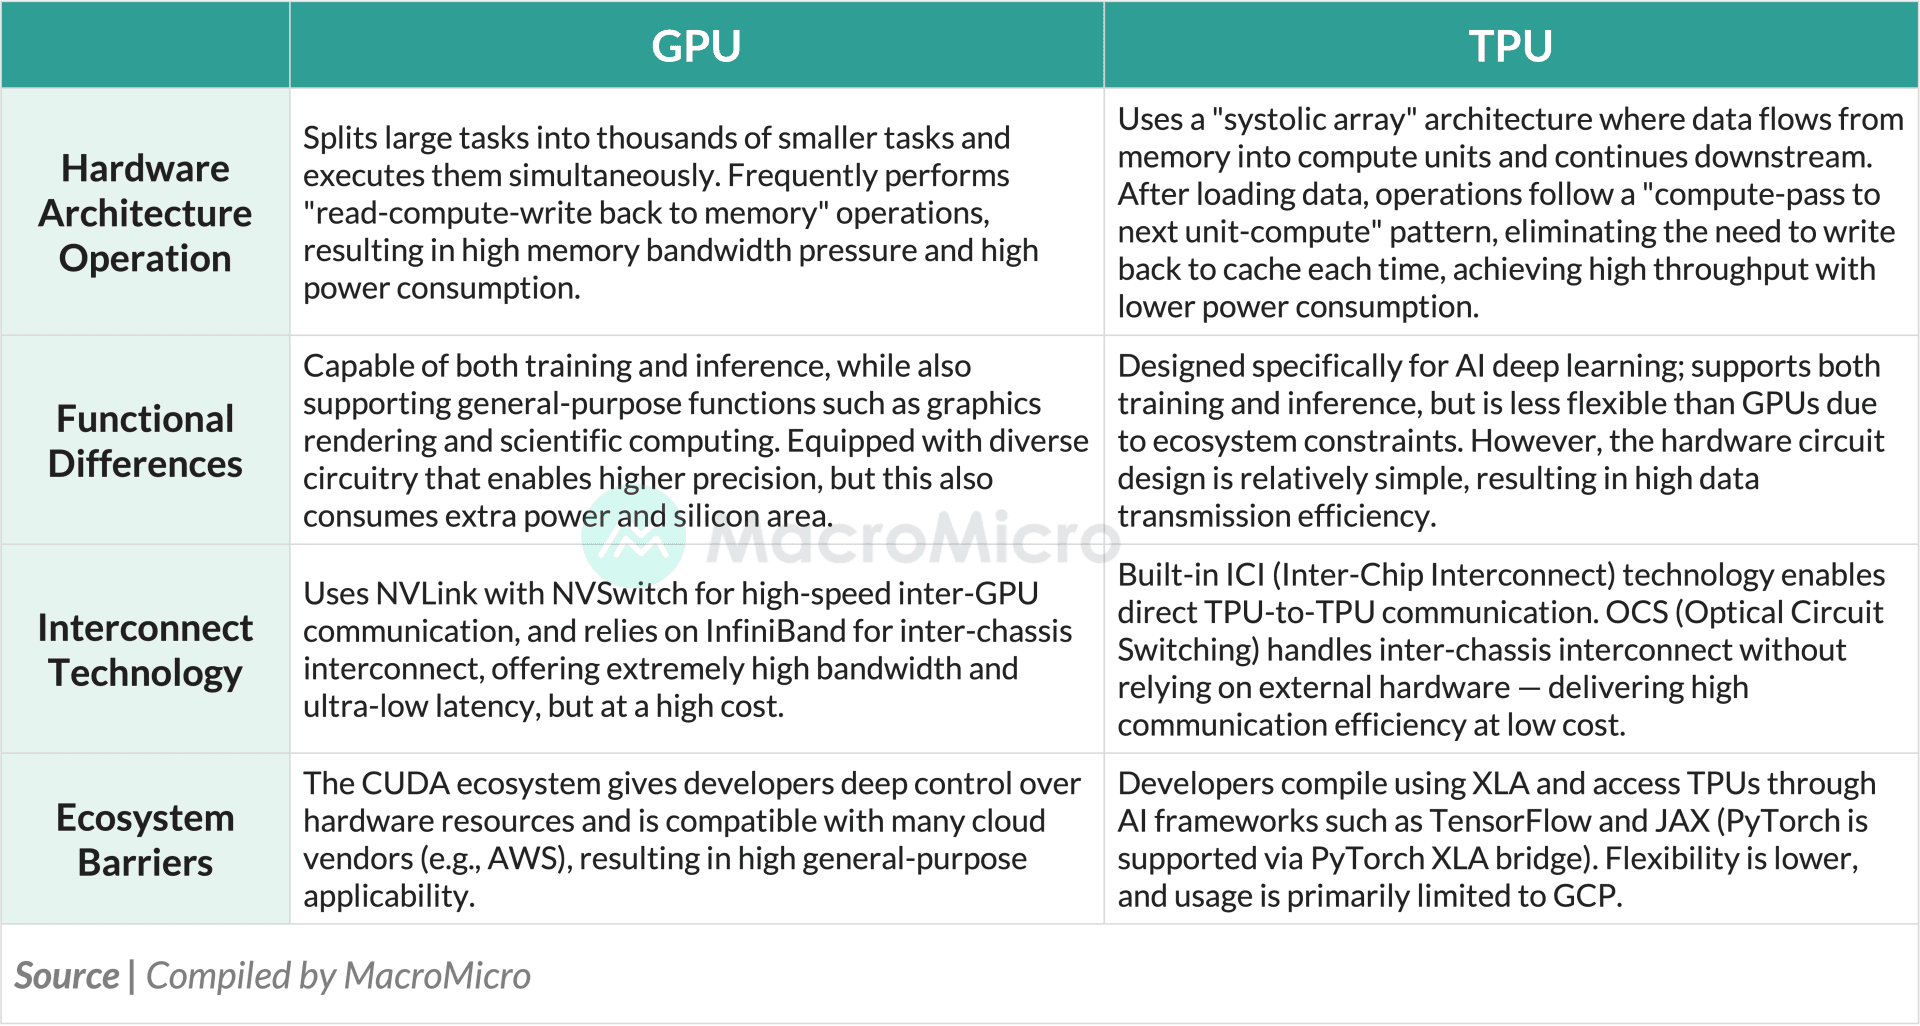
A: It's not, at least not within the current investment cycle. GPU and ASIC chips serve structurally different purposes. GPUs, with NVIDIA's CUDA ecosystem as the reference, are general-purpose parallel computing hardware optimized for flexibility: rapid model iteration, research, and heterogeneous workloads. ASICs, such as Google's TPU series, are purpose-built for specific, stable neural network architectures and excel on efficiency and power consumption, but at the cost of adaptability. In practice, CSPs deploy both in mixed configurations because the economics favor it: GPUs where flexibility is required, ASICs where inference at scale can be optimized. NVIDIA's largest customers remain the four major cloud providers. The pie is not fixed in size. Because AI model development is still in active competition with no settled architecture, demand for both chip types continues to rise together. The scenario in which ASICs directly displace GPU demand at scale would require AI model development to effectively conclude, eliminating the ongoing need for flexible training infrastructure. That condition does not currently exist.
Related Reading: The AI Race Is No Longer Zero-Sum: Why Intensifying Competition May Be Extending the Infrastructure Supercycle
Q7. Anthropic recently surpassed OpenAI in annualized revenue. How did it close that gap so quickly, and does this mean OpenAI is losing ground?
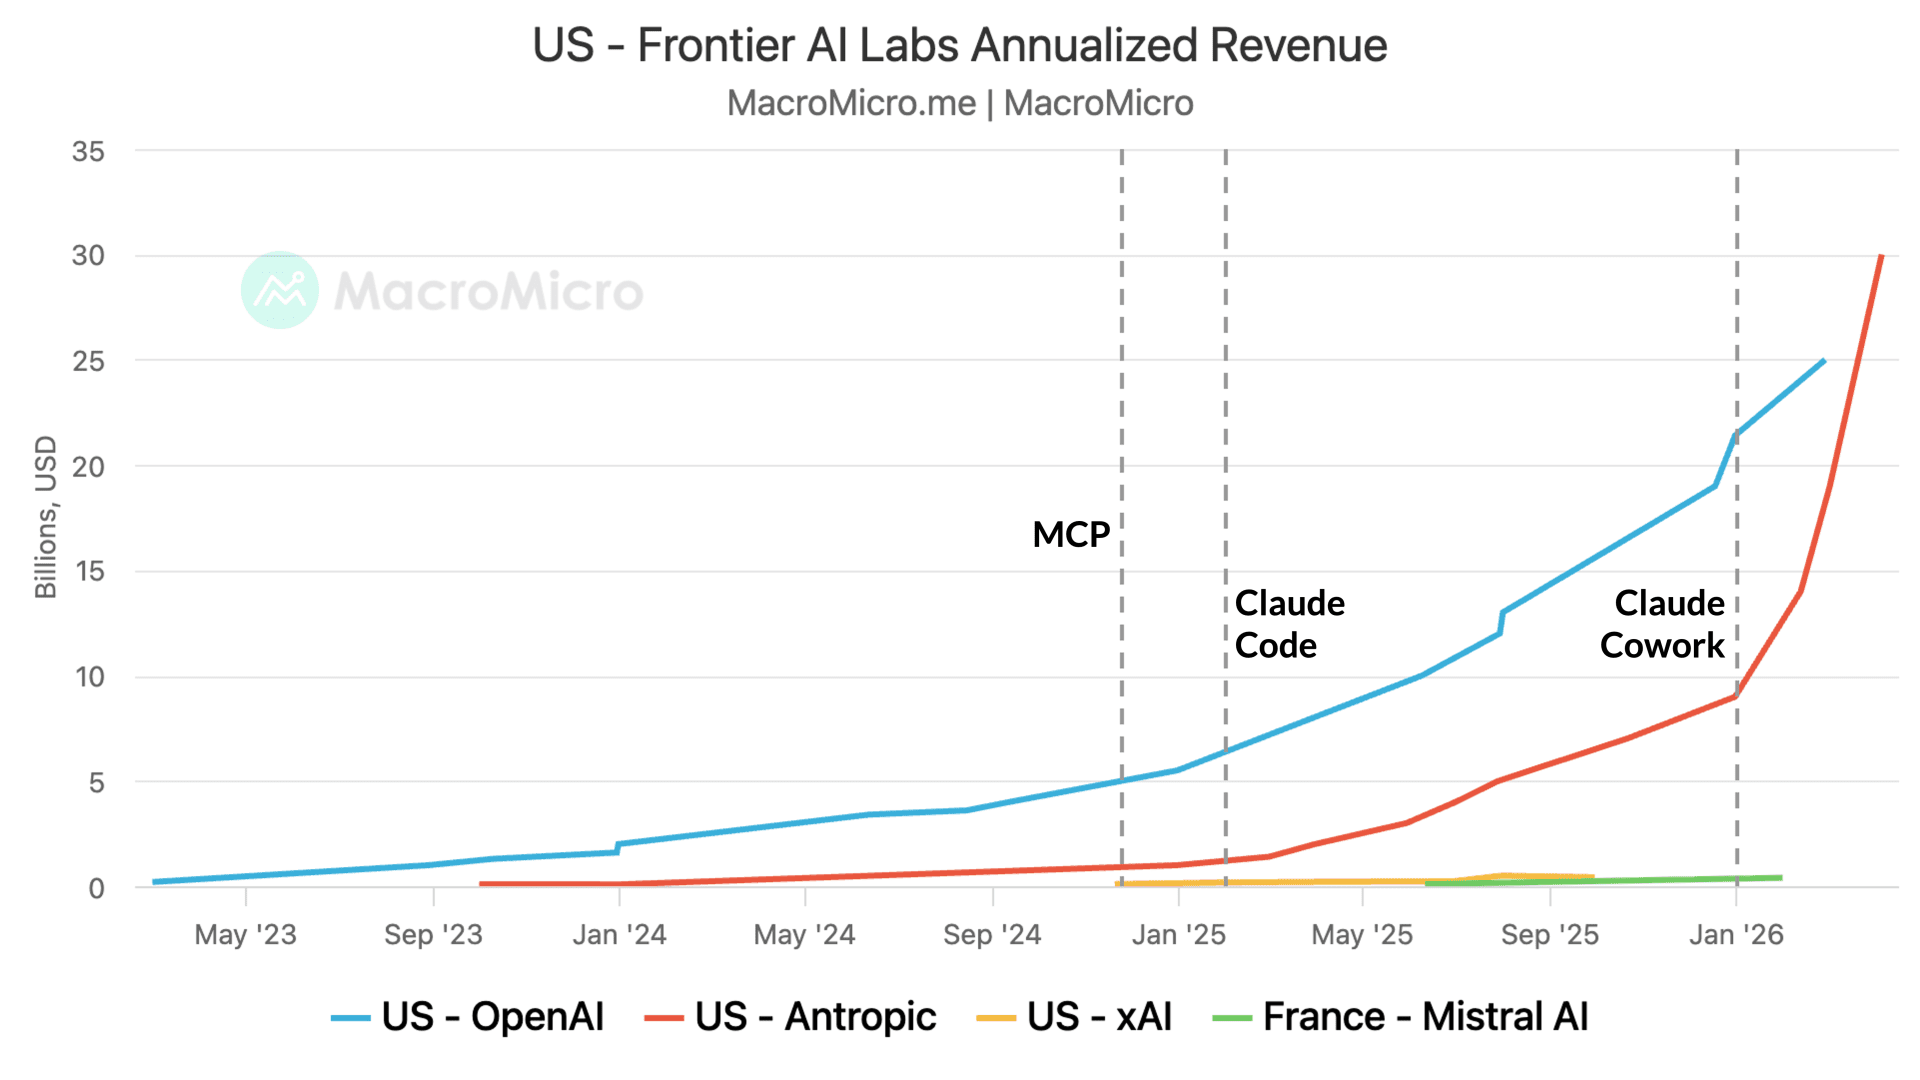
A: Anthropic's ARR crossed $30 billion as of April 2026, reached in roughly three years; AWS needed 14 years to reach comparable revenue scale. Four decisions drove the acceleration. First, Anthropic concentrated almost entirely on enterprise rather than spreading across consumer use cases: 80% of its revenue comes from B2B clients, and it holds an estimated 30 to 40% share of enterprise API spending. Second, Claude Code became a high-velocity product within months of its May 2025 launch, reaching $2.5 billion in annualized revenue by February 2026, with roughly 4% of all public GitHub commits now attributed to it. Third, distributing Claude through both AWS Bedrock and Google Cloud Vertex AI simultaneously gave Anthropic broader enterprise reach without single-platform dependency. Fourth, establishing MCP as an industry protocol expanded its developer ecosystem in ways that compound over time. On the accounting side, Anthropic uses gross revenue recognition, counting full customer payments routed through AWS and GCP, while OpenAI nets out Microsoft's share; direct ARR comparisons need to account for that difference. As for OpenAI's position: its site traffic reached a new high as recently as March 2026. The two companies are competing on different vectors, Anthropic on monetization depth, OpenAI on user breadth, and aggregate AI usage continues to expand across both. The more telling signal is that neither company is primarily taking share from the other; the overall market is still growing.
Related Reading: The Biggest Is Yet to Come
Q8. Beyond data centers and cloud compute, where is the next wave of AI hardware demand likely to come from?
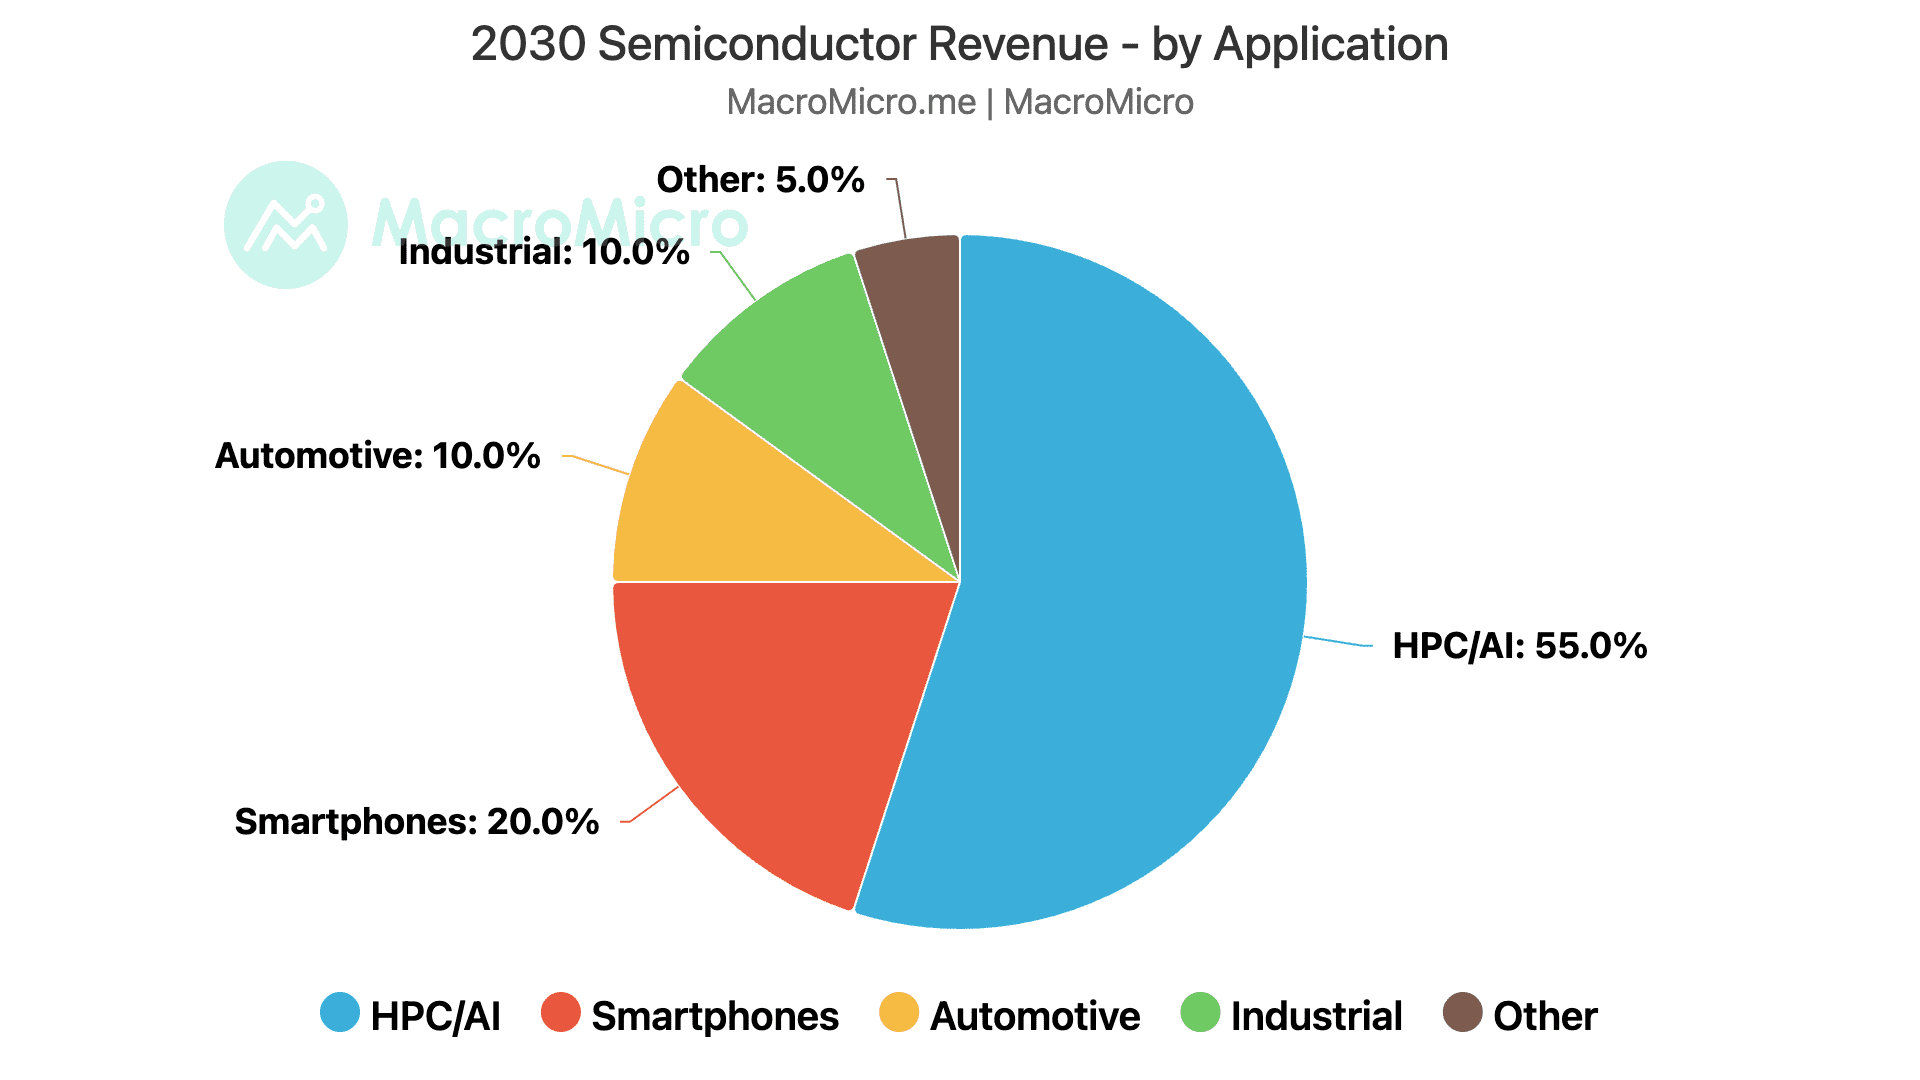
A: Two segments are building toward commercial scale: edge AI and physical AI. Edge AI refers to AI computation running locally on consumer and enterprise devices, including AI PCs, AI-enabled smartphones, smart glasses, and intelligent appliances, rather than routing all inference through cloud servers. The driver is model compression: as leading models improve, smaller derivative models can run effectively on constrained hardware. Physical AI, or embodied AI, refers to systems that understand three-dimensional space and physical rules, enabling autonomous vehicles, drones, and humanoid robots. TSMC's 2026 North America Technology Symposium projections indicate that by 2030, the global semiconductor market could exceed $1.5 trillion, with HPC and AI applications accounting for more than 55% of that total. Smartphones would represent roughly 20%, and automotive plus IoT roughly 10% each. That distribution implies edge AI scales first, following existing consumer electronics upgrade cycles, while physical AI penetration is a medium-to-long-term story. Taiwan benefits from both as a complete hardware supply chain, including SoC design, fabrication, packaging, and component assembly. South Korea benefits primarily through memory content per device, which increases substantially with AI on-device inference, and through Samsung and LG's brand exposure in consumer device categories.
Q9. Taiwan's GDP growth is dramatically outperforming South Korea's, yet Korea's stock market has risen more this year. Why?
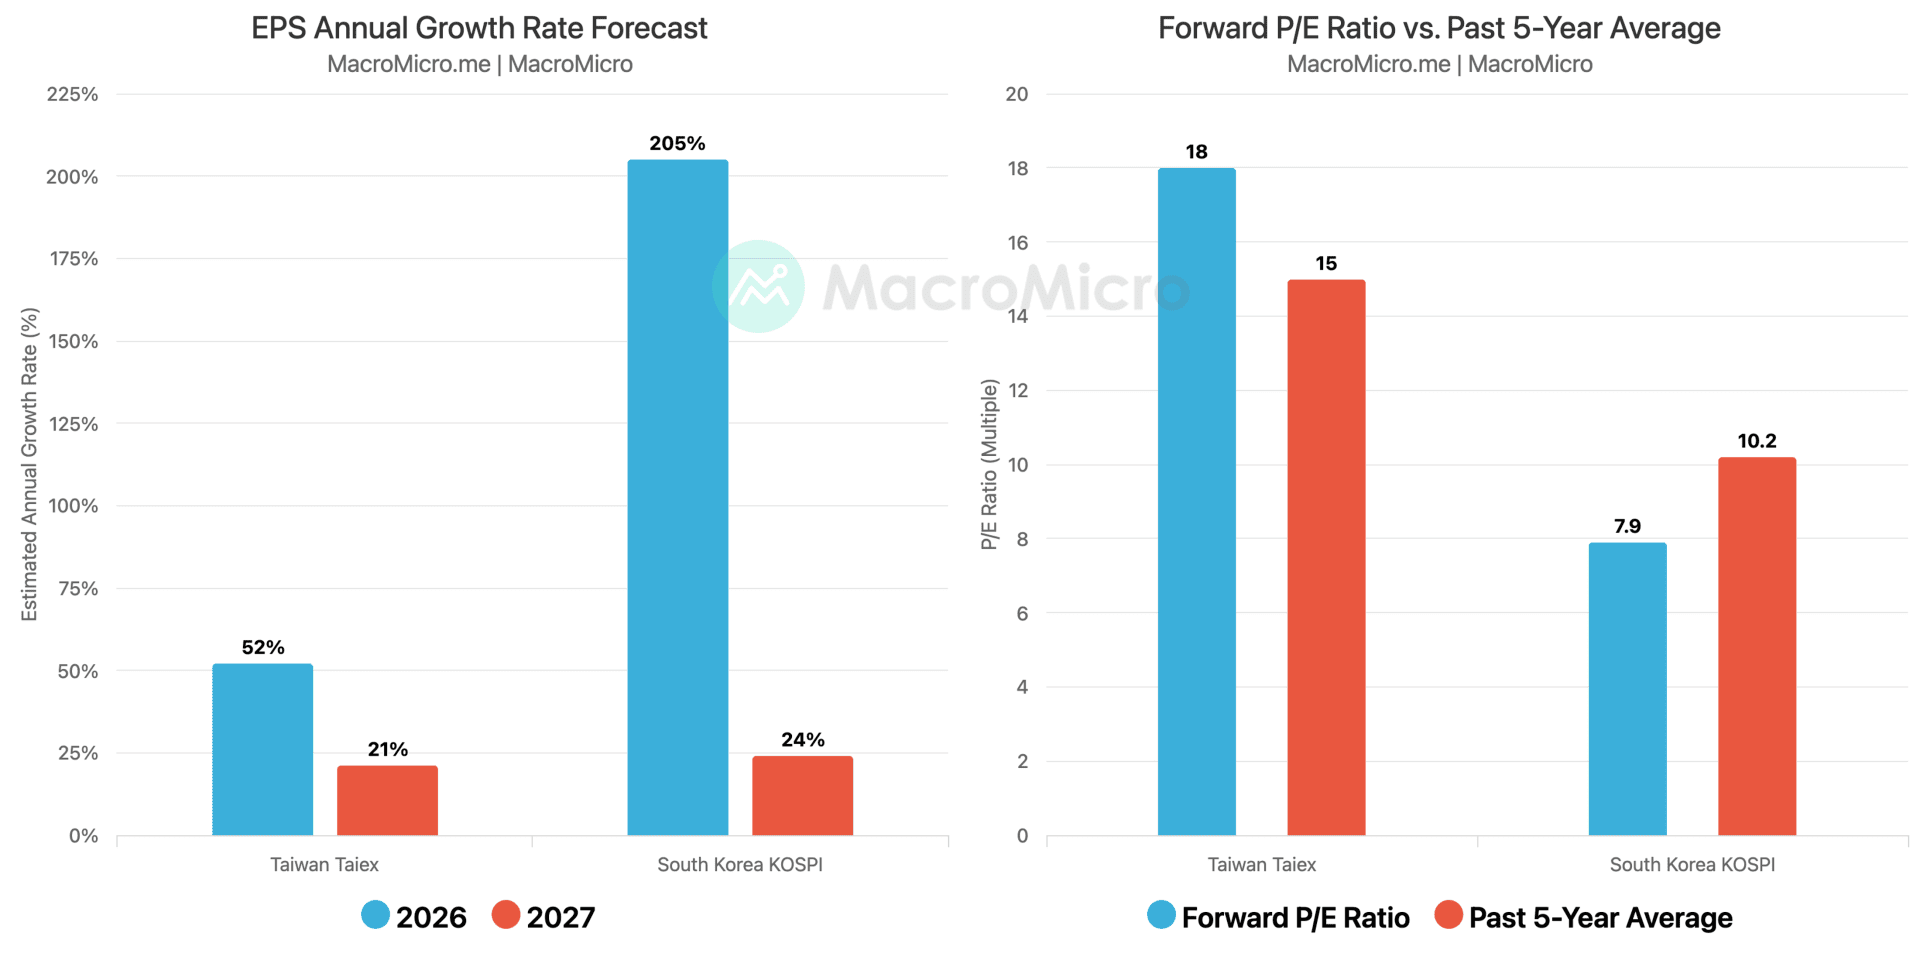
A: The answer lies in valuation starting points and earnings revision magnitude, not economic fundamentals. Taiwan benefited from the first wave of AI hardware demand: advanced logic fabrication, advanced packaging, AI server assembly, and a broad semiconductor supply chain. That advantage was priced into Taiwanese equities earlier, lifting the forward P/E to approximately 18 times 2026 earnings, above the five-year average of 15, before the current cycle began. South Korea entered 2026 with its KOSPI trading near 7.9 times 2026 earnings, below its five-year average of 10.2, because memory was still being valued as a cyclical industry. The trigger for Korean outperformance was structural: DRAM and HBM demand from AI infrastructure proved durable rather than cyclical, driving DRAM contract prices up more than 40% in each of the final two quarters of 2025 into early 2026, and pushing 2026 EPS growth projections for Korean companies above 200%. The market repriced memory from a cyclical asset to a structurally growing one. Taiwan's economy is growing faster in absolute terms; Korea's equities are catching up faster in relative valuation terms. Both are correct simultaneously.
Q10. Taiwan is one of the most semiconductor-dependent economies in the world. Does that concentration create a vulnerability, or is it a sustainable position?
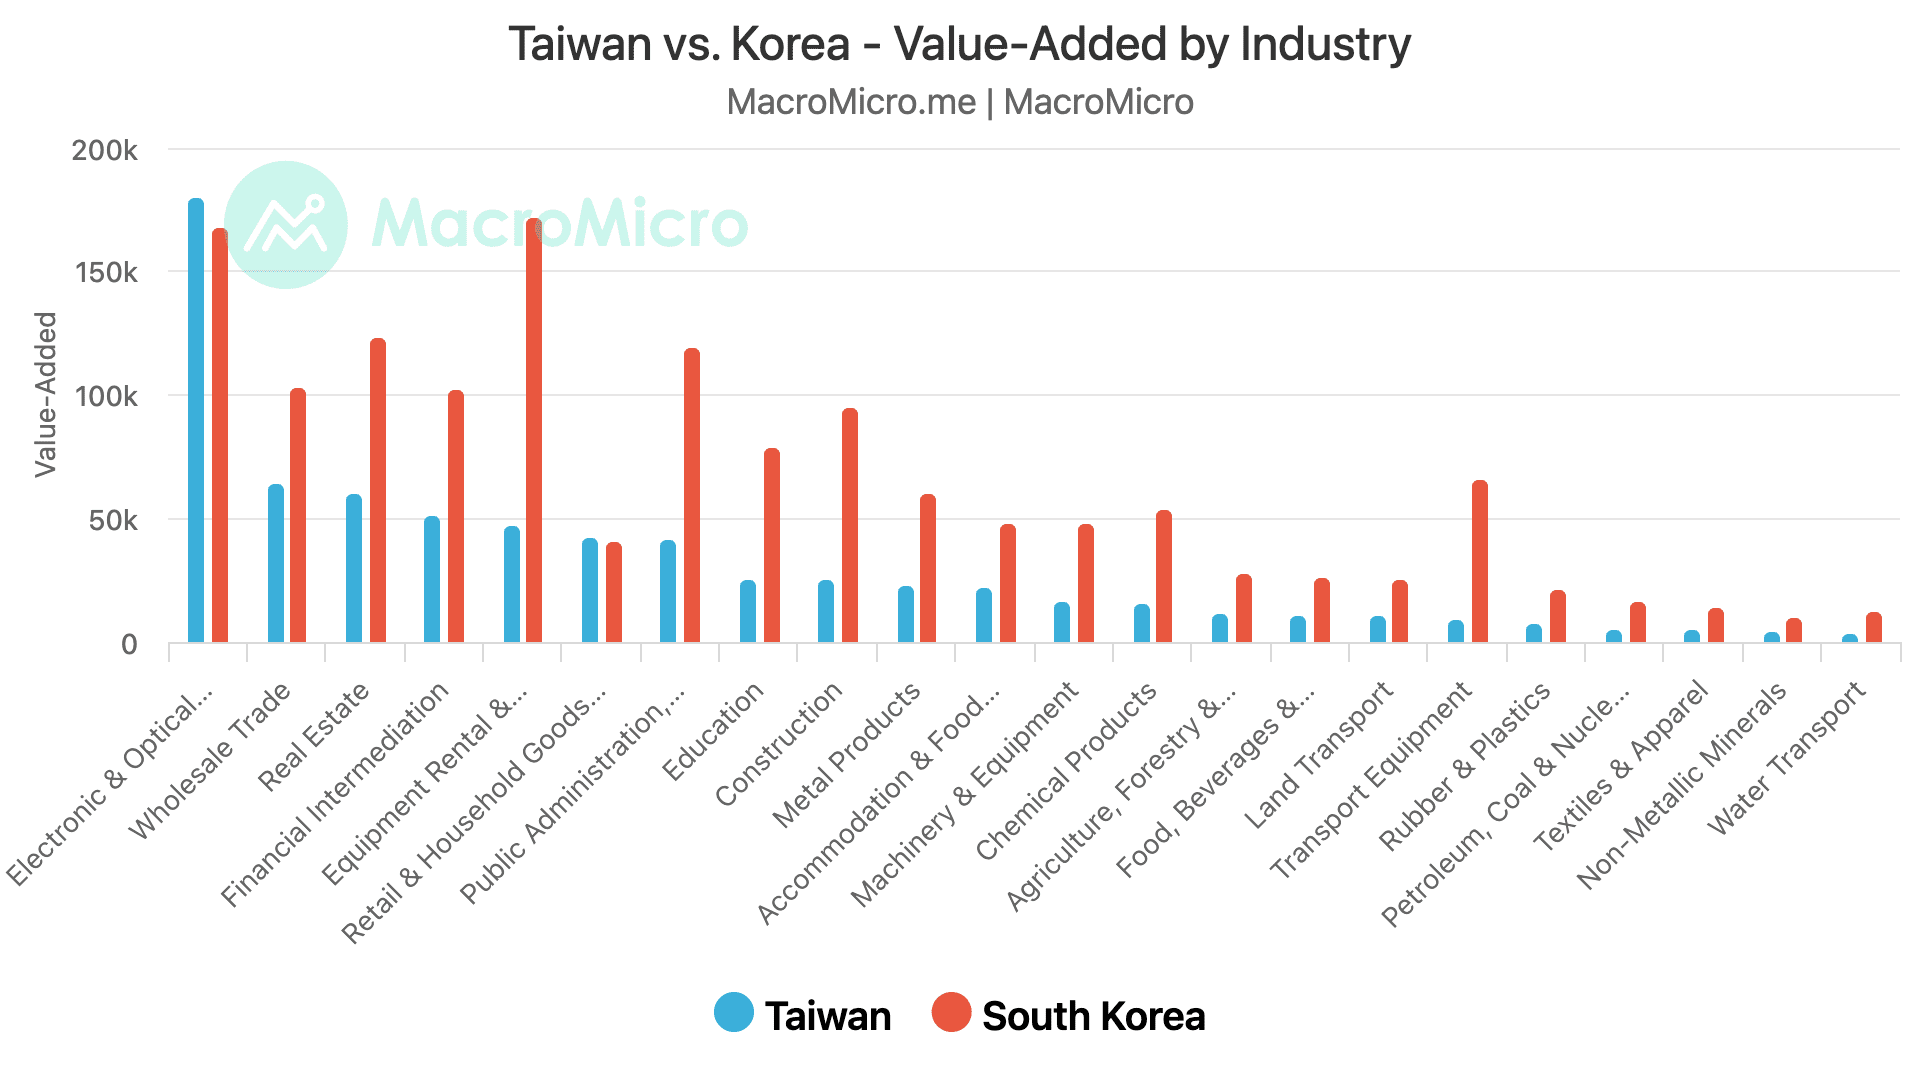
A: The concentration is a genuine risk in the narrow sense that a single-sector disruption would have outsized macroeconomic consequences. But the frequently made comparison to the "Dutch disease" of natural resource dependence does not hold. Natural resources deplete; semiconductors evolve and compound. Taiwan's dominance in advanced logic fabrication attracts ongoing foreign capital investment and international talent, which upgrades the surrounding industrial ecosystem rather than crowding it out. The Asian Development Bank's input-output data makes the point concisely: electronic and optical equipment is the one industry where Taiwan's value-added exceeds South Korea's, a country with a significantly larger population and economy. That is a measure of value density, not volume. Taiwan's export concentration in electronics and ICT products stands at approximately 73% of total exports, versus Korea's ICT export share of roughly 37%, which illustrates both the depth of Taiwan's specialization and its relative exposure to a single demand cycle. The durability of that advantage depends on whether advanced semiconductor fabrication remains a bottleneck technology in the AI buildout, which current capex commitments from all four major CSPs continue to confirm.
Q11. April CPI and PPI both came in well above expectations. How worried should we be, and what does it mean for Fed policy now that Warsh is confirmed as chair?
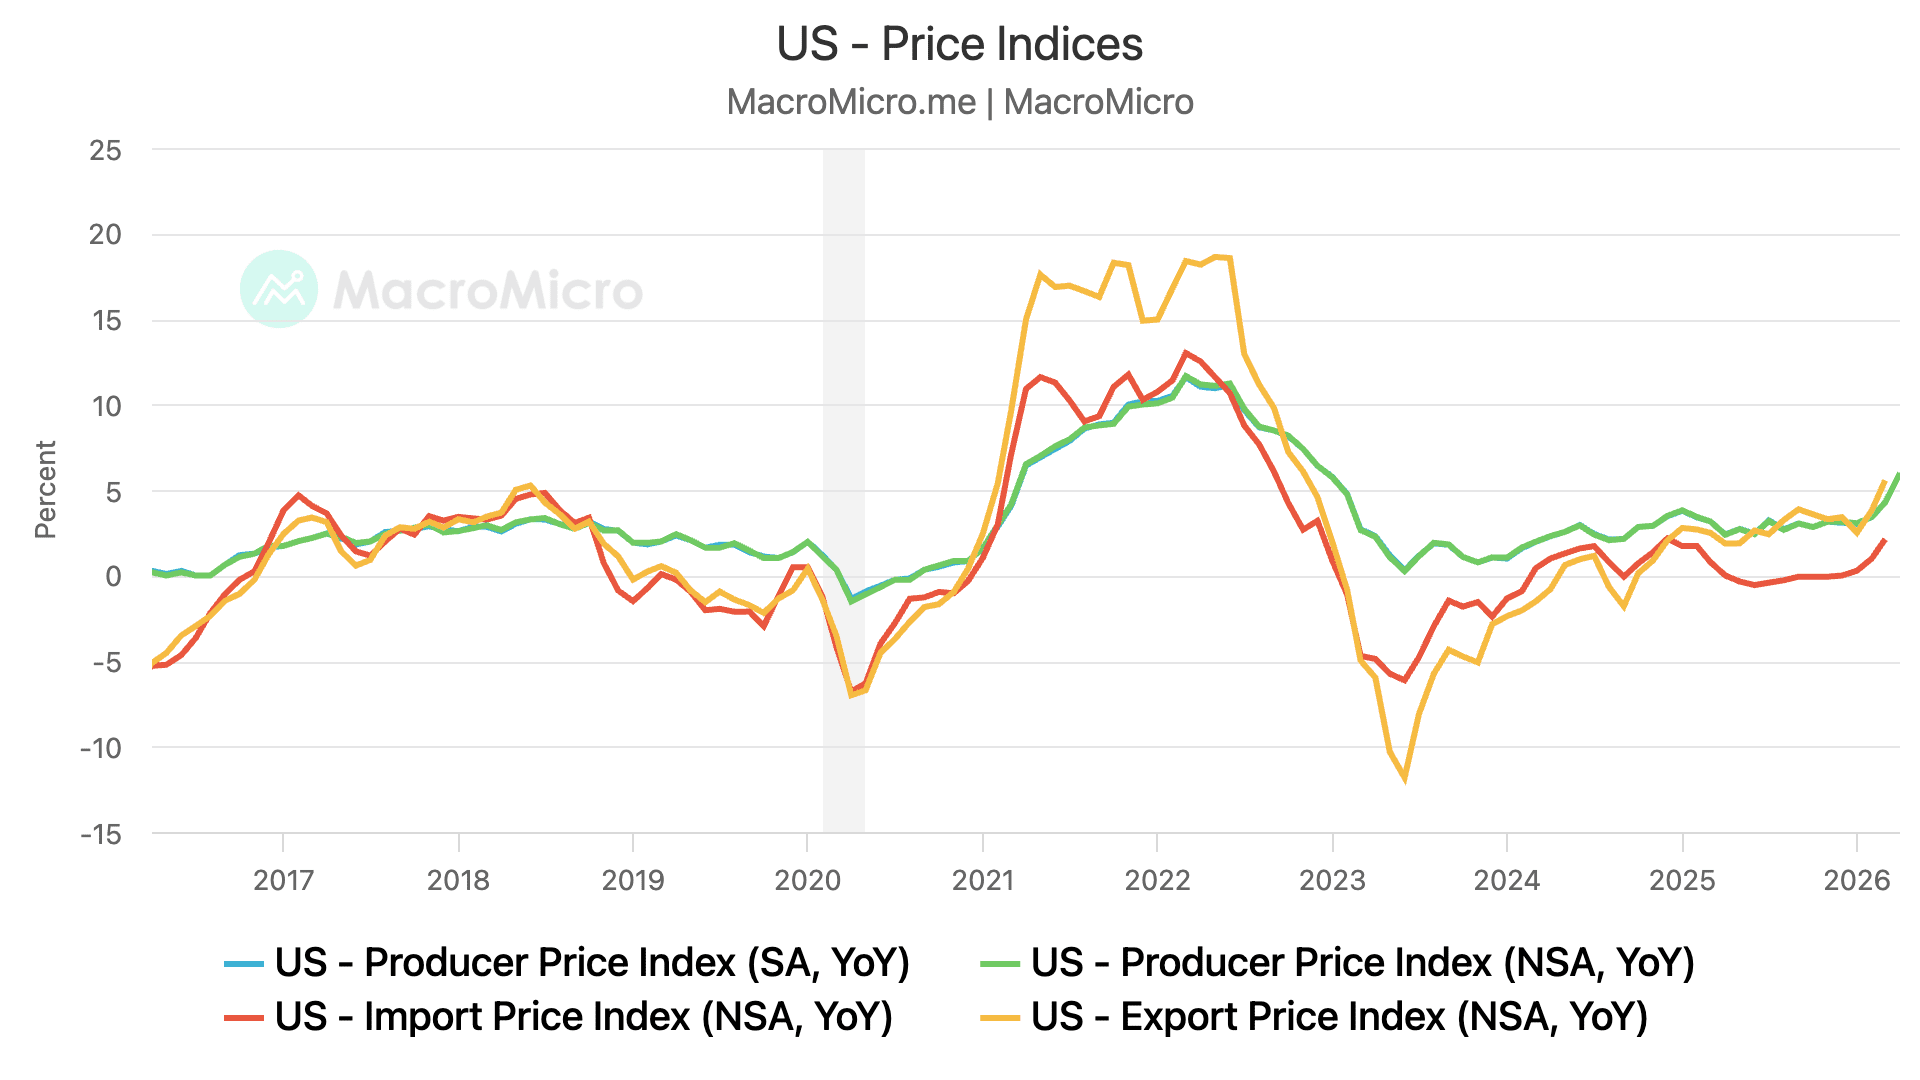
A: The numbers are worth taking seriously. April PPI jumped to 6.0% year over year from 4.3%, with the monthly gain of 1.4% the highest since March 2022. What makes this print more concerning than the headline is that the pressure is no longer just energy: oil prices have now been elevated long enough to pass through into services, with trucking, air freight, and fuel retail all moving sharply higher. CPI told the same story, with headline and core year-over-year rates of 3.8% and 2.7%, both at recent highs. With Hormuz Strait shipping still disrupted, there is no obvious near-term relief valve on the upstream side. Markets have absorbed this: FedWatch currently puts the probability of rates staying unchanged through year-end at around 70%, with a roughly 30% chance of a hike. This is a difficult environment for Warsh to walk into. His policy instincts lean toward cuts: he has argued that AI productivity growth is structurally disinflationary, and he favors using balance sheet reduction as the primary tightening tool rather than keeping rates high. That case may hold over a longer horizon, but June is too soon to act on it. The most realistic near-term outcome is a chair who wants to cut, but cannot.
About On the Question
On the Question compiles macroeconomic, investment, and geopolitical risk questions submitted by our corporate clients. Our clients span a broad range of industries, including financial services, semiconductors and electronics, automotive manufacturing, shipping and logistics, steel and heavy industry, real estate development, energy and petrochemicals, and many other key sectors across the global economy. On the Question is released monthly.
